Chronische
Erkrankungen und
Ernährung
←
→
Transkription von Seiteninhalten
Wenn Ihr Browser die Seite nicht korrekt rendert, bitte, lesen Sie den Inhalt der Seite unten
Chronische Erkrankungen und Ernährung
Ausmaß des Problems

• Chronische Erkrankungen → Todesursache #1 weltweit
• 1990: 56% aller Todesursachen1
• 2017: 73% aller Todesursachen2
• Tendenz steigend
Welche Erkrankungen sind verhinderbar?

• Kardiovaskuläre Erkrankungen
• 75 % modifizierbaren Ursachen3
• Krebs
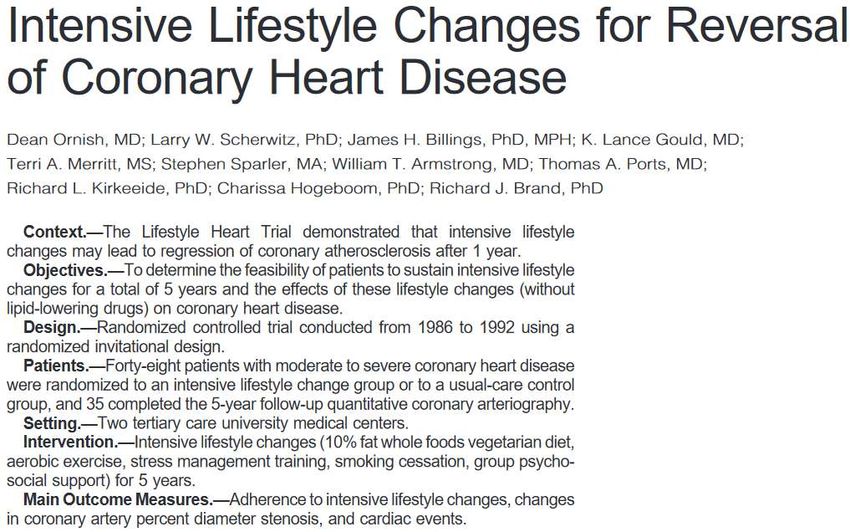
Results

Nach 1 Jahr:
• 91%ige Frequenzreduktion der Angina-Episoden
• LDL-Cholesterin -37%
Nach 5 Jahren:
• Halbierung der kardialen Events
• Signifikanter Rückgang der Plaque-Größe in 82%
Bluthochdruck

•   Größter einzelner Risikofaktor4
•   31,1% der Weltbevölkerung (1,39 Milliarden)5
•   CVD-Risiko steigt um 50% mit jeder Erhöhung um 20/10 mmHg6
•   Gesamteinfluss der Gene: 3,5%7
•   Optimal:
Blutdrucksenkung durch Interventionen
      Gewichtsverlust 5 kg⁸   Salzrestriktion⁹   Alkoholrestriktion¹⁰             Obst & Gemüse¹¹   Ausdauertraining¹²   DASH-Diät¹¹
 0

 -2

 -4

 -6

 -8

-10

-12
                                                                  RR systolisch

                                   DASH = Dietary Approaches to Stop Hypertension
Yokoyama Y, Nishimura K, Barnard ND, et al. Vegetarian diets and blood pressure: a meta-analysis. JAMA Intern Med. 2014;174(4):577-587.
doi:10.1001/jamainternmed.2013.14547
Blutdrucksenkung durch Interventionen
Gewichtsverlust 5 kg⁸ Salzrestriktion⁹ Alkoholrestriktion¹⁰ Obst & Gemüse¹¹ Ausdauertraining¹² DASH-Diät¹¹ Medikament¹³ WFPBD¹⁴
0
-2
-4
-6
-8
-10
-12
-14
-16
-18
-20
RR systolisch
DASH = Dietary Approaches to Stop Hypertension
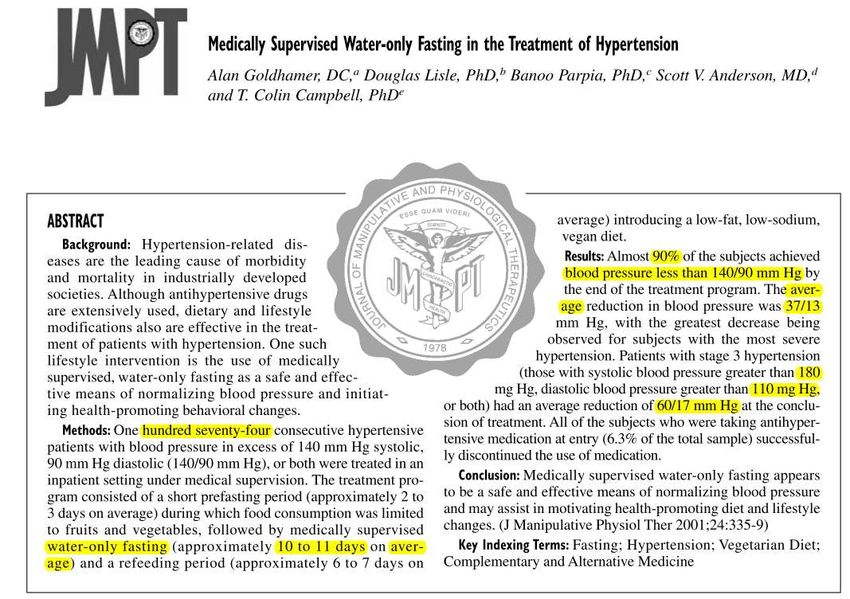
WFPBD = Whole food plant-based dietBlutdrucksenkung durch Interventionen
Gewichtsverlust 5
kg⁸ Salzrestriktion⁹ Alkoholrestriktion¹⁰ Obst & Gemüse¹¹ Ausdauertraining¹² DASH-Diät¹¹ Medikament¹³ WFPBD¹⁴ 11d Fasten¹⁵
0
-5
-10
-15
-20
-25
-30
-35
-40
RR systolisch
DASH = Dietary Approaches to Stop Hypertension
WFPBD = Whole food plant-based dietCholesterin – Ist normal auch gesund?
O’Keefe JH, Cordain L, Harris WH, Moe RM, Vogel R. Optimal low-density lipoprotein is 50 to 70 mg/dl: Lower is better and
physiologically normal. Journal of the American College of Cardiology. 2004;43(11):2142-2146. doi:10.1016/j.jacc.2004.03.046Cholesterin – Ist normal auch gesund?
O’Keefe JH, Cordain L, Harris WH, Moe RM, Vogel R. Optimal low-density lipoprotein is 50 to 70 mg/dl: Lower is better and
physiologically normal. Journal of the American College of Cardiology. 2004;43(11):2142-2146. doi:10.1016/j.jacc.2004.03.046Blutcholesterin – Wie senken? Vermeiden von: • Transfetten
Blutcholesterin – Wie senken? Vermeiden von: • Transfetten • Gesättigten Fettsäuren
Blutcholesterin – Wie senken? Vermeiden von: • Transfetten • Gesättigten Fettsäuren • Nahrungscholesterin
Blutcholesterin – Wie senken? Vermeiden von: • Transfetten • Gesättigten Fettsäuren • Nahrungscholesterin → Ersetze mit einfach und mehrfach ungesättigten Fettsäuren16
Blutcholesterin – Wie senken?
• Ballaststoffe (erhöhte Gallensäureausscheidung, gedämpfter
  postprandialer Glukoseanstieg, Fermentationsprodukte)17
• Soja (Isoflavone, Phytoöstrogene)
• Nüsse (ungesättigte Fettsäuren)
• Phytosterine (hemmen Cholesterinaufnahme kompetitiv)

            → Portfolio Diät18
Resultate
Risikofaktor – Diabetes Mellitus Typ II

• Inzidenz steigt mit Zuckerkonsum19   • Assoziation mit verarbeitetem &
                                         rotem Fleisch20

                                                J. Samuel Burner, Raw beef slices, CC BY 2.0
Risikofaktor – TMAO*
• Phosphatidylcholin (Eier und
andere tierische Produkte)21
• Carnitin (rotes Fleisch)22
• Thrombozytenhyperreaktivität
und Thrombusformation
Tang WHW, Wang Z, Levison BS, et al. Intestinal Microbial Metabolism of Phosphatidylcholine and
Cardiovascular Risk. N Engl J Med. 2013;368(17):1575-1584. doi:10.1056/NEJMoa1109400
*TrimethylaminoxidRisikofaktor –TMAO*
• Phosphatidylcholin (Eier und
andere tierische Produkte)21
• Carnitin (rotes Fleisch)22
• Thrombozytenhyperreaktivität
und Thrombusformation
• N = 530 mit Akutem
Koronarsyndrom23
Li XS, Obeid S, Klingenberg R, et al. Gut microbiota-dependent trimethylamine N-oxide in acute coronary
syndromes: a prognostic marker for incident cardiovascular events beyond traditional risk factors. European Heart
Journal. 2017;38(11):814-824. doi:10.1093/eurheartj/ehw582
*TrimethylaminoxidRisikofaktor – TMAO*
• Phosphatidylcholin (Eier und
andere tierische Produkte)21
• Carnitin (rotes Fleisch)22
• Thrombozytenhyperreaktivität
und Thrombusformation
• N = 530 mit Akutem
Koronarsyndrom23
• Vegetarier metabolisieren
Carnitin nicht zu TMAO22
Koeth RA, Wang Z, Levison BS, et al. Intestinal microbiota metabolism of l-carnitine, a
nutrient in red meat, promotes atherosclerosis. Nat Med. 2013;19(5):576-585.
doi:10.1038/nm.3145
*TrimethylaminoxidÜbergewicht und Krebs
• Erhöhtes Risiko für 13 Krebsarten24
• Chronische Entzündung
• Angiogenese (VEGF)
• Östrogenproduktion
• Insulin-Like Growth Factor (IGF)25
Photo: Center for Disease Control and PreventionDickdarmkrebs und Ernährung • Dritthäufigste Krebsart in Österreich26 • Vermeide: Übergewicht, Alkohol27, verarbeitetes (RR 1,18 pro 50g/d) und rotes Fleisch (RR 1,17 pro 100g/d)28 • Protektiv: Sport, Vollkornprodukte, Milchprodukte, Ballaststoffe27
Fehlende Nährstoffe?
Mangelernährung?
Kritische Nährstoffe – Protein
• Täglicher Bedarf für Erwachsene: 0,8 g/kg
• 70kg Person: 56g Protein/d
• Erhöhter Bedarf bei bestimmten Personengruppen29
Kritische Nährstoffe –
              Proteinquantität
              • Proteinanteil / 100g:
                              Ei 13g, Käse 25g, Rindfleisch 26g,
                              Hühnerfleisch 27g

FoodData Central. Accessed March 4, 2021. https://fdc.nal.usda.gov/
Kritische Nährstoffe –
Proteinquantität
• Proteinanteil / 100g:
Ei 13g, Käse 25g, Rindfleisch 26g,
Hühnerfleisch 27g
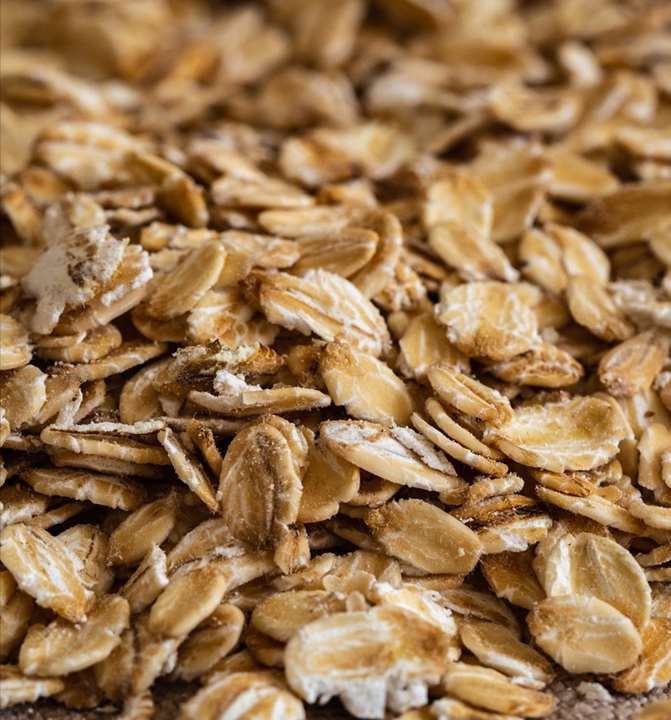
Gerste 12g, Hafer 12,5g,
Weizenspaghetti 12,5g, Quinoa 12g
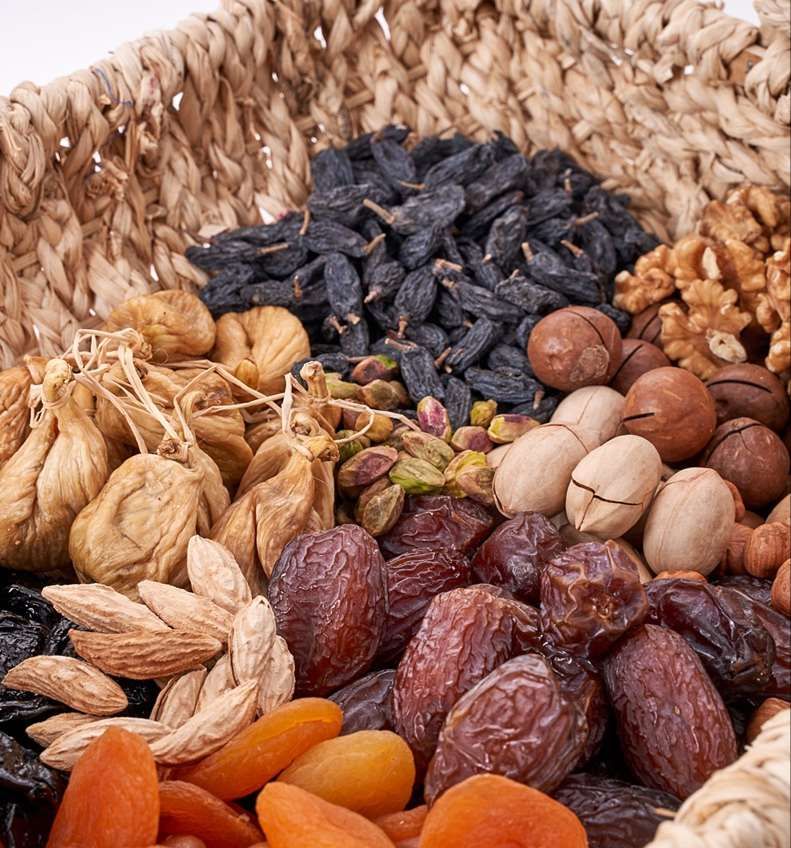
FoodData Central. Accessed March 4, 2021. https://fdc.nal.usda.gov/Kritische Nährstoffe –
Proteinquantität
• Proteinanteil / 100g:
Ei 13g, Käse 25g, Rindfleisch 26g,
Hühnerfleisch 27g
Gerste 12g, Hafer 12,5g,
Weizenspaghetti 12,5g, Quinoa 12g
Cashews 18g, Leinsamen 18g,
Kürbiskerne 19g, Mandeln 20g
FoodData Central. Accessed March 4, 2021. https://fdc.nal.usda.gov/Kritische Nährstoffe –
Proteinquantität
• Proteinanteil / 100g:
Ei 13g, Käse 25g, Rindfleisch 26g,
Hühnerfleisch 27g
Gerste 12g, Hafer 12,5g,
Weizenspaghetti 12,5g, Quinoa 12g
Cashews 18g, Leinsamen 18g,
Kürbiskerne 19g, Mandeln 20g
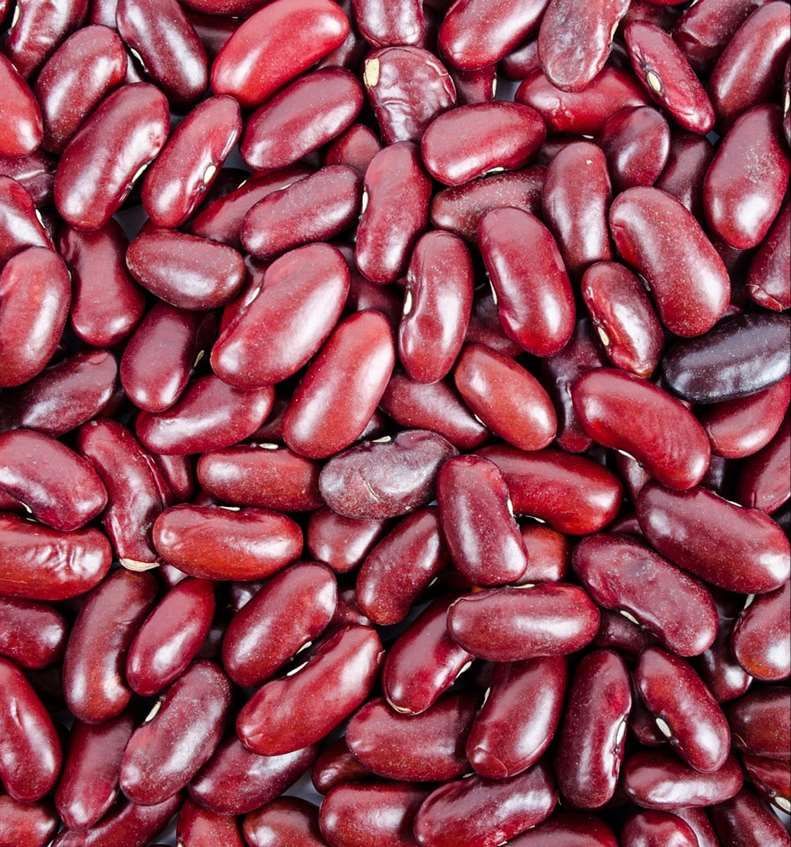
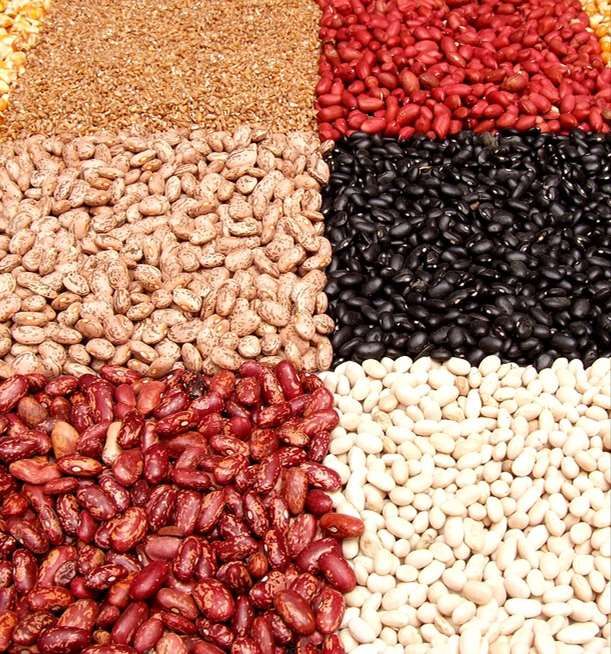
Tofu 8g, Tempeh 19g, Kichererbsen 19g,
Kidney-Bohnen 24g, Linsen 26g,
Hefeflocken 50g
FoodData Central. Accessed March 4, 2021. https://fdc.nal.usda.gov/Kritische Nährstoffe – Eisen • (Pflanzliches) Nicht-Hämeisen schlechter absorbiert (~5%) • Täglicher Eisenverlust 1-1,5 mg • Bedarf an Nicht-Hämeisen: 20mg-30mg/d30
Kritische Nährstoffe – Eisen • (Pflanzliches) Nicht-Hämeisen schlechter absorbiert (~5%) • Täglicher Eisenverlust 1-1,5 mg • Bedarf an Nicht-Hämeisen: 20mg-30mg/d30 • Vitamin C erhöht Absorption • Tee/schwarzer Kaffee inhibiert sie31
Kritische Nährstoffe –
               Eisenquantität
               • Eisenanteil / 100g:
                              Rindfleisch 2,6 mg

FoodData Central. Accessed March 4, 2021. https://fdc.nal.usda.gov/
Kritische Nährstoffe –
Eisenquantität
• Eisenanteil / 100g:
Rindfleisch 2,6 mg
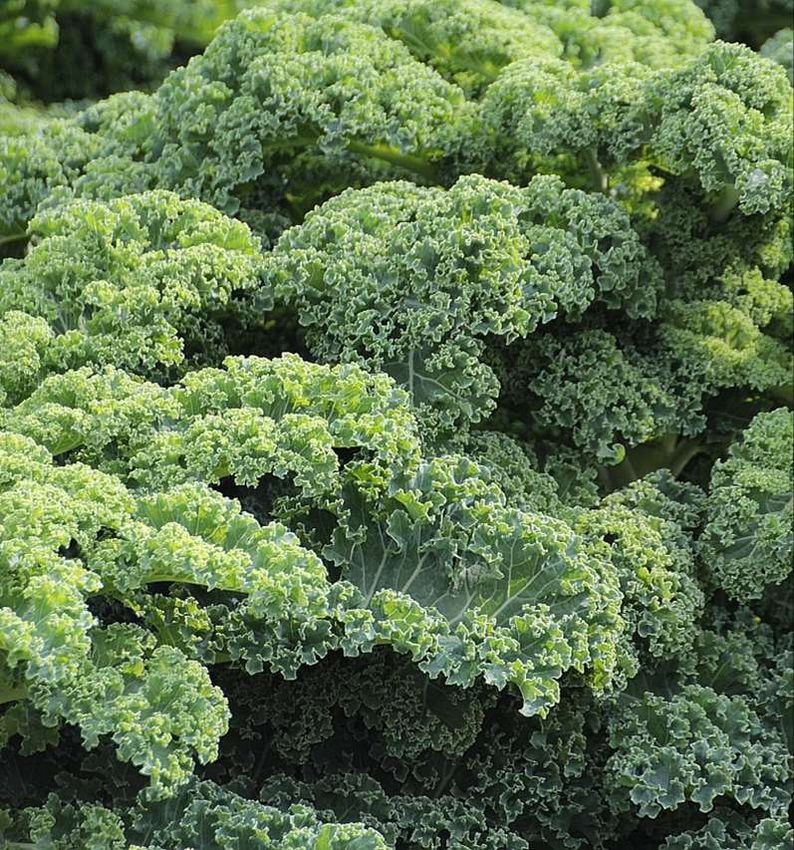
Grünkohl 1,5 mg, Mangold 1,8 mg
FoodData Central. Accessed March 4, 2021. https://fdc.nal.usda.gov/Kritische Nährstoffe –
Eisenquantität
• Eisenanteil / 100g:
Rindfleisch 2,6 mg
Grünkohl 1,5 mg, Mangold 1,8 mg
Getrocknete Marille 2,7 mg,
Kürbiskerne 3,3 mg, Sonnenblumen-
kerne 5,3 mg, Cashews 6,7 mg
FoodData Central. Accessed March 4, 2021. https://fdc.nal.usda.gov/Kritische Nährstoffe –
Eisenquantität
• Eisenanteil / 100g:
Rindfleisch 2,6 mg
Grünkohl 1,5 mg, Mangold 1,8 mg
Getrocknete Marille 2,7 mg,
Kürbiskerne 3,3 mg, Sonnenblumen-
kerne 5,3 mg, Cashews 6,7 mg
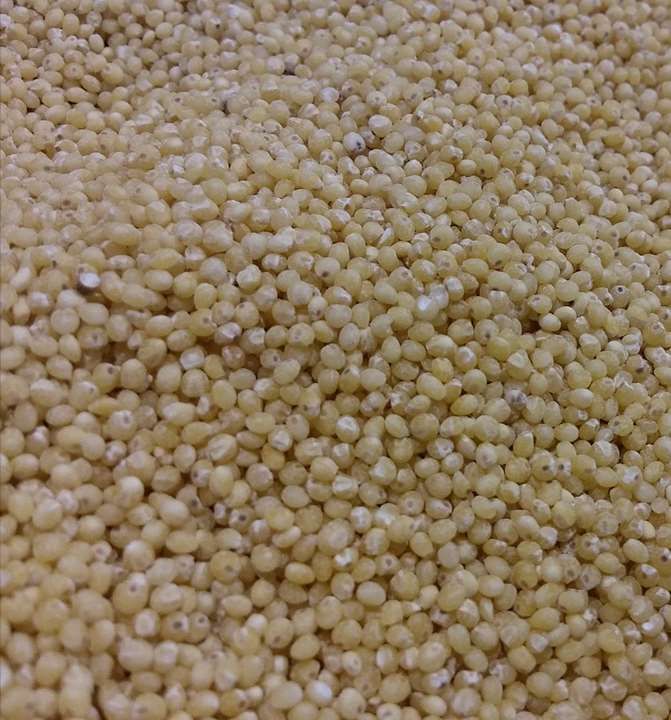
Hirse 3 mg, Gerste 3,6 mg,
Hafer 4,25 mg
FoodData Central. Accessed March 4, 2021. https://fdc.nal.usda.gov/Kritische Nährstoffe –
Eisenquantität
• Eisenanteil / 100g:
Rindfleisch 2,6 mg
Grünkohl 1,5 mg, Mangold 1,8 mg
Getrocknete Marille 2,7 mg,
Kürbiskerne 3,3 mg, Sonnenblumen-
kerne 5,3 mg, Cashews 6,7 mg
Hirse 3 mg, Gerste 3,6 mg,
Hafer 4,25 mg
Linsen 3,3 mg, Hefeflocken 6 mg,
Kichererbsen 6,2 mg, Kidney-Bohnen 8,2 mg
FoodData Central. Accessed March 4, 2021. https://fdc.nal.usda.gov/Kritische Nährstoffe – Vitamin B12 • Nur von Bakterien/Mikroorganismen produziert (Wiederkäuer) • Auch Schweine & Hühner müssen es aufnehmen32 • Veganer/Vegetarier müssen supplementieren! • Anämie, Neurologische Ausfälle, Thrombosegefahr (Mangel)33 • Supplement: 50 μg/d oder 2000 μg/Woche34
Referenzen
1.    GBD 2013 Mortality and Causes of Death Collaborators. Global, regional, and national age-sex specific all-cause and cause-specific mortality for 240 causes of death, 1990-
      2013: a systematic analysis for the Global Burden of Disease Study 2013. Lancet. 2015;385(9963):117-171. doi:10.1016/S0140-6736(14)61682-2
2.    Roth GA, Abate D, Abate KH, et al. Global, regional, and national age-sex-specific mortality for 282 causes of death in 195 countries and territories, 1980–2017: a systematic
      analysis for the Global Burden of Disease Study 2017. The Lancet. 2018;392(10159):1736-1788. doi:10.1016/S0140-6736(18)32203-7
3.    https://www.who.int/dietphysicalactivity/media/en/gsfs_general.pdf
4.    Lim SS, Vos T, Flaxman AD, et al. A comparative risk assessment of burden of disease and injury attributable to 67 risk factors and risk factor clusters in 21 regions, 1990–
      2010: a systematic analysis for the Global Burden of Disease Study 2010. Lancet. 2012;380(9859):2224-2260. doi:10.1016/S0140-6736(12)61766-8

5.    Mills KT, Bundy JD, Kelly TN, et al. Global Disparities of Hypertension Prevalence and Control: A Systematic Analysis of Population-based Studies from 90 Countries.
      Circulation. 2016;134(6):441-450. doi:10.1161/CIRCULATIONAHA.115.018912
6.    Whelton PK, Carey RM, Aronow WS, et al. 2017 ACC/AHA/AAPA/ABC/ACPM/AGS/APhA/ASH/ASPC/NMA/PCNA Guideline for the Prevention, Detection, Evaluation, and
      Management of High Blood Pressure in Adults. Journal of the American College of Cardiology. 2018;71(19):e127-e248. doi:10.1016/j.jacc.2017.11.006
7.    Williams B, Mancia G, Spiering W, et al. 2018 ESC/ESH Guidelines for the management of arterial hypertension: The Task Force for the management of arterial hypertension
      of the European Society of Cardiology (ESC) and the European Society of Hypertension (ESH). European Heart Journal. 2018;39(33):3021-3104.
      doi:10.1093/eurheartj/ehy339
8.    Neter JE, Stam BE, Kok FJ, Grobbee DE, Geleijnse JM. Influence of weight reduction on blood pressure: a meta-analysis of randomized controlled trials. Hypertension.
      2003;42(5):878-884. doi:10.1161/01.HYP.0000094221.86888.AE
9.    Cutler JA, Follmann D, Allender PS. Randomized trials of sodium reduction: an overview. Am J Clin Nutr. 1997;65(2 Suppl):643S-651S. doi:10.1093/ajcn/65.2.643S
10.   Roerecke M, Kaczorowski J, Tobe SW, Gmel G, Hasan OSM, Rehm J. The effect of a reduction in alcohol consumption on blood pressure: a systematic review and meta-
      analysis. The Lancet Public Health. 2017;2(2):e108-e120. doi:10.1016/S2468-2667(17)30003-8
11.   Appel LJ, Moore TJ, Obarzanek E, et al. A Clinical Trial of the Effects of Dietary Patterns on Blood Pressure. New England Journal of Medicine. 1997;336(16):1117-1124.
      doi:10.1056/NEJM199704173361601
12.   Cornelissen Veronique A., Smart Neil A. Exercise Training for Blood Pressure: A Systematic Review and Meta‐analysis. Journal of the American Heart Association.
      2(1):e004473. doi:10.1161/JAHA.112.004473
Referenzen
13. Wu J, Kraja AT, Oberman A, et al. A summary of the effects of antihypertensive medications on measured blood pressure. Am J Hypertens. 2005;18(7):935-942.
doi:10.1016/j.amjhyper.2005.01.011
14. McDougall J, Thomas LE, McDougall C, et al. Effects of 7 days on an ad libitum low-fat vegan diet: the McDougall Program cohort. Nutrition Journal. 2014;13(1):99.
doi:10.1186/1475-2891-13-99
15. Goldhamer A, Lisle D, Parpia B, Anderson SV, Campbell TC. Medically supervised water-only fasting in the treatment of hypertension. J Manipulative Physiol Ther.
2001;24(5):335-339. doi:10.1067/mmt.2001.115263
16. Mach F, Baigent C, Catapano AL, et al. 2019 ESC/EAS Guidelines for the management of dyslipidaemias: lipid modification to reduce cardiovascular risk: The Task Force for
the management of dyslipidaemias of the European Society of Cardiology (ESC) and European Atherosclerosis Society (EAS). European Heart Journal. 2020;41(1):111-188.
doi:10.1093/eurheartj/ehz455
17. Gunness P, Gidley MJ. Mechanisms underlying the cholesterol-lowering properties of soluble dietary fibre polysaccharides. Food Funct. 2010;1(2):149-155.
doi:10.1039/C0FO00080A
18. Ramprasath VR, Jenkins DJ, Lamarche B, et al. Consumption of a dietary portfolio of cholesterol lowering foods improves blood lipids without affecting concentrations of fat
soluble compounds. Nutr J. 2014;13. doi:10.1186/1475-2891-13-101
19. Wang M, Yu M, Fang L, Hu R. Association between sugar‐sweetened beverages and type 2 diabetes: A meta‐analysis. J Diabetes Investig. 2014;6(3):360-366.
doi:10.1111/jdi.12309
20. 2. Pan A, Sun Q, Bernstein A et al. Red meat consumption and risk of type 2 diabetes: 3 cohorts of US adults and an updated meta-analysis. Am J Clin Nutr. 2011;94(4):1088-
1096. doi:10.3945/ajcn.111.018978
21. Tang WHW, Wang Z, Levison BS, et al. Intestinal Microbial Metabolism of Phosphatidylcholine and Cardiovascular Risk. N Engl J Med. 2013;368(17):1575-1584.
doi:10.1056/NEJMoa1109400
22. Koeth RA, Wang Z, Levison BS, et al. Intestinal microbiota metabolism of l-carnitine, a nutrient in red meat, promotes atherosclerosis. Nat Med. 2013;19(5):576-585.
doi:10.1038/nm.3145
23. Li XS, Obeid S, Klingenberg R, et al. Gut microbiota-dependent trimethylamine N-oxide in acute coronary syndromes: a prognostic marker for incident cardiovascular events
beyond traditional risk factors. European Heart Journal. 2017;38(11):814-824. doi:10.1093/eurheartj/ehw582Referenzen
24. Lauby-Secretan B, Scoccianti C, Loomis D, Grosse Y, Bianchini F, Straif K. Body Fatness and Cancer — Viewpoint of the IARC Working Group. https://doi-
org.ez.srv.meduniwien.ac.at/10.1056/NEJMsr1606602. doi:10.1056/NEJMsr1606602
25. Tahergorabi Z, Khazaei M, Moodi M, Chamani E. From obesity to cancer: a review on proposed mechanisms. Cell Biochemistry and Function. 2016;34(8):533-545.
doi:https://doi.org/10.1002/cbf.3229
26. Krebserkrankungen. Statistik Austria. Accessed February 25, 2021.
http://www.statistik.at/web_de/statistiken/menschen_und_gesellschaft/gesundheit/krebserkrankungen/index.html
27. Colorectal cancer. World Cancer Research Fund. Published April 24, 2018. Accessed March 4, 2021. https://www.wcrf.org/dietandcancer/colorectal-cancer
28. IARC. Red Meat and Processed Meat. Accessed March 4, 2021. https://publications.iarc.fr/Book-And-Report-Series/Iarc-Monographs-On-The-Identification-Of-Carcinogenic-
Hazards-To-Humans/Red-Meat-And-Processed-Meat-2018
29. Joint Expert Consultation on Protein and Amino Acid Requirements in Human Nutrition, Weltgesundheitsorganisation, FAO, United Nations University, eds. Protein and
Amino Acid Requirements in Human Nutrition: Report of a Joint WHO/FAO/UNU Expert Consultation ; [Geneva, 9 - 16 April 2002]. WHO; 2007.
30. Chapter 13. Iron. Accessed February 20, 2021. http://www.fao.org/3/Y2809E/y2809e0j.htm
31. Hunt JR. Moving toward a Plant-based Diet: Are Iron and Zinc at Risk? Nutrition Reviews. 2002;60(5):127-134. doi:10.1301/00296640260093788
32. Watanabe F, Bito T. Vitamin B12 sources and microbial interaction. Exp Biol Med (Maywood). 2018;243(2):148-158. doi:10.1177/1535370217746612
33. Langan RC, Goodbred AJ. Vitamin B12 Deficiency: Recognition and Management. AFP. 2017;96(6):384-389.
34. Del Bo’ C, Riso P, Gardana C, Brusamolino A, Battezzati A, Ciappellano S. Effect of two different sublingual dosages of vitamin B12 on cobalamin nutritional status in vegans
and vegetarians with a marginal deficiency: A randomized controlled trial. Clinical Nutrition. 2019;38(2):575-583. doi:10.1016/j.clnu.2018.02.008Sie können auch lesen