Dubai Real Estate Dubai - Market Overview Q2 2012 - VAE ...
←
→
Transkription von Seiteninhalten
Wenn Ihr Browser die Seite nicht korrekt rendert, bitte, lesen Sie den Inhalt der Seite unten

Dubai Real Estate
Dubai
                          Dubai

Market Overview Q2 2012
Market Highlights – Q2 2012
•   2012 wird gemäß der durch das Wirtschaftsministerium in Dubai nach oben         •   Der gesamte Wohnmarkt sieht einer positiven Tendenz entgegen, wobei der
     korrigierten Prognosen ein Wirtschaftswachstum zwischen 4% und 5%                  Haus- gegenüber dem Wohnungssektor im 2. Quartal weiterhin überwiegt.
     erwartet . Das BIP-Wachstum wird dabei durch die starken Sektoren Handel           Top-Wohngebäude in bestetablierten Wohnlagen verbessern weiterhin ihre
     und Tourismus gesteuert.                                                           Perfomance, während Standorte geringerer Qualität weiter unter Miet- und
                                                                                        Kaufpreisstürzen leiden.
•   Ein aktuelles Gutachten des Ministeriums für Wirtschaftsentwicklung zeigt die
    steigende Zuversicht der Investoren auf. Der Business Confidence Index (BCI)    •   Es besteht auch künftig eine starke Nachfrage nach Verkaufsflächen in den
    für Dubai erreichte 120.5 Punkte im März 2012.                                      leistungsstarken, zentral gelegenen Einkaufszentren (z.B. Dubai Mall, Mall of
                                                                                        the Emirates), was zu einem Anstieg der Mieten auf AED 5,400 / sq M führt.
•   Das steigende Kapitalanlegervertrauen steht im Zeichen einer fortwährenden          Der Markt für Gewerbeflächen entwickelt sich zunehmend zu einem Zwei-
    Nachfrage nach hochwertigen und gewinnbringenden Top-Anlageobjekten.                Klassen-Segment, in welchem ältere und weniger populäre Einkaufszentren
    Die Haupttransaktionen der ersten Jahreshälfte 2012 waren der Verkauf von           einer geschwächten Nachfrage durch Verbraucher und Einzelhändler entgegen
    Building 6 im Torviertel von DIFC sowie die Übertragung der 50-%-Anteile am         stehen, sodass die Eigentümern über neue Marketingmethoden und
    Atlantis auf Palm Jumeirah von Kerzner zu Istithmar World. Außerdem                 Produktpositionierungen nachdenken müssen.
    wurden im Juni etwa 11,400 sq ft Mix-Used –Flächen im Burj Khalifa verkauft.
                                                                                    •   Die in 2011 begonnene Wiederherstellung des Hotelsektors setzte sich im
•   Dort ist neuer Bürobedarf beschränkt worden, welcher den Markt im Laufe der         Laufe der ersten Jahreshälfte 2012 mit Belegungsniveaus fort, die sich mit
    ersten Hälfte des Jahres erklomm. Die verlangten Mieten für Prime-Office-           einem Anstieg auf 83 % gegenüber 79 % in derselben Periode im letzten Jahr
    Büroflächen blieben im zweiten Quartal 2012 konstant, während die                   verbesserten. Das Wachstum ist durch den starken Tourismus-Sektor und eine
    sekundären Mieten aufweichten.                                                      äußerst erfreuliche Anzahl an Gästen maßgeblich unterstützt worden. Die
    Die Verrößerung der Anzahl von Wohnungsinhabern bleibt ein Schlüsselfokus           Wiederbelebung des Hotelgewerbes in Dubai spiegelt sich sowohl in einem
    im Hinblick auf die globalen Tendenzen; die Optimierung der Portfolios in           Anstieg der durchschnittlichen Tagesraten (ADRs) als auch in den gestiegenen
    Dubai war während der ersten Jahreshälfte bemerkenswert. Die großen                 Einnahmen Pro Verfügbares Zimmer (RevPar) wider.
    Unternehmen zeigen angesichts flexibler Mietverträge ein fortwährend
    steigendes Interesse an der Vergößerung ihrer Gewerbeflächen.

                                                                                                                                                                        2
Talking Points – Q2 2012
• Gemäß Jones Lang LaSalle’s Global Real Estate Transparency Index 2012                •     Das Dubai International Financial Centre (DIFC) hat ein Zweijahres-
    hat Dubai seinen Status als größttransparentem Immobilienmarkt der MENA-                 Entwicklungsprogramm zur Förderung von Wachstum und Entwicklung des
    Regionen aufrechterhalten. Auf globaler Ebene reiht sich Dubai dabei                     Finanzdienstleistungssektors dargelegt. Es beabsichtigt u.a., den Beitrag des
    allerdings nur auf Rang 47 unter den 97 bedeckten Märkten ein.                           Zentrums zum BIP-Wachstum Dubais zu vergrößern und bringt damit den
                                                                                             Einklang mit anderen globalen Finanzplätzen.
•   Dubai gab jüngst seine Offerte zur Ausrichtung der World Expo 2020 bekannt
    unter dem Motto "Connecting Minds, Creating future" ("Gedanken verbinden,          •     Der Princess Tower von Tameer ist in das Guinness Buch der Rekorde als das
    Zukunft gestalten").                                                                     höchste Wohngebäude der Welt eingetragen worden. Der Turm in der Dubai
    Sollte Dubai den Zuschlag erhalten, wäre dies die erste Weltausstellung im               Marina ist 414 Meter hoch und umfasst 107 Geschosse. Seine Fertigstellung
    gesamten Raum des Mittleren Ostens, Nordafrika und Südasien. Dubais                      wird für Ende 2012 erwartet.
    Mitbewerber sind Sao Paulo (Brasilien), Ayutthaya (Thailand), Izmir (Türkei)       •     Dubai ist im Weltranking der beliebtesten Reiseziele auf Platz auf Platz 8
    und Ekaterinburg (Russland). Die Gewinner-Stadt wird im November 2013                    aufgestiegen und überrundete damit Städte wie New York, Barcelona und Rom
    bekanntgegeben.                                                                          gemäß dem Weltindex von MasterCard, dem "MasterCard’s Worldwide Index
•   In Kürze wird ein neues Gesetz vom Dubai Land Department verabschiedet                   of Global Destination Cities". Der Index sagt voraus, dass die Gäste in Dubai
    werden, welches den Schutz der Investoren vor Verzögerunerungen und                      im Jahr 2012 etwa 19 % mehr Geld und damit ein Volumen von 8.8 Milliarden
    einseitig benachteiligenden Änderungen zum Ziel hat. Laut dem letzten                    US-Dollar ausgeben werden. Die Besucherzahlen werden dabei
    Entwurf dieses Gesetzes können Kapitalanleger ihre Verträge künftig                      voraussichtlich um 15 % im Vergleich zum Vorjahr steigen.
    annullieren und ihr Geld zurückbekommen, wenn Projektentwickler die
    Geschäftsvereinbarungen verletzen. Das neue Gesetz wird die                            • Es wird erwartet, dass der Dubai International Airport den Flughafen Heathrow
    Projektentwickler erneut unter Druck setzen, ihre Projekte zügig fertigzustellen           überholen und damit bis 2020 der drittgrößte internationale Flughafen wird
    und damit das Vertrauen der Kapitalanleger fördern. So wird künftig eine                   mit einem Abfertigungsvolumen von 100 mio. Passagieren im Jahr. Das
    höhere Transparenz sowie eine bessere Regulierung des Immobilienmarktes                    Emirat investiert anteilig rund 7.8 mrd. USD in die Erweiterungspläne.
    sichergestellt werden.
•   Die “Dubai      Green     Economy      Partnership”, ein öffentlich-privates
    Partnerprogramm, wurde im Mai 2012 gestartet. Eine Reihe von Initiativen
    wurden vorgeschlagen, um die Rolle Dubais als eine "grüne Wirtschaft" sowie
    seine nachhaltige Entwicklung zu stärken.

                                                                                                                                                                             3
Dubai Prime Rental Clock Q2 2011 – Q2 2012
                              Q2 2011                                                                                             Q2 2012

          Rental Growth                      Rents                                                              Rental Growth                      Rents
            Slowing                          Falling                                                              Slowing                          Falling

          Rental Growth                     Rents                                                               Rental Growth                     Rents
           Accelerating                 Bottoming Out                                                            Accelerating                 Bottoming Out
                                                                Office
                                                                                                       Hotel*

                                                                                                           Residential                                          Office
                                                   Residential
                       Hotel* Retail                                                                                        Retail

*Hotel clock reflects the movement of RevPAR.

Note: The property clock illustrates where Jones Lang LaSalle estimate each prime market is within its individual rental cycle as at end of relevant quarter.
Source: Jones Lang LaSalle

                                                                                                                                                                         4
Dubai Office
Market Overview

Office Supply
• The total city-wide office stock stood at approximately 6.1 million sq m at the           • An additional 640,000 sq m of office supply will enter the market
           end of Q2 2012. Only 58,000 sq m was delivered in the second quarter of            in the second half of 2012 if all the projects are delivered without
           2012. The major completions during the quarter were the Platinum Towers in         delays. This still represents the lowest level of completions since
           Jumeirah Lakes Towers (JLT) and The Annex, an office building annexed to
           Burj Khalifa in Downtown.                                                          2007. In reality, not all the proposed space will complete in 2012,
                                                                                              with some projects being delayed into 2013 and beyond. In
•         Single     ownership       buildings     account      for     the      majority     addition to this supply, there is a further 2.2 million sq m which
          (approximately 60%) of the existing office stock while the remaining projects
          fall under strata ownership (approximately                                          has been placed on hold.
          40%). The majority of office supply remains concentrated in onshore locations     • The majority of new office supply for the second half of 2012 will
          (53%), compared with a lower proportion of the existing stock located in
          free zones (47%) and available to companies operating with offshore licenses.       be located in Business Bay. Going forward, in 2013, more office
                                                                                              space is expected to be delivered in Business Bay, in addition to
                                  Dubai Office Supply (2009 - 2013)                           a logistics and office park in Dubai World Central.

                                                                                                      Breakdown of Expected Completions in 2012 by
                                                                                                                      Sub Market
                                  8.0                                             0.73                        8%                            Business Bay
                                  7.0                                      0.64                          4%                                 DIFC
     Total Stock (million sq m)

                                                                                                    5%
                                  6.0                                                                                                       Silicon Oasis
                                  5.0                                                            5%
                                                                                                                                            JLT
                                  4.0                                                                                              45%
                                                                           6.1    6.8          7%                                           Tecom C
                                  3.0                            6.0
                                                      5.1                                                                                   Meydan Metropolis
                                  2.0     3.9
                                  1.0                                                            7%                                         Dubai Investment Park
                                   -                                                                                                        Al Barsha
                                         2009        2010       2011       2012   2013                   9%                                 Others
                                                Completed Stock   Future Supply                                   10%
    Source: Jones Lang LaSalle, Q2 2012                                                      Source: Jones Lang LaSalle, Q2 2012

                                                                                                                                                                     6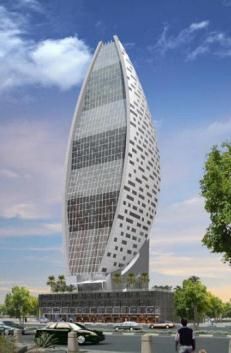
Expected Major Office Completions in 2012

                                                  CBD

                                                              DIFC Central
                                                                 Park,
                                                               Rosewood

                                       Business Bay
                                       51@Business
                                        Bay, Iris Bay

                                                                              Silicon
                                                                               Oasis
                                                                             S.I.T tower

                                                           DWC
                                                        Logistics City
              JLT
            The Dome

                                                                                           7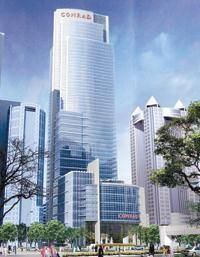
Rental Performance
• Average asking rents for prime office buildings have remained unchanged
    over the past year. Prime rents* in the DIFC stabilised at AED 2,370                                                Dubai Prime Office Rents (Q4 2009 – Q2 2012)
    per sq m, while prime rents elsewhere in the CBD (excluding DIFC) remained
    flat at AED 1,615 per sq m in the second quarter of 2012. Prime quality                              5,000
    buildings in areas such as TECOM, SZR and Burj Downtown continue to                                  4,500
    be popular locations for corporates and are witnessing stabilising rents, but                        4,000
    poorer quality space and buildings in secondary locations continue to see                            3,500
    rental decline.

                                                                                      AED / sq m / p a
                                                                                                         3,000
•   With limited supply entering the market, vacancy rates within the CBD                                2,500
    remained stable at around 35%. While well-established buildings in DIFC such
                                                                                                         2,000
    as The Gate enjoy high occupancy rates, other areas still suffer high vacancy
    rates, and this trend is not                                                                         1,500
    expected to change soon, especially with the approach of the                                         1,000
                                                                                                           500
                                                                                                             0
                                                                                                                  Q4 Q1 Q2 Q3 Q4 Q1 Q2 Q3 Q4 Q1 Q2
    quieter summer months. Business Bay for example, has a
                                                                                                                 2009 2010 2010 2010 2010 2011 2011 2011 2011 2012 2012
    vacancy rate of around 80% due to limited demand and a substantial
    pipeline supply of new projects.                                                                                        Prime CBD Rent (excl. DIFC)
•   Although prime buildings are witnessing stable rental levels, secondary                                                 Prime Citywide Rent (excl. DIFC)
    locations are expected to see further rental decline in the second half of 2012                                         DIFC
    due to the large new supply and weak tenant demand that is further
    exacerbating the supply-demand imbalance and the two tier nature of the                              Source: Jones Lang LaSalle, Q2 2012
    Dubai office market.

                                                                                                  * Prime Office Rent represents the top open-market rent that could be expected
                                                                                                  for a notional office unit of the highest quality and specification in the best
                                                                                                  location in a market, as at the survey date Data relates to effective rents that are
                                                                                                  exclusive of service charges.

                                                                                                                                                                                         8
Office Market Summary
Indicator Level Comment / Outlook
Includes all grades. Limited supply (less than 1 million sq m) of
Current Office Stock 6.1 million sq m
single ownership space in the CBD.
Assuming that all pipeline supply tracked by Jones Lang LaSalle
Future Supply (2012 – 2013) 1.4 million sq m quarterly survey will complete. In reality, some of the proposed
projects may be delayed beyond 2013.
CBD vacancy levels were stable in Q2-2012. Some areas outside
CBD Single Ownership Vacancy 35% the CBD continue to experience much higher vacancies.
Prime CBD Rental (excl. DIFC) AED 1,600 / sq m Rental levels stabilised in Q2 2012 as the new supply is limited
Prime Citywide Rental AED 1,300 / sq m and occupier demand remains subdued.
Prices have remained stable in Q2 2012 as the market did not
witness any significant transactions and investors’ sentiment
Average Sale Price AED 9,600 / sq m
remained unchanged. New supply is likely to push pricing down in
2013.
9Dubai Residential
Residential
Market OverviewResidential Supply
• Im zweiten Quartal 2012 wurden etwa 3,000 zusätzliche Wohneinheiten auf • Nach Angaben der Projektentwickler stehen derzeit insgesamt 24,000
den Markt gebracht, was die aktuelle Verfügbarkeit an Wohnungen auf zusätzliche Einheiten zur Auslieferung in der zweiten Jahreshälfte 2012 auf
ungefähr 344,000 Einheiten bringt. Die Mehrheit der Fertigstellungen waren dem Plan. Die hauptsächlichen Wohnlagen, in welchen in den nächsten sechs
Appartmentwohnungen. Namhafte Wohnungsprojekte wurden übergeben, Monaten weitere Fertigstellungen erwartet werden, sind Al Furjan (4,000
darunter Phase 3 von "The Villa" in Dubailand, zwei Türme in der Dubai Einheiten), Jumeirah Village (etwa 3,400 Einheiten), Dubai Marina (2,300
Marina, drei Gebäude in Dubai Silicon Oasis sowie einem Komplex von 26 Einheiten), Dubai Sports City (2,200 Einheiten) und Dubai Silicon Oasis (1,800
Gebäuden in International City. Einheiten). Eine verzögerte Auslieferung geplanter Projekte ist in Einzelfällen
möglich.
• International City hält den größten Anteil (16 %) der seit 2009 vollendeten
Wohnungsangebote. Dubai Marina, Discovery Gardens und JLT sind weitere • Die Auslieferung weiterer Wohneinheiten sind in Dubai Sports City und
Teilmärkte, die ein steigendes Wohnungsangebot vorweisen können. Jumeirah Village für 2013 und 2014 geplant.
Übersicht über die in 2012 erwarteten Fertigstellungen in den Teilmärkten
Dubai Residential Supply (2010 - 2014)
17%
27% Jumeirah Village
450
14 3 Dubai Marina
400 24
Number of Units (in 000's)
350 Dubai Sports City
300 DSO
12%
250
Dubailand
200 368 381
324 338 344 Al Barsha
150 4%
100 Palm Jumeirah
50 5% 11% Al Furjan
-
Others
2010 2011 2012 2013 2014 7%
Completed Stock Future Supply 9%
8%
Source: Jones Lang LaSalle, Q2 2012 Source: Jones Lang LaSalle, Q2 2012
11Expected Major Residential Completions in 2012
Silicon Oasis
1,800 units
Dubai Marina
2,300 units
Dubailand
Jumeirah Village 1,660 units
3,400 units
Dubai Sports City
2,200 units
12Residential Performance
• Die REIDIN Verkaufs-Indizes zeigen, dass der Wohnungsmarkt insgesamt seit Dubai Residential Property Sale Indices
500
Anfang 2012 mit steigenden Preisen sowohl für Häuser als auch für
Appartments aus der Talsohle herausgetreten ist. 400
January 2003 = 100
• Der Häusermarkt erfuhr gegen Ende 2011 einen Aufwärtstrend, der sich ins 300
Jahr 2012 fortsetzen konnte. Im Mai 2012 stiegen die Indizes für
Hausverkäufe um 21% im Vorjahresvergleich und liegen damit jetzt um 9% 200
höher als im Frühjahr 2008. Die Indizes für Appartmentwohnungen sind stabil
geblieben (ca. 1% Steigerung im Vorjahresvergleich), liegen jedoch weiterhin 100
um ca. 18% niedriger verglichen mit Januar 2008.
0
May 2008
May 2009
May 2010
May 2011
May 2012
• Die REIDIN Miet-Indizes zeigen praktisch keine Änderungen seit Anfang 2012,
Jan 2008
Sep 2008
Jan 2009
Sep 2009
Jan 2010
Sep 2010
Jan 2011
Sep 2011
Jan 2012
sowohl für Villen als auch für Wohnungen. Die Mieten für beide Segmente
haben um ungefähr 10 % im Vorjahresvergleich zugenommen. Während die
Häusermieten um 5 % im Vergleich zu den Niveaus von Januar 2009
gestiegen und damitannähernd zurück auf ihren Maximalniveaus angekommen Residential General Residential Apartment Residential Villa
sind, liegen Wohnungen hinsichtlich des Niveaus von Januar 2009 um 30 %
niedriger
Dubai Residential Property Rent Indices
• Wie erwartet übersteigt der Häusermarkt weiterhin den Sektor für Wohnungen, 120
und während die Top-Wohnanlagen an den etablierten Standorten einer 100
January 2009 = 100
fortlaufend besseren Leistungsperformance entgegen sehen, leiden die
zweitklassigen Standorte weiterhin unter den Rückgängen bei Mieten und 80
Kaufpreisen. 60
40
20
0
May 2009
May 2010
May 2011
May 2012
Jan 2009
Sep 2009
Jan 2010
Sep 2010
Jan 2011
Sep 2011
Jan 2012
Anmerkung: REIDIN.com RPPIs verarbeiten monatliche Daten aktueller
Angebot- und Nachfragelisten sowie Preisdaten des Grundbuchamtes
(Transaktionsdaten). Die Verkaufs- und Mietpreisindizes werden monatlich
berechnet und decken 7 stadtweite Projekte, 8 Projekte in den Hauptbezirken Residential General Residential Apartment Residential Villa
und 4 Stadtteilprojekte ab.
Source: REIDIN, Q2 2012
13Residential Market Summary
Indicator Level Comment/Outlook
Der Wohnungsbestand in Dubai wurde in Q2 2012 um etwa 3,000
Aktueller Wohnungsbestand 344,000 Wohneinheiten erweitert.
Es ist davon auszugehen, dass die von JLL vierteljährlich
Künftige Bereitstellung (2012 – 2014) 41,000 prognostizierten Auslieferungen vollendet werden. Dennoch können
vereinzelt Verzögerungen bei den geplanten Auslieferungsterminen
entstehen.
Die ausgewiesenen Mieten sind um 9% Y-o-Y gestiegen und es
Appartmentmieten werden weitere Mietpreissteigerungen in den kommenden Monaten des
Jahres 2012 erwartet.
Die Verkaufspreise für Appartments in den Top-Gebäuden der
Appartment Verkaufspreise etablierten Wohnlagen bleiben stabil (Y-o-Year).
Die Häusermieten in den Top-Wohnlagen sind im Jahresvergleich um
10% gestiegen, Trend weiter steigend. Die Mieten in den weniger
Häusermieten etablierten Wohnlagen werden den Erwartungen zufolge stabil bleiben.
Die Preise für Häuser stiegen um 21% im Jahrevergleich, und es wird
Häuser Verkaufspreise erwartet, dass sich dieser Aufwärtstrend während der verbleibenden
Monate des Jahres 2012 an den gut etablierten Standorten fortsetzen
wird.
Anmerkung: Die Richtungsweiser basieren auf den Entwicklungen des monatlichen REIDIN Index.
14Dubai Retail Market Overview
Retail Mall Supply
• The only major retail completion in the first half of 2012 was the               • With the construction of Mall of Arabia currently on hold, the next
  Madina Mall in Muhaisanah 4, with Carrefour as a main anchor                       significant retail completion in Dubai is likely to be the 158,000
  tenant. In the second half of the year, around 16,000 sq m is                      sq m extension to Dragon Mart in International City which is due
  scheduled to be delivered with the Phase 1 of Meraas The                           to be delivered to the market in 2014. The Dubai Pearl Shopping
  Avenue retail project.                                                             Mall is due to complete in 2015.
• There have been a number of new retail announcements made                        • Dubai’s retail market remains dominated by large Super
  during last quarter. Meraas announced two projects, the second                     Regional Centres. These currently account for 64% of mall
  phase of The Avenue in Satwa and a smaller development in                          based retail space however this percentage is likely to decline in
  Dubai Marina. Nakheel revealed The Pointe on Palm Jumeirah                         the coming years as the retail market sees increased emphasis
  while other retail projects have been announced as part of Dubai                   on smaller Community Centres.
  Sports City.

                                                                                                        Breakdown of GLA by Type of Mall
                                     Dubai Retail Supply (2010 – 2014)
                     3,100                                                                                         1% 6 %
                                                                                                                                         Convenience
                     3,000                                                                                                    9%
                                                                           158                                                           Neighbourhood
 GLA ( '000s sq m)

                     2,900                            16
                     2,800                                                                                                               Community

                     2,700                                                                                                               Regional
                                          2,809     2,846       2,862      2,862
                     2,600                                                                                                               Super Regional
                     2,500   2,616                                                                                                 20%
                                                                                             64%
                     2,400
                             2010         2011       2012        2013      2014
                                        Completed     Under Construction
Source: Jones Lang LaSalle, Q2 2012                                                  Source: Jones Lang LaSalle, Q2 2012

                                                                                                                                                           16
Rental Performance – Estimated Rental Value (ERV)
• The top open market net rent for a notional standard shop in AED / sq m Q2 2012
prime super regional centres has continued to move upwards in Super Regional 4,850 - 5,900
Q2 2012. Demand for premium retail space in the large malls Regional 2,150 - 3,200
has been buoyed by the entrance of a number of UK retailers in Community 1,200 - 1,600
the market. Secondary rents remain stable resulting in an Neighbourhood 1,350 - 1,600
increasing differential between prime and secondary product. Convenience 850 - 1,200
• Although there has been no recent data released on total retail Boutique 1,850 , 2,350
spend, airport arrival numbers and high hotel occupancy rates
suggest the retail sector is performing well and will continue to do Dubai Retail Rents (Q1 2009 – Q2 2012)
so. 7,000
• Deira City Centre and Mall of the Emirates are almost 100% 6,000
leased and continue to outperform the industry in sales densities 5,000
and occupancy. The Dubai Mall is seeing an increase in its
AED sq m
4,000
occupancy rates with more retailers looking to be based in one of
the biggest shopping centres in the world, which attracted 54 3,000
million visitors in 2011. 2,000
1,000
• However, like other sectors, the retail market is becoming more
two-tier and older, less popular malls are seeing weakened -
Q1 2009
Q2 2009
Q4 2009
Q1 2010
Q2 2010
Q3 2010
Q4 2010
Q1 2011
Q2 2011
Q3 2011
Q4 2011
Q1 2012
Q3 2009
Q2 2012
demand from consumers as retailers compete for a presence in
the best quality centres. Increasingly, mall owners are needing to
consider new marketing techniques and product positioning.
Prime Secondary
Note: Chart shows mid-point ERV for an in-line store in Prime and Secondary
Super Regional shopping malls. The rent quoted reflects a notional “standard”
line store unit of 100 sq m.
Source: Jones Lang LaSalle, Q2 2012
17Retail Sector Summary
Indicator Level Comment / Outlook
Current Retail Space (GLA) 2,846,000 sq m Limited additions to mall based retail space in Q2 2012.
The next significant retail completion in Dubai is likely to be the
Future Supply (2012 – 2014) 271,000 sq m 158,000 sq m extension to Dragon Mart which is due to be
delivered to the market in 2014.
Prime Retail Rents AED 5,400 / sq m Prime units in better performing centres are likely to see some
rental growth in 2012 but this will be offset by declining rental
Secondary Retail Rents AED 2,700/ sq m levels in poorer performing centres.
Citywide retail vacancy remains relatively high despite strong
Average Regional Mall Vacancy 20%
occupancy levels in regional and super regional centres.
18Dubai Hotel
Hotel
Market OverviewHotel Supply
• The second quarter of 2012 saw the opening of one major
internationally branded hotel – Melia in Bur Dubai, which
marked the entrance of a new operator in the Dubai hospitality
market.
Dubai Hotel Supply (2012 – 2014)
• The first half of 2012 has witnessed an addition of about 850 65,000 3,000
branded hotel rooms in the city. The bulk of the major 3,500
60,000
openings are scheduled in the second half of the year, mostly
4,500
leaning towards the end of the year after Ramadan. 55,000
No. of Rooms
50,000
• Approximately 4,500 additional guest rooms are expected to 62,250
45,000 58,750
be completed in 2012 with major projects including JW Marriott 54,250
53,400
Marquis (Business Bay), Al Khor Rayhaan (Al Ghurair City), 40,000
Fairmont The Palm and Conrad Sheikh Zayed Road. 35,000
30,000
• The positive upswing in tourism volumes in Dubai has raised
2011 2012F 2013F 2014F
confidence levels and following a slowdown witnessed in the
last couple of years, there has been an increase in the number Current Supply Future Additions
of announced projects in the city including the Four Seasons
Dubai, three hotels (St. Regis, Westin and W) at the Source: Jones Lang LaSalle Hotels, Q2 2012
Metropolitan site and some midscale properties in the Bur
Dubai / Deira area.
• Additionally, several major established hotels are undertaking
renovation programs to refresh their products in order to match
the new supply and cater to increased demand (e.g. Pullman
Deira City Centre Hotel).
20Expected Major Hotels Completions in 2012
Al Khor Rayhaan Hotel
428 Rooms
Conrad
Jumeirah Creekside
559 Rooms
Hotel
292 Rooms
JW Marriott Marquis
Fairmont Hotel 1608 Rooms
381 Rooms
Movenpick Hotel, JLT
475 RoomsTrading Performance
• The first five months of 2012 have upheld the recovery trend in Dubai Hotel Performance (YT May 2009 – 2012)
the Dubai market. The city received around 2.6 million tourists
in the first quarter of 2012.
300 88%
• Occupancy rates as at YT May 2012 have increased by 4% 83%
250 84%
points over the same period in 2011, reaching 83% on city-
wide basis. 79%
200 80%
Occupancy
ADR (USD)
76%
• After a period of two years, average rates showed an increase 150 76%
73%
of about 7% during the first five months of 2012 as compared
100 72%
to the same period in 2011. The beach hotels have witnessed
an improvement exceeding 10% in ADR levels in January – 50 68%
May 2012.
0 64%
2009 YTD 2010 YTD 2011 YTD 2012 YTD
• As a result of higher occupancies and ADRs, RevPAR levels
ADR Occupancy
showed an impressive 13% growth, reaching USD 212 in YT
May 2012 over the same period in 2011. Source: STR Global
22Hotel Market Summary
Indicator Level Comment / Outlook
About 850 rooms were added in the first half 2012, including one major
Current Hotel Supply 54,300 rooms
opening in Q2 with Melia Dubai.
Bulk of the major openings in 2012 are scheduled for the second half of
Future Supply (2012 - 2014) 11,000 units the year, post Ramadan. The city has a significant committed supply
pipeline over the next two – three years.
Increase in YTD levels of occupancy with improvement witnessed
2012 YTD Occupancy 83%
across all sub-markets.
As a result of higher occupancies and ADRs, RevPAR levels have
2012 YTD ADR USD 254
witnessed a double digit increase by 13% on a city-wide average basis.
23Definitions and Methodology
Residential: Office:
• The supply data is based on our quarterly survey of 37 sub markets, • The supply data is based on our quarterly survey of 30 sub markets,
starting from 2009. starting from 2009.
• Completed building refers to a building that is handed over for immediate • Completed building refers to a building that is handed over for immediate
occupation. occupation.
• Residential performance data is based on the REIDIN monthly index. • Central Business District includes DIFC, DTCD, Sheikh Zayed Road, Burj
REIDIN.com Dubai Residential Property Price Indices (RPPIs) use monthly Khalifa Downtown. Free Zone areas include Jumeirah Lake Towers, DIFC,
sample of offered/asked listing price data and land registry price data Tecom, Dubai Silicon Oasis, DWC, Dubai Outsource Zone and IMPZ.
(transaction data). Index series are set at 100 starting at the beginning of
each data set. • Prime Office Rent represents the top open-market rent that could be
expected for a notional office unit of the highest quality and specification in
the best location in a market, as at the survey date (normally at the end of
Retail:
each quarter period). The rent quoted normally reflects prime units of over
500 sq m of lettable floorspace, which excludes rents that represent a
• Classification of Retail Centres is based upon the ULI definition as
premium level paid for a small quantity of space. The Prime Rent reflects
published in Retail Development, 4th Edition published by ULI.
an occupational lease that is standard for the local market. It is a face rent
that does not reflect the financial impact of tenant incentives, and excludes
• Prime Rent Shopping Centre represents the top open market net rent that
service charges and local taxes.
could be expected for a notional standard in line unit shop situated in a
specified shopping centre - preferred in a inner city location -, as at the
survey date (normally at the end of each quarter period). The rent quoted Hotels:
reflects a notional “standard” unit of 100 sq m.
• Hotel room supply is based on existing supply figures provided by DTCM
as well as future hotel development data tracked by Jones Lang LaSalle
Hotels. Room supply includes all graded supply and excludes serviced
apartments.
• STR performance data is based on monthly survey conducted by STR
Global on a sample of more than 32,000 rooms across Dubai.
24Contacts: Robin Pugh David Macadam Chiheb Ben Mahmoud Craig Plumb Cynthia Nasseh Head of Agency Head of Retail Executive Vice President Head of Research Senior Research Analyst Middle East & North Africa Middle East & North Africa Jones Lang LaSalle Hotels Middle East & North Africa Middle East & North Africa robin.pugh@jll.com david.macadam@jll.com chiheb.ben-mahmoud@jll.com craig.plumb@jll.com cynthia.nasseh@jll.com Follow us on: www.joneslanglasalle-mena.com COPYRIGHT © JONES LANG LASALLE IP, INC. 2012 This publication is the sole property of Jones Lang LaSalle IP, Inc. and must not be copied, reproduced or transmitted in any form or by any means, either in whole or in part, without the prior written consent of Jones Lang LaSalle IP, Inc. The information contained in this publication has been obtained from sources generally regarded to be reliable. However, no representation is made, or warranty given, in respect of the accuracy of this information. We would like to be informed of any inaccuracies so that we may correct them. Jones Lang LaSalle does not accept any liability in negligence or otherwise for any loss or damage suffered by any party resulting from reliance on this publication.
Sie können auch lesen