Journalismus vs. Kunst - Wie viel Kreativität verträgt die Grafik? MAZ, Luzern 17. September 2014
←
→
Transkription von Seiteninhalten
Wenn Ihr Browser die Seite nicht korrekt rendert, bitte, lesen Sie den Inhalt der Seite unten
Journalismus vs. Kunst –
Wie viel Kreativität verträgt die Grafik?
–
MAZ, Luzern
17. September 2014

Von B und C
Hahn und Zimmermann   T +41 (0)31 331 28 70   Kommunikationsdesign
Rathausplatz 3        mail@von-b-und-c.net    Informationsgrafik
CH-3011 Bern          www.von-b-und-c.net     Designforschung
2004           2005                    2007

       2008                  2009

        2010

                                    2011

                      2012

               2013

                                              © Hahn und Zimmermann, 2014
       2014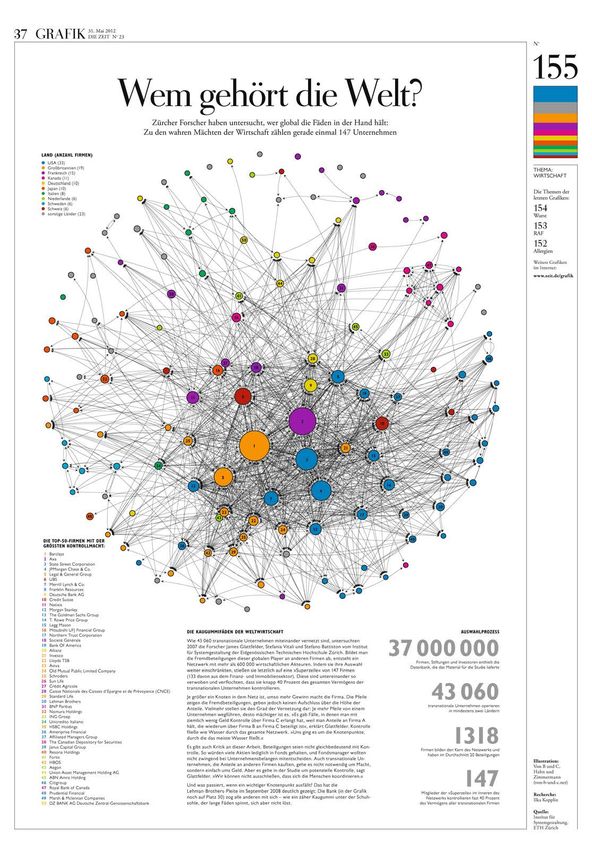
1
–
Die Ästhetik grosser Datenmengen
24/7 The Alibi
New York Times Magazine (2007)

                                 © Hahn und Zimmermann, 2014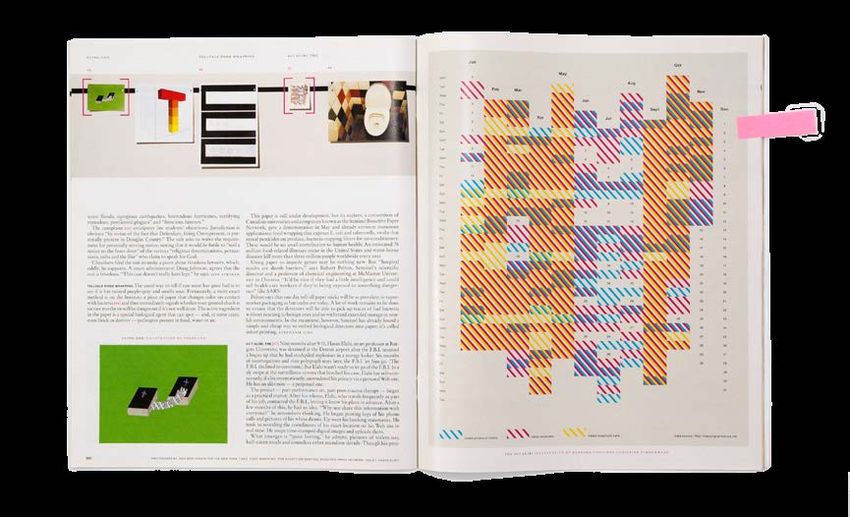
Jan Oct
May
Mon 1
Aug
dated photos of toilets Tue
Feb Mar Nov
Wed
Jun
Thu 4
Sept Dec
Fri 5
Apr Jul
Sat 6 1
Sun 7 2
dated expenses Mon 3
Tue 9 5 4
Wed 6 8 5
Thu 11 5 9 6
Fri 12 6 7
Sat 8
dated telephone calls Sun 9
Mon 9 13 10
Tue 12 10 14 11
Wed 14 13 11 15 12
Thu 15 13
Fri 16 14
Sat 17 15
Sun 18 18 16
Mon 16 19 17
Tue 20 18
Wed 18 22 21 19
Thu 22 20
Fri 22 24 23 21
Sat 24 22
Sun 28 25 23
Mon 27 26 24
Tue 26 24 27 25
Wed 28 26
Thu 26 29 27
Fri 30 28
Sat 29
Sun 30
Mon 31
Tue
© Hahn und Zimmermann, 2014
dated photos of toilets dated expenses dated telephone calls Data source: http://trackingtransience.net
2
–
Informationen sichtbar machen

                                © Hahn und Zimmermann, 2014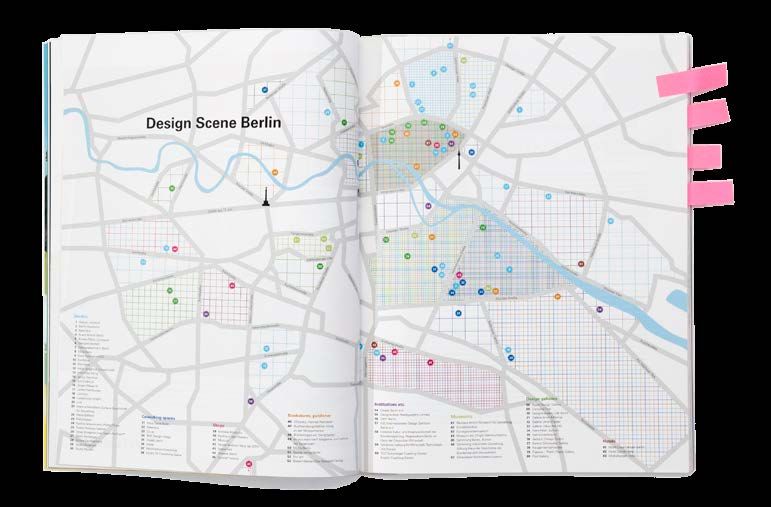
Kulturwirtschaft Berlin
Form – Zeitschrift für Design (2010)

                                       © Hahn und Zimmermann, 2014
11
Schönhauser
66
Da
nzi
12 ge
rS
tra
Ch
8 ße
a us
Allee
se
es
46 2
tra
24
ße
ße
ee
tra
He
r All
e
37 S 20
ra ß
er
ide
rg
laue
St
lbe
str
r
er
Pe
22
z
ald
aß
Pren
e
sw
27 1
eif
Gr
29
68
71 t raße 75
ße Tors 79
en stra
alid 78
49
Inv 6 52
5 80
Kaiserin-Augusta-Allee
7 81 54
Alt-M 39
oabit
4
14 36
65
57
47
48
e
aß
str
Alt
aße
17
rch
on
ae den
Unter den Lin
Ma
str
70 rS Karl-Mar
tra x-Allee
uer
ße 21
Ca
58
e
Friedrichstraß
17. Juni
Straße des
Ho 30
aße
Bismarckstr lzm
73 ark
raße tst
Le ipziger St raß
Tiergartenstraße 67 e
e
51
traß
61 63 72
er S
au
e
62
traß
rsch
16 44
e-S
Kantstraße 76 28
Wa
Ufer
Schöneberger
ein
h-H
23 69 26 83
Mü
inric
hle
e
31 9
traß
ns
He
Kle tra
ist 25 42 ße
er S
str
Ha
aß
amm e
lle
dam
tend
sc
rs 32
Kurfü Kur
he
fü 3
s
sU
40 rste
Pot
64 Str
Bundesallee
nst ala
fe
raß 33 53 uer
e
r
74 34
Alle
e
Martin-Luther-Straße
50
Skalitzer Straße
77
56
35
60
Studios
Kott
ufenstraße
1 Alessio Leonardi Hohensta
b
uss
2 Berlin Haushoch amm
er D
3 Beta Tank llernd Yorc
kstra
nzo ße Gne
amm
4 Buero Botsch Berlin he isen Pu
Ho 82 austr sch
5 Bureau Mario Lombardo 13 aße kin
15 alle
6 Designerdeutsch 18 e
e 43
aldstraß 10
7 Edenspiekermann Berlin Grunew
Ett la Benn 55 38
Mehringdamm
8
9 Fons Hickmann m23 41
Am
19
Tr
10 FontShop
ep
to
11 Formfjord
w
er
12 Hella Jongerius / Jongeriuslab
Pa
13 Hort / Eike König
r k
ße Dudenstraße
14 Jerszy Seymour ra
st
15 Juli Gudehus u pt
Ha
16 Jürgen Mayer H.
© Hahn und Zimmermann, 2014
17 Lambl / Homburger
18 Llot Llov 59 Design galleries
19 LucasFonts GmbH
Institutions etc. 68 Appel Design Gallery
20 Lulu 54 Create Berlin e.V. 69 Clemens Tissi
21 Markus Weissbeck Surface Gesellschaft Bookstores, publisher 55 Designerdock Headquarters Limited 70 Designtransfer / UdK Berlin
für Gestaltung 46 25 books, Hannes Wanderer 56 DMY Berlin Museums 71 Galerie Arndt & Partner
Coworking spaces So
22 Meiré & Meiré 47 Buchhandlung Walther König 57 IDZ / Internationales Design Zentrum 61 Bauhaus-Archiv / Museum für Gestaltung 72 Galerie Ulrich Fiedler nn
Shops en
23 MetaDesign 31 Aqua Carrè Berlin an der Museumsinsel Berlin e.V. 62 Kunstbibliothek 73 Galerie Urban Art Info all
ee
24 Nadine Schemmann / Plastic Pirate 32 Betahaus 39 Andreas Murkudis 48 Bücherbogen am Savignyplatz 58 Initiative Kultur- und Kreativwirtschaft der 63 Kunstgewerbemuseum 74 Hans-Peter Jochum
25 Noshe Andreas Gehrke 33 Co.up 40 Kaufhaus des Westens 49 do you read me?! Magazine und Lektüre Bundesregierung, Regionalbüro Berlin im 64 Museum der Dinge / Werkbundarchiv 75 Helmrinderknecht
26 Oliver Wiegener / Ice Cream For Free™ 34 ÏMA Design Village 41 Modulor der Gegenwart Haus der Deutschen Wirtschaft 65 Sammlung Boros, Bunker 76 Jackson Design GmbH
27 Sarah Illenberger 35 Impakt berlin 42 Neues Modulor Haus (ab 2011) 50 Motto Berlin 59 Senatsverwaltung für Wirtschaft, Technologie 66 Sammlung industrielle Gestaltung, 77 Karena Schuessler Gallery Hotels
28 Sonice Development 36 Made 43 Space Hall 51 Nicolai Verlag Berlin und Frauen Stiftung Haus der Geschichte der 78 Neugerriemschneider. 81 Hotel Casa Camper Berlin
29 Studio Aisslinger 37 Raumstation Coworking 44 Stilwerk Berlin 52 Pro qm 60 TCC Technologie Coaching Center, Bundesrepublik Deutschland 79 Pigasus – Polish Poster Gallery 82 Hotel Sarotti-Höfe
30 Studio Hausen 38 Studio 70 Coworking Space 45 twinkle*twinkle 53 Robert Klanten / Die Gestalten Verlag Kreativ Coaching Center 67 Schaudepot Buchstabenmuseum 80 Pool Gallery 83 Michelberger Hotel
45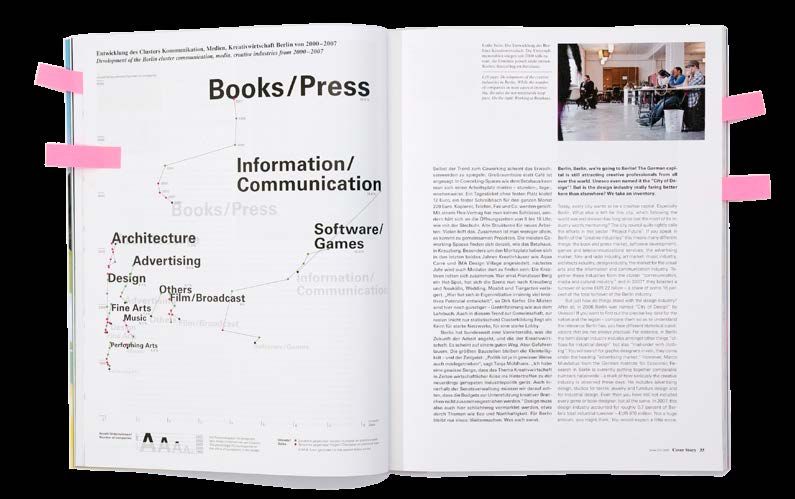
3
–
Die Kunst, aufzuräumen
Planungsinstrumente
Hochparterre / ETH Zürich –
Institut für Städtebau (2014)

                                © Hahn und Zimmermann, 2014
Zusammenspiel der raumplanerischen und städtebaulichen
Planungsinstrumente im Grossraum Zürich
Rechtliche
Planungsebene Instrumente Grundlagen Kompetenzen Akteure
Eidgenossenschaft RPG Stimmvolk
Raumkonzept
Schweiz
Konzepte und
Stufenweise Berücksichtigung des Umweltrechts
(Energierichtlinien, Lärmschutz, Denkmalpflege etc.)
(Revision 2013)
Sachpläne
Raumrelevante Grundsatz- Parlament
Gesetze (Wald, gesetzgebung
Umweltschutz, in der Raum-
Natur- und planung
Heimatschutz
etc.) Sachplanung Bundesrat
Raumrelevante
Bundesämter
Metropolitanregion Verein Metropoli-
Vision Metropolitanraum Zürich
Zürich
Metrobilder
tanraum Zürich
7 Kantone
1,6 Mio. EinwohnerInnen Vertretung der
Mitglieder:
Kantone und
Gemeinden
Volksabstimmungen
Kanton Zürich Langfristige Raumentwicklungsstrategie (LaRES), in Arbeit
Kantonale und regionale Nutzungszonen
Kantonale Gestaltungspläne
Stimmvolk
Räumliches Controlling des Kantons Zürich (Raumplanungsbericht)
1,4 Mio. EinwohnerInnen Kantonaler Richtplan
171 Gemeinden Agglomerationsprogramme Zürich § 20 ff. RPG, Planungshoheit Kantonsrat
‹Gegenstromprinzip›
PBG und -vollzug; Regierungsrat
Planungs- und Baudirektion
Raumordnungskonzept des Verordnungen, Baugesetz-
Kantons Zürich (ROK-ZH) Richtlinien gebung
und Normalien
Richtplanung Amt für Raum-
Nutzungsplanung entwicklung des
Kantons Zürich
11 Regionen des Vorbereitende politische, wirtschaftliche § 12 PBG Richtplanung Stimmvolk
Kantons Zürich Regionale Richtpläne
und gesellschaftliche Leitbilder § 30 PBG Regierungsrat
Die Stadt Zürich ist nach
Planungs- und 11 Planungs-
Baugesetz (PBG) eine Regionale Raumordnungs- verbände
Planungsregion ZPL*, ZPK*, ZPZ*,
konzepte (Regio-ROK) ZPP*, ZPG*, ZPF *,
Volksabstimmungen
RZO, RWU, PZU,
ZPW,
Stadt Zürich*
*Dachorganisa-
tion: RZU
Gemeinde Politisches, wirtschaftliches Kommunales räumliches Kommunaler Richtplan
Publikationen der Hochbauämter
und gesellschaftliches Leitbild «RES» (Stadt Zürich: Verkehr) Kommunale Bau- und Zonenordnung (BZO) Bau- und Nut-
zungsordnungen,
Planungsvollzug Stimmvolk,
Gemeinde-
Leitbild «Strategien 2025» Nutzungspläne, versammlung,
Beispiel Stadt Zürich
Zonenpläne Gemeinderat
Richtplanung
Gebietsspezifische Leitbilder
Städtebauliche Studien
ohne EigentümerInnen
und Bevölkerung
Partizipationsverfahren
mit der Bevölkerung
Anpassung BZO Quartierplan Nutzungsplanung Bau- und
und -konzepte oder Masterpläne Planungsamt (AfS)
Quartier
Bevölkerung
Kooperative Verfahren
Standort- und-
Machbarkeits-
studien
Sondernutzungspläne: Behörden
© Hahn und Zimmermann, 2014
(Testplanungen etc., städte-
– Gestaltungsplan Verwaltung
bauliche Ideenwettbewerbe)
Areal – Sonderbauvorschriften EigentümerInnen
(inkl. Arealüberbauung) InvestorInnen
Studienaufträge und (mindestens Verkehrsrichtplan zwingend) EntwicklerInnen
Architekturwettbewerbe PlanerInnen
(Genehmigung durch den Kanton) ArchitektInnen
Objekt /Projekt
- +
Verbindlichkeit: Strategien, Grundlagen, verwaltungsinterne Handlungsanweisungen Behördenverbindlich Eigentümerverbindlich
HauptakteurInnen: Profis (vorwiegend nach professionellen Kriterien erarbeitete Vorschläge) PolitikerInnen (vorwiegend politisch PolitikerInnen, EigentümerInnen (vorwiegend politisch sowie durch
motivierte Entscheidungen) persönliche Betroffenheit motivierte Entscheidungen)4 – Bewusster Einsatz der Werkzeuge Farben, Format, Linienstärken, Schrift …
Unser Kampf gegen den Hunger
muehlhausmoers/Welthungerhilfe (2014)

                                        © Hahn und Zimmermann, 2014
DaS tun Wir jahreSbericht 2013 | 6 7 | DaS tun Wir jahreSbericht 2013
Projekte zur Förderung
Projekte zur sozialen zivilgesellschaftlicher Basisinfrastrukturprojekte
Strukturen 6,8 Mio. eur 12 Sonstige Projekte
Integration und Bildung 2,5 Mio. eur
2 Mio. eur 2,7 Mio. eur 2012: 12 projekte,
2012: 9 projekte,
2012: 17 projekte, 2012: 13 projekte, 5,3 Mio. eur
2,4 Mio. eur
2,1 Mio. eur
18
2,1 Mio. eur 19
10 16 Nothilfeprojekte
Projekte zur ländlichen 6,8 Mio. eur
und regionalen Entwicklung 2012: 9 projekte,
74
11 Mio. eur 2 Mio. eur
2012: 68 projekte,
1 Projekt zu Gesundheit
7,6 Mio. eur
und HIV & Aids
0,7 Mio. eur
2012: 1 projekt,
ASIEN 13 länder
150
0,6 Mio. eur
unser Kampf gegen den Hunger EuropA projekte mit 32,4 Mio.
22
projekte mit 2,6 Mio. Eur projektvolumen
Eur projektvolumen
Allein im Jahr 2013 hat die Welthungerhilfe Menschen in 40 Ländern mit 355 Auslandsprojekten* unterstützt. 22 Inlandsprojekte NorDKorEA
stärkten das Bewusstsein für Hunger und Armut in der deutschen und europäischen Öffentlichkeit und Politik. Seit ihrer Gründung 1962 TADScHIKISTAN
förderte die Welthungerhilfe 7.348 Auslandsprojekte mit rund 2,66 Milliarden Euro, davon 5.174 Selbsthilfeprojekte. SYrIEN
3 12 AFgHANISTAN
Projekte zur Projekte zur
NEpAl
Öffentlichkeitsarbeit Politikarbeit bANglADEScH
pAKISTAN
0,1 Mio. eur 1,4 Mio. eur
7
KubA Projekte zur INDIEN
MYANMAr
HAITI DoMINIKANIScHE
Mobilisierung MAlI
lAoS
rEpublIK 1,1 Mio. eur NIgEr SuDAN
pHIlIppINEN
NIcArAguA
burKINA FASo KAMboDScHA
SIErrA
lEoNE ÄTHIopIEN SoMAlIA
Projekte zur ländlichen
gHANA SrI lANKA
und regionalen Entwicklung SÜDSuDAN
14,7 Mio. eur lIbErIA
Sonstige Projekte 2012: 38 projekte, ugANDA KENIA
38
1,1 Mio. eur 9,4 Mio. eur
EcuADor
2012: 12 projekte, DEM. rEp.
2,4 Mio. eur KoNgo ruANDA
8 buruNDI
pEru TANSANIA
MAlAWI
MoSAMbIK AFrIKA 20 länder 3 Projekte zur Förderung
136
Projekte zur Förderung zivilgesellschaftlicher
zivilgesellschaftlicher Strukturen
bolIvIEN
Strukturen
MADAgASKAr 0,2 Mio. eur
0,9 Mio. eur 8 lATEINAMErIKA uND KArIbIK 7 länder SIMbAbWE
projekte mit 81,4 Mio.
2012: 3 projekte,
0,6 Mio. eur
61
2012: 6 projekte, Eur projektvolumen
0,8 Mio. eur projekte mit 22,5 Mio.
Eur projektvolumen
Nothilfeprojekte
3 Projekte zu Gesundheit
0,9 Mio. eur 3
und HIV & Aids
2012: 5 projekte, 0,7 Mio. eur
1,6 Mio. eur
24
© Hahn und Zimmermann, 2014
Basisinfrastrukturprojekte
22 2011: 1 projekt,
0,5 Mio. eur
Projekte zur sozialen
3 18,6 Mio. eur
55
Integration und Bildung
2012: 25 projekte,
Basisinfrastrukturprojekte
4,7 Mio. eur
1
Projekt zur sozialen 18,4 Mio. eur
5,1 Mio. eur 16
2012: 2 projekte, Integration und Bildung 13 2012: 20 projekte, Sonstige Projekte
projektländer der Welthungerhilfe Projekte zur ländlichen 4,8 Mio. eur 3,6 Mio. eur
3,4 Mio. eur 0,2 Mio. eur und regionalen Entwicklung Nothilfeprojekte
2012: 1 projekt, 19,3 Mio. eur 2012: 16 projekte,
projektländer der alliance2015Mitglieder, in 33,9 Mio. eur
denen die Welthungerhilfe nicht selbst aktiv ist 0,1 Mio. eur 2012: 21 projekte, 3,9 Mio. eur
2012: 65 projekte,
* Davon 8 überregionale projekte, die hier nicht abgebildet sind 31,4 Mio. eur 32,2 Mio. eurWem gehört die Welt?
DIE ZEIT (2014)
© Hahn und Zimmermann, 2014© Hahn und Zimmermann, 2014
4
–
Schrift als Informationsträger
Wie nützt das Neue?
Wirtschaftsmagazin brand eins (2013)

                                       © Hahn und Zimmermann, 2014
CH
sCHWerPUnKT: ForTsCHriTT Wagen _TeCHnologie sCHWerPUnKT: ForTsCHriTT Wagen
Innovationsindikator
Wie nützt
80
77
das Neue?
SG
70
BE SE
Revolutionäre Technik bringt die Welt voran.
NL
Stimmt.
DE US
63
Aber leider deutlich seltener als behauptet.
DK NO FI
60 60
AT
59
58
GB TW FR IE AU CA
Text: Thomas Ramge 56 56
Grafik: Von B und C, Hahn und Zimmermann 54 54
53 53
50 50 50
KR
49
Chemie und Energie 48 48 48
JP
7%
Software und Internet Datenverarbeitung 44
8% und Elektronik
28 % 42
Sonstige
10 % 40
Industrie
10 %
Gesundheit
Auto 22 %
15 %
30
Anteile der Branchen an den gesamten Forschungs-
und Entwicklungsausgaben weltweit (Quelle: Booz & Company)
ES
23
1. Der Toilettentest 20
Disruptive Technologie – das rufen sie alle. Zumindest fast alle, Legende (Grafik rechts): CN IT
die Forschungsgeld für Grundlagenforschung beantragen. Die auf 15 15
CH. . . . . . . . . . . . . . . . . . . . . . . . . . . . . Schweiz AU . . . . . . . . . . . . . . . . . . . . . . . . . . . Australien
der Suche nach Risikokapital für ein Start-up sind. Die Kunden
SG. . . . . . . . . . . . . . . . . . . . . . . . . . . . Singapur TW . . . . . . . . . . . . . . . . . . . . . . . . . . . . . Taiwan
mit einem Produkt der angeblich ganz neuen Art umwerben. Der SE . . . . . . . . . . . . . . . . . . . . . . . . . . Schweden IE . . . . . . . . . . . . . . . . . . . . . . . . . . . . . . . . . Irland
Durchbruch ist überall. Im Genom, im ultraleichten Verbundstoff, NL . . . . . . . . . . . . . . . . . . . . . . . .Niederlande KR . . . . . . . . . . . . . . . . . . . . . . . . . . . Südkorea 10
im mobilen Endgerät mit revolutionärer Benutzeroberfläche. BE . . . . . . . . . . . . . . . . . . . . . . . . . . . . . . Belgien JP . . . . . . . . . . . . . . . . . . . . . . . . . . . . . . . . .Japan
DE . . . . . . . . . . . . . . . . . . . . . . . . Deutschland ES . . . . . . . . . . . . . . . . . . . . . . . . . . . . . Spanien
© Hahn und Zimmermann, 2014
Wenn er noch nicht da ist, dann steht er unmittelbar bevor. Zum PL
US . . . . . . . . . . . . . . . . . . . . . . . . . . . . . . . . . .USA CN . . . . . . . . . . . . . . . . . . . . . . . . . . . . . . . China ZA
Nutzen des Einzelnen, der Gesellschaft, der Menschheit. 5 5
DK . . . . . . . . . . . . . . . . . . . . . . . . . . Dänemark IT. . . . . . . . . . . . . . . . . . . . . . . . . . . . . . . . . . Italien 4 4
Neue Techniken kommen als Großmäuler auf die Welt. Sie FI. . . . . . . . . . . . . . . . . . . . . . . . . . . . . . . Finnland PL . . . . . . . . . . . . . . . . . . . . . . . . . . . . . . . . . .Polen
versprechen viel. Ob der Behauptung auch der Beweis folgt, wer- NO . . . . . . . . . . . . . . . . . . . . . . . . . Norwegen RU . . . . . . . . . . . . . . . . . . . . . . . . . . . . Russland IN BR
AT . . . . . . . . . . . . . . . . . . . . . . . . . . Österreich ZA . . . . . . . . . . . . . . . . . . . . . . . . . . . Südafrika 0 0 0
den die Erfinder in der Regel erst mit grauen Haaren erfahren. Das
FR . . . . . . . . . . . . . . . . . . . . . . . . . . . Frankreich TR . . . . . . . . . . . . . . . . . . . . . . . . . . . . . . . . . Türkei
war schon immer so. Vermutlich muss es so sein. Ein Problem CA. . . . . . . . . . . . . . . . . . . . . . . . . . . . . Kanada IN. . . . . . . . . . . . . . . . . . . . . . . . . . . . . . . . . Indien Index zur Innovationsfähigkeit der führenden Industrieländer im Jahr 2012
der Gegenwart ist allerdings: Die Frequenz der disruptiven > GB. . . . . . . . . . . . . . . . . . . . Großbritannien BR . . . . . . . . . . . . . . . . . . . . . . . . . . . . . Brasilien Kontinente: Europa, Asien, Nordamerika, Australien, Afrika, Südamerika (Quelle: BDI, Deutsche Telekom Stiftung)
30 Brand eins 07/13 Brand eins 07/13 31sCHWerPUnKT: ForTsCHriTT Wagen
Toyota
hat nach Einschätzung der Gartner-Analysten bei den Erwartun-
9.9 gen noch Luft nach oben.
Novartis 9.6 5. Das Alte und das Neue
Roche 9.4 „Innovation hat immer eine bestimmte Historizität“, sagt Marion
Weissenberger-Eibl. Der Satz hängt in der Luft ihres Büros im
Pfizer 9.1 Fraunhofer-Institut für System- und Innovationsforschung. Die
Professorin und Beraterin der Bundeskanzlerin holt etwas weiter
Microsoft 9 aus, um ihn zu erden. Das Datenkompressionsverfahren MP3
kam zur richtigen Zeit. Unabhängig von der viel diskutierten
Samsung Electronics 9 Frage, wer es erfunden hat und wer damit Geld verdient, verklei-
nerte MP3 die Dateigrößen von Musiktiteln, sodass sie auf be-
Merck 8.5 zahlbare Flash-Speicher passten und bei der verfügbaren Daten-
Übertragungsgeschwindigkeit schnell im Internet heruntergeladen
Intel 8.4 werden konnten. Heute wäre MP3 als Technik gar nicht mehr so
wichtig. Denn auch die Datenmengen von Musik in CD-Qualität
General Motors 8.1 passen auf Flash-Speicher und sind im Netz transportfähig. MP3
hat sich clever und zum richtigen Zeitpunkt in unseren Alltag
Nokia 7.8
gemogelt, ist aber voraussichtlich kein Standard für die Ewigkeit,
Volkswagen 7.7
sondern unterliegt dem immer wiederkehrenden Zyklus der In-
novation. Sein Nutzen nimmt ab. Etwas Neues mit höherem
Johnson & Johnson 7.5 Nutzen wird kommen. Woher? Wir wissen es nicht. Weissen-
berger-Eibl bringt es auf die Formel: „Es gibt keine natürliche
Sanofi 6.7 Erbfolge der Innovation.“ Der Kugelschreiber wurde nicht von
einem Füllfederhalterhersteller erfunden, sondern von einem ehe-
Panasonic 6.6
maligen Versicherungsmakler und Rennfahrer.
Honda Motor 6.6 Wirklich Neues entsteht meist an den Schnittstellen der Tech-
nologien und Disziplinen. Zum Beispiel an den Berührungspunk-
GlaxoSmithKline 6. 3 ten von IT, Biologie und klassischen Ingenieurswissenschaften.
Sie unterwandern alle möglichen Felder von Alltag, Arbeit und
IBM 6. 3
Wertschöpfung. Sie machen das Leben des Einzelnen einfacher
Cisco Systems 5.8 und mehren den Wohlstand vieler. Sie schaffen das, wenn sie sich
nach den Phasen der Ernüchterung in frühen Entwicklungssta-
Daimler 5.8 dien als lernfähig erweisen. Und wenn ihre Erfinder und Entwick-
AstraZeneca 5. 5 ler sich darüber austauschen, wo die neue Technik Mehrwert
bringen könnte. Oft kommen die Innovationen gar nicht laut auf
Ranking der 20 Unternehmen mit den höchsten Ausgaben die Welt, sondern verstecken sich zunächst hinter den Großspre-
für Forschung und Entwicklung im Jahr 2011 (in Milliarden US-Dollar) chern. Leise Kandidaten wären die Sensorik oder die synthetische
Branchen: Gesundheit, Datenverarbeitung /Elektronik, Auto Biologie.
(Quelle: Bloomberg; Booz & Company)
Armin Grunwald sagt: „Wir sind zu Hype-Junkies verkom-
men.“ Kaum habe eine Technik die Erwartungen an sie nicht er-
füllt, gierten wir nach der nächsten. „Die Schere zwischen Hype
und technischem Fortschritt geht immer weiter auseinander.“
durch unsere Adern tauchen, um irgendwo im Körper irgend- Den gleichen Eindruck hatte schon ein anderer kluger Beobach-
© Hahn und Zimmermann, 2014
etwas zu reparieren. Windschutzscheiben, an denen dank Mikro- ter des Zeitgeists vor rund drei Jahrzehnten. Der Philosoph Odo
struktur Wasser schneller abläuft, sind wohl eher als inkrementel- Marquard, ein Konservativer, ein Lobbyist der Bewahrung der
ler Fortschritt zu sehen. Auf dem Gipfel überzogener Erwartungen Gegenwart. Marquard war der Überzeugung: Das Neue muss
des aktuellen Gartner’s Hype Cycle stehen gerade 3-D-Druck, beweisen, dass es besser ist als das Alte. Nicht umgekehrt.
Hybrid Cloud Computing und Social-Media-Analyse. Big Data Die Toilette ist dafür das beste Beispiel. --
Brand eins 07/13 35Kulturwirtschaft Berlin
Form – Zeitschrift für Design (2010)
© Hahn und Zimmermann, 2014Entwicklung des Clusters Kommunikation, Medien, Kreativwirtschaft Berlin von 2000 –2007
Development of the Berlin cluster communication, media, creative industries from 2000 –2007
Anzahl Unternehmen /Number of companies
Books/Press
6000
2007 20.5 %
2006
5000
2005
2004
Information/
4000
2003
2002
2001
Communication 14.6 %
Books/Press
2000
Software/
Architecture
Architecture 11.3 %
Games
3000 10.9 %
Advertising 9.8 %
Design Information/
Communication
9.3 %
Others
8.1 %
Film/Broadcast
Advertising 8%
2000
Fine Arts 7.3 %
Music Others
Film/Broadcast
6.3 %
Design
Fine Arts
Performing Arts Software/Games
Music 4.8 %
1000
Performing Arts
© Hahn und Zimmermann, 2014
Umsatz /
0 1 2 3 4 5 6 7 8 Sales
AAAA
Anzahl Unternehmen / 5000 Die Prozentangabe (%) entspricht Umsatz / Zunahme gegenüber Vorjahr / Increase on previous year
2000 2007
Number of companies 4000 dem Anteil Unternehmen am Cluster / Sales Abnahme gegenüber Vorjahr / Decrease on previous year
3000 The percentage (%) corresponds to in Mrd. Euro, gerundet / to the nearest billion euros
2000 the share of companies in the cluster.
A 1000Social Networking Websites
Beef Magazine (2009)
MySpace
253ʼ145ʼ404
50 Internetcommunities
Facebook
mit Launchjahr und Userzahl
Quelle: http://en.wikipedia.org/wiki/
List_of_social_networking_websites
(Stand: 06.03.09)
Visualisierung: Hahn und Zimmermann
235ʼ000ʼ000
HabboWindows Live Spaces
120ʼ000ʼ000
117ʼ000ʼ000
Friendster
90ʼ000ʼ000
hi5
80ʼ000ʼ000
Tagged
70ʼ000ʼ000
Orkut
67ʼ000ʼ000
Reunion Flixster
63ʼ000ʼ000
51ʼ000ʼ000
Classmates
50ʼ000ʼ000
40ʼ000ʼ000
NetlogBebo
36ʼ000ʼ000
35ʼ000ʼ000
LinkedIn
30ʼ000ʼ000
Odnoklassniki 29ʼ000ʼ000
V Kontakte
27ʼ000ʼ000 22ʼ000ʼ000 24ʼ000ʼ000
Xanga 20ʼ000ʼ000 Skyrock imeem
Last.fm
20ʼ000ʼ000
Mixi
21ʼ000ʼ000 20ʼ936ʼ509
BlackPlanet
17ʼ564ʼ977
19ʼ000ʼ000
Fotolog 17ʼ000ʼ000
LiveJournal Friends Reunited
Plaxo
15ʼ000ʼ000 13ʼ000ʼ000
Badoo WAYN
15ʼ000ʼ000
Xiaonei Sonico Geni
15ʼ000ʼ000
Care2 DeviantART Multiply Buzznet Nasza-klasa
Hyves myYearbook StudiVZ
Trombi XING Viadeo MocoSpace
itsmy
Vampirefreaks iWiW Stickam Twitter
Nexopia CafeMom
1995 1996 1997 1998 1999 2000 2001 2002 2003 2004 2005 2006 2007 2008 2009
© Hahn und Zimmermann, 2014MySpac
253ʼ145ʼ404
50 Internetcommunities
Facebo
mit Launchjahr und Userzahl
Quelle: http://en.wikipedia.org/wiki/
List_of_social_networking_websites
(Stand: 06.03.09)
Visualisierung: Hahn und Zimmermann
235ʼ000ʼ000
HabboWindows Live
120ʼ000ʼ000
117ʼ000ʼ000
Friendster
90ʼ000ʼ000
hi5
80ʼ000ʼ000
Tagged
70ʼ000ʼ000
Orkut
67ʼ000ʼ000
Reunion Flixster
63ʼ000ʼ000
51ʼ000ʼ000
Classmates
50ʼ000ʼ000
40ʼ000ʼ000
NetlogBebo
36ʼ000ʼ000
35ʼ000ʼ000
LinkedIn
30ʼ000ʼ000
Odnoklassniki
© Hahn und Zimmermann, 2014
29ʼ000ʼ000
V Kontakte
27ʼ000ʼ000 22ʼ000ʼ000 24ʼ000ʼ000
Xanga 20ʼ000ʼ000 Skyrock imeem
Last.fm
20ʼ000ʼ000
Mixi
21ʼ000ʼ000 20ʼ936ʼ509
BlackPlanet
17ʼ564ʼ977
19ʼ000ʼ000
Fotolog 17ʼ000ʼ000
LiveJournal Friends Reunited
Plaxo
15ʼ000ʼ000 13ʼ000ʼ000
Badoo WAYN
15ʼ000ʼ000
Xiaonei Sonico Geni
15ʼ000ʼ000
Care2 DeviantART Multiply Buzznet Nasza-klasa
Hyves myYearbook StudiVZ
Trombi XING Viadeo MocoSpace
itsmy
Vampirefreaks iWiW Stickam Twitter
Nexopia CafeMom
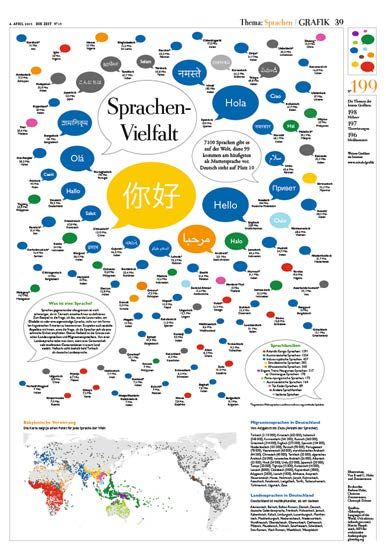
1995 1996 1997 1998 1999 2000 2001 2002 2003 2004 2005 2006 2007 2008 20095 – Visuelle Metapher
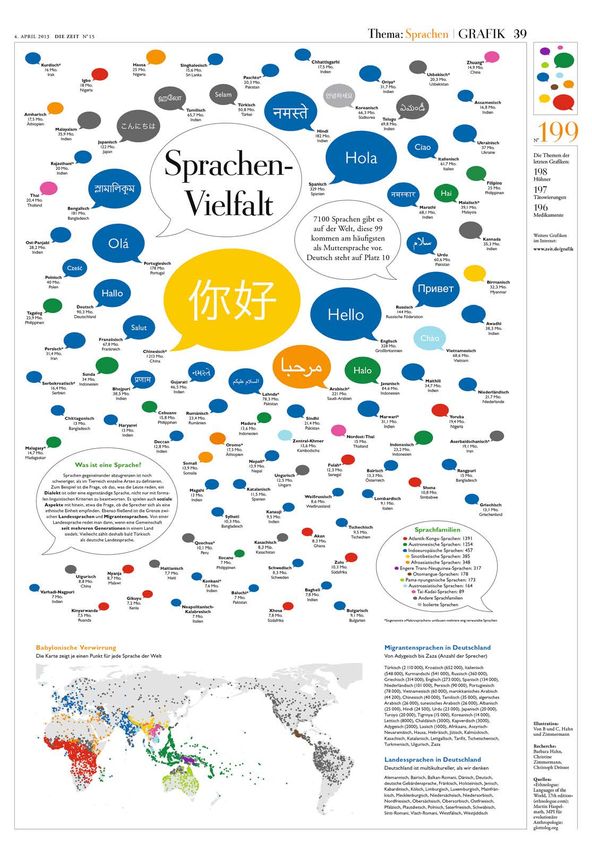
Sprachenvielfalt
DIE ZEIT (2013)

                   © Hahn und Zimmermann, 2014
© Hahn und Zimmermann, 2014
Questions
Bank Julius Bär (2011)

                         © Hahn und Zimmermann, 2014
Are
Are
Are
Are green
green
greeninvestments
investments
investmentssustainable?
sustainable?
sustainable?
Are green
Are green investments
green investments sustainable?
investments sustainable?
sustainable?
Very Life
Looking
Looking
Lookingforfornew
newsources
sources “Desalination
“Desalination
“Desalination of
of
“Desalinationof
Very Life
Looking for new sources
Very
Very Life
Life problem
problem
problem isisisthe
the lack
lack ofof incentives,
incentives, as
as long
long as
as water
water
problemisis the lack of incentives, as long as water
“Desalination of
Very
Very
Very LifeLife
Life problem isthe
thelack
lackof ofincentives,
incentives,as aslong
longasaswater
problem the lack of incentives, as long as water
for new sources
Very Life
of
Excellent
Excellent
Excellent Good
Good
Good Fair
Fair
Fair Poor
Poor
Poor Very
poor
Very
poor
poor Life
Very elapsed
elapsedLife
Life
elapsed water
Excellent
Excellent
Excellent Good
Good
Good Fair
Excellent Good
Good Fair Poor
Fair Poor
Fair Poor
Poor poor
poor elapsed
poor elapsed
poor elapsed
elapsed
Excellent
Excellent
Excellent Good
Good Fair
FairFair Poor
PoorPoor poor
poorpoor elapsed
elapsed
elapsed can
can
canbe
be
beaccessed
accessed
accessed at
at
atlow,
low,
low, or
or
oreven
even
evenno
no
nocost.
cost.
cost.
can
canbe
can beaccessed
be accessedat
accessed atlow,
at low,or
low, oreven
or evenno
even nocost.
no cost.
of water
Excellent Good Fair Poor poor elapsed cost.
of
ofwater
of water
water saltwater
saltwater
saltwateris is one
one
isone
saltwater is one
68
68 %
68% % 19
19 %
19% % 3 3 %
3%% 3 3%%
3 3%% 222%%
2%% 555%%
5%%
1980
1980
1980
one
68 %%%%%%%
68 1919 % 3333%
%%%%%%% 3%3 % 3333%
3%%% 3%%% 2222% 2%%% 5555% 5%%%
1980
68 19 3 2 5
1980
1980
68
68 68 % 19
19 19 % % %
1980
1980
1980
68
68 19
19 33%%% 33%%% 22%%% 55%%%
1980
1980
68 % 19 % Governments
Governments
Governments can
can
can do
do
do their
their
their part
part
part to
to
toencourage
encourage
encourage
1980
Governments
Governmentscan
Governments cando
can dotheir
do theirpart
their partto
part toencourage
to encourage
encourage
the
the
the
the agricultural
agricultural
agricultural
efficient
efficient
efficient
efficient
sector
irrigation.
sector
irrigation.
sector
irrigation.
efficientirrigation.
efficient InIn
irrigation.InIn
irrigation. In
to
our
to
our
to
our
Inour
adopt
adopt
adopt
the agricultural sector to adopt modern,water-
the agricultural
agricultural sector
sector to
to adopt
adopt
view,
view,
view,
ourview,
our
modern,
modern,
modern,
modern,
modern,
putting
putting
putting
view,putting
view, putting aa
water-
a
water-
water-
water-
water-
price
price
price
puttingaaaprice
on
priceon
price onon
on
on use
Besidesbecoming
Besides
Besides
Besides
Besides
Besides
usewater,
use
water,
water,
becomingmore
becoming
becoming
becoming
becoming
especially
especially
especially
moreefficient
more
more
more
more
in
efficientininhow
efficient
efficient
efficientin
efficient
inagriculture,
agriculture,
ininagriculture,
agriculture,
ininhow
howwe
how
how
in how
we
we
thereare
there
there
we
we
weare
are
way
way
way to
wayto
to increase
toincrease
increase the
increasethe
the
the
supply of fresh
use
use water,
water,especially
especially in agriculture, there
there are
are
supply
supplyof offresh
water and more effectively controlling its use both use water, especially in agriculture, there are
fresh
water
water and
and more
more effectively
effectively controlling
controlling its
its use
use both
both opportunities on the supply side that can mitigate
supply of fresh
water
waterand
water andmore
and moreeffectively
more effectivelycontrolling
effectively controllingits
controlling itsuse
its useboth
use both
both opportunities
opportunities on
on the
the supply
supply side
side that
that can
can mitigate
mitigate
offer
offer
offerpromises
promises
promises that
that
that might
might
might induce
induce
induce farmers
farmers
farmers to
to
tobetter
better
better opportunities
opportunities
opportunities on
on
on the
the
the supply
supply
supply side
side
side that
that
that can
can
can mitigate
mitigate
mitigate
offer
offerpromises
offer promisesthat
promises thatmight
that mightinduce
might inducefarmers
induce farmersto
farmers tobetter
to better
better the theimpacts
impactsofofthe thewidening
wideninggap gapbetween
betweenwater’s water’s
the impacts of the widening gap between water’s
water.”
the
the impacts
impactsand ofofthethe widening
wideninggap gap between
between water’s
water’s
water.”
manage water resources, by providing an economic the impacts of the widening gap between water’s
water.”
manage
manage water
water resources,
resources, by
by providing
providing an
an economic
economic availability consumption demand. Desalination
water.”
manage
manage water
water resources,
resources, by
by providing
providing
manage water resources, by providing an economic an
an economic
economic availability
availability and
and consumption
consumption demand.
demand. Desalination
Desalination
benefit
benefit
benefit to
to
toswitching
switching
switching to
to
to newer
newer
newer technologies.
technologies.
technologies. The
The
The availability
availability
availability and
and
and consumption
consumption
consumption demand.
demand.
demand. Desalination
Desalination
Desalination
benefit
benefitto
benefit toswitching
to switchingto
switching tonewer
to newertechnologies.
newer technologies.The
technologies. The
The of of saltwater
saltwater is
isisone one way
way toto increase
increase thethe supply
supply
of
of saltwater
ofsaltwater
saltwater isis one
isone
one way
way to
to increase
toincrease
increasethe
waydesalination the supply
thesupply
supply
mounting
mounting
mounting pressure
pressure
pressure to
totoprovide
provide
provide adequate
adequate
adequate water
water
water isisis of saltwater one way to increase the supply
mounting
mounting pressure
mounting pressure
pressure to to provide
to provide adequate
provide adequate
adequate waterwaterisis
water is ofof
of
of
of
fresh
fresh
fresh
fresh
fresh
water.
water.
water.
water.
water.
Global
Global
Global
Global
Global
desalination
desalination
desalination
desalination
capacity
capacity
capacity
capacity
capacity
has has
has
has
has Potential options for this are numerous, especially
likely
likely
likely
likely to
to
toencourage
encourage
encourage reforms
reforms
reforms inin
inthis
this
thisdirection
direction
direction inin
inthe
the
the of fresh
grown water.
quite Global
significantly desalination
in recent capacity
decades, has
andisis Potentialoptions
Potential
Potential optionsfor
options forthis
for thisare
this arenumerous,
are numerous,especially
numerous, especially
especially
likely to encourage reforms in this direction inthe
likely to
to encourage
encourage reforms
reforms in
in this
this direction
direction in
in the
the grown
grown
grown
quite
quite
quite
significantly
significantly
significantly
ininrecent
inin recent
recent
decades,
decades,
decades,
and
and
and
andis isis Potential
Potential options
options for
forinthis
this are
arenumerous,
numerous, especially
especially
future.
future.
future.
future.
grown
grown quite
quite
expectedtotocontinue significantly
significantly
continuethe in
theupward recent
recent
upwardtrend, decades,
decades,
trend,especially
especiallyand is in ininin
inin
industry
industry
industry
industry
but
but
but
but
also
also
also
also in in
inin
households.
households.
households.
households.
We
WeWe
We
do
dodo not
not
donot
need
notneedneed
need
Very
Very
Very
Very Life
Life
Life
Life
future.
future. expected
expected
expected
expected to
to
to continue
continue
continue the
the
the upward
upward
upward trend,
trend,
trend, especially
especially
especially inindustry
industry
drinking water
but
buttoalso
also
flush inhouseholds.
households.
the toilet.
We
Wedo do
Expansions
not
not need
need
inin
Very Life
Life
Very elapsed expected
the regions toof continue
the Middle the upward
East and trend,
Northern especiallyAfrica. drinking
drinking
drinking
drinking water
water
water
water toto
to
to flush
flush
flush
flush thethe
the
the toilet.
toilet.
toilet.
toilet. Expansions
Expansions
Expansions
Expansions in in
inin
Excellent
Excellent Good
Excellent
Excellent Good
Good
Excellent Good
Excellent Good Fair
Fair
Fair
Fair
Fair Poor
Poor
Poor
Poor
Poor poor elapsed
poor
poor elapsed
poor elapsed
poor
poor elapsed ininthethe regions
regions of
of the
the Middle
Middle East
East and
and Northern
Northern drinking water to flush the toilet. Expansions
Good Fair Poor elapsed inin
inthe
the regions
thethough of
ofthe
regionsproduction
regions of theMiddle
the Middle
Middle East
East
East and
and Northern
Northern treatment capacities and corresponding access
Even costs perand litre Northern
oflitre
desalinated treatmentcapacities
treatment
treatment capacitiesand
capacities andcorresponding
and correspondingaccess
corresponding access
access
32% 11% 12% 13% 23% 9% Water
Waterdistribution
Water distributionand
distribution and
and Africa.
Africa.
Africa.
Africa.
Even
Even
Even
Even
though
though
though
though
production
production
production
production
costs
costs
costs
costs
per
per
per
per litre
litre
litreof
ofof
of
treatment
totreatment
infrastructure
capacities
capacities
are
and
andcorresponding
required corresponding
to harness
access
access
these
2020
32
3232 %%%
%%%%%
11
1111 %%%
%%%%%
12
1212 %%% 13
%%%%%
13
13 %%%
%%%%%
23
2323 %%%
%%%%%
99
9999%
9%% % Africa. Even though production costs
still per litre of to to infrastructure
infrastructure are
are required
required toto harness
harness these
these
2020
water havewater massively declined, itdeclined, remains a to infrastructure are required to harness these
2020
2020
32
3232 11
1111 12
1212 13
1313 23
2323 9%%%
9 to infrastructure are required to harness these
2020
32 11 12 % 13 23 desalinated have massively ititstill
2020
2020
2020
32
32 % 11 % 12 13 % 23 % % to infrastructure are required to harness these
%% 11 %% 12 %% 1313 %% 23 %% 99%%%
2020
32 11 12 23 desalinated water have massively declined, still
2020
2020
32 11 12 13 23 desalinated
desalinated water
water have
have massively
massively declined,
declined, itit
it still
still technologies. However, as with agricultural irrigation,
2020
desalinated
relatively water have
expensiveexpensive massively
and energy-intensive declined, still
technology. technologies.
technologies.
technologies. However,
However,
However, asas
as with
with
with agricultural
agricultural
agricultural irrigation,
irrigation,
irrigation,
treatment
treatmentinfrastructure
treatment infrastructure
infrastructure remains
remains
remains
Desalination
technology.
technology.
technology.
a relatively
remainsaaaarelatively
remains relatively
relatively
relatively
thus has
Desalination
Desalination
Desalination
expensive
expensive
expensive
expensive
tothuscompete
thus
thus
and
and
and
andwith
and
has
has
has
to
energy-intensive
energy-intensive
energy-intensive
to
to
energy-intensive
energy-intensive
other with
compete
compete with
technologies.
technologies.
the
the the
the
the
the
key
key
key
key
key
key
toto
to
to
to
to
success
However,
However,
success
success
success
success
success
will
will
will
will
will
will
be
as
be
be
be
be
be
to
with
astowith
to
to
to
to
give
give
agricultural
give
give
give
give
agricultural
consumers
consumers
consumers
consumers
consumers
consumers
irrigation,
irrigation,
of
ofof
of
of
of
technology.
technology.
options to Desalination
Desalination
improve water thus
thus
supply. has
hasOne tocompete
to compete
compete
such
with
optionwithis
with fresh
fresh
fresh
fresh
water
freshwater
waterreal
water
water
real
real
real
incentives,
realincentives,
incentives,meaning
incentives,
incentives,
meaning
meaningcost
meaning
meaning
cost savings,
costsavings,
cost
cost savings,
savings,
savings,
other
other options
options to
to improve
improve water
water supply.
supply. One
One such
such fresh water real incentives, meaning cost savings,
Clearly,
Clearly, water
water infrastructure
infrastructure inininmuch
much of
of the
the other
other
other options
options
options to
to
to improve
improve
improve water
water
water supply.
supply.
supply. One
One
One such
such
such toto lead
tolead them
leadthem
themto to invest
investinin
toinvest equipment
inequipment
equipment to
toto reuse
reuse
reuse water.
water.
water.
Clearly,
Clearly,
Clearly,water
Clearly, water infrastructure
infrastructureinin
waterinfrastructure
water infrastructure much
inmuch
muchof
much of
ofthe
of the
the
the treatment
option and direct
isistreatment and reuse
direct ofre-use
waste of water.
waste Beyond toto lead
tolead
lead them
them
themto to invest
toinvest inin equipment
inequipment
investinclude, equipment to
to reuse
toreuse water.
water.
reusestricter
water.
option
option
option isis treatment
istreatment
treatment and
and direct
anddirect
direct re-use
re-use
re-useof of
of waste
waste
waste Such incentives could for example,
developing
developing
developing
developing
developing world
world
world
world
world isis
is
is
isstill
still
still
still
still unsatisfactory,
unsatisfactory,
unsatisfactory,
unsatisfactory,
unsatisfactory, despite
despite
despite
despite
despite option
drinking treatment
water, and
and specific direct re-use
industrial of waste
applications Such
Such
Such
Such incentives
incentives
incentives
incentives could
could
could
could include,
include,
include,
include, for
for
for
for example,
example,
example,
example, stricter
stricter
stricter
stricter
developing world is still unsatisfactory, despite water.
water. Beyond
Beyond drinking
drinking water,
water, and
and specific
specific industrial
industrial Such incentives couldhow include, foris example, stricter
water.
water.
water. Beyond
Beyond drinking
drinkingwater water,
water,isand and specific
specific industrial
industrial regulations governing water consumed, and/
considerable
considerable
considerable
considerable improvements
improvements
considerableimprovements
considerable improvements
improvementsachieved
improvements achieved
achieved
achieved
achievedinin
achieved inininrecent
recent
recent
inrecent
recent
recent where Beyond
applications highest-quality
where
drinking water,
highest-quality
and specific
critical,
water we industrial
can
isiscritical, regulationsgoverning
regulations
regulations
regulations
regulations
governinghow
governing
governing
governinghow
how
how
howwater
water
water
water isisconsumed,
waterisis
consumed,
consumed,
isconsumed,
consumed,and/
and/
and/
and/
and/
applications
applications
applications where
where
where highest-quality
highest-quality
highest-quality water
water
water is
is critical,
critical, or how it is priced.
years
years
years
years
years regarding
regarding
regarding
regarding access
access
access
access to
to
to
to drinking
drinking
drinking
drinking water
water
water
water
waterand and
andproper
and
and proper
proper
proper applications
substantially where
reducehighest-quality
pressure water water
on natural is critical,
critical, orororhow
or howititit
how
how itisisis
ispriced.
priced.
priced.
priced.
years regarding
regarding access access to to drinking
drinking water and proper
proper wewe
wewe
can
can
can
can
substantially
substantially
substantially
substantially
reduce
reduce
reduce
reduce
pressure
pressure
pressure
pressure
on
on
on
on
natural
natural
natural
natural or how it is priced.
sanitation.
sanitation.
sanitation.
sanitation.
sanitation. Given
Given
Given
Given
Given the
the
the
the
the relatively
relatively
relatively
relatively
relatively low
low
low
low
low per
per
per
per
per capita
capita
capita
capita
capita we can
resources substantially
if we ifreuse reduce
treated, pressure
lower-quality on natural water for
sanitation. Given the relatively low per capita water
water resources
resources we
ififwe
we re-use
re-use treated,
treated, lower-quality
lower-quality
water
water consumption
consumption levels
levels inininthe
the developing
developing versus
versus water
water
water resources
resources
resources if re-use
wewhere
if we re-use treated,
treated,lower-quality
re-usesuitable.
treated, lower-quality
lower-quality
Quality of drinking water
water
water consumption
waterconsumption
consumptionlevels
consumption levels
levelsinin
levels inthethe
the developing
thedeveloping
developingversus
developing versus
versus
versus certain
water for applications,
certain applications, where suitable.
Quality
Quality of Qualitywater:
Quality
Quality
ofdrinking
drinking
of
ofUS
of USdrinking
US
water:
water:
drinking
drinking water
water
waterfor for certain
forcertain applications,
certainapplications,
applications,where where suitable.
wheresuitable.suitable.
US Environmental
waterProtection
water Agency
infrastructure the
the
the
the developed
developed
developed world
world
world to
to
todate,
date,
date, the
the
the pressure
pressure
pressure on
on
onthe
the
the water for certain applications, where suitable.
US water
USEnvironmental
Environmental
infrastructure
Protection
Protection
Source:
US US
Agency
infrastructure
Agency
Environmental
Environmental
thedeveloped
the developedworld
developed worldto
world todate,
to date,the
date, thepressure
the pressureon
pressure onthe
on the
the
Source: US Environmental existing
existing
existing
existing
existing infrastructure
infrastructure
infrastructure
infrastructure will
will
will
will grow,
grow,
grow,
grow, with
with
with
with water
water
water
water usage
usage
usage
usage
Protection
ProtectionAgency,
Protection Agency,2002
Agency, 2002
2002 existing infrastructure
infrastructure will will grow,
grow, with with water
water usageusage
expected
expected
expected to
toto rise
rise
rise as
as
as economic
economic
economic growth
growth
growth inininthese
these China
China India
India Rest
Rest of
of Asia
Asia Sub-South
Sub-Saharan Africa
Africa
expected
expectedto
expected torise
to riseas
rise aseconomic
as economicgrowth
economic growthinin
growth these
inthese
these
these China
China
China
China
China
China
China
China
China
China
IndiaIndia
India
India
India
India India
India
India
India
Rest
Rest
Rest
Rest
Rest of
Rest
of
Rest
Rest
Rest
Rest
of
ofof
of
of
Asia
of
of Asia
Asia
Asia
Asia
Asia
of Asia
Asia
Asia
Asia
Sub-Saharan
Sub-South
Sub-South
Sub-South
Sub-South
Sub-South
Sub-South
Sub-South
Africa
Sub-Saharan
Africa
Africa
Sub-South Africa
Africa
Africa
Africa
Africa
Africa
Africa
regions
regions
regions progresses.
progresses.
progresses. More
More
More supplies
supplies
supplies of
of
offresh
fresh
fresh water
water
water 300
300
regions
regionsprogresses.
regions progresses.More
progresses. Moresupplies
More suppliesof
supplies of freshwater
offresh
fresh water
water
must
must be
be secured.
secured. AsAs aa consequence,
consequence, there
there will
will 89
must be secured. As a consequence, there will 89
More
Morecrop
More cropper
crop perdrop
per drop
drop
must
mustbe
must
also
also
also
also be
alsobe
also be
besecured.
be
be
be more
secured.As
secured.
more
more
bemore
morewaste
more waste
waste
waste
Asaaaconsequence,
As
wastewater
waste water
water
water
consequence,there
consequence,
waterto
water tototo be
tobe
to bebe deal
deal
bedeal
be deal
therewill
there
with.
with.
with.
dealwith.
deal
will
will
Thus,
Thus,
with.Thus,
with. Thus,
Thus,
Thus,
117
117
28
28
one
one
one could
could reasonably
reasonably assume
assume that
that investment
investment ininin
one could reasonably assume that investmentinin
one
one could
could
could reasonably
reasonably
reasonably assume
assume
assume that
that
that investment
investment
investment in
Agricultural
Agricultural activity
activity consumes
consumes 70%
70% ofof the
the demand
demand basic
basic
basic water
water
water infrastructure
infrastructure
infrastructure isis atat very
very least
least not
not going
going
Agricultural
Agricultural
Agriculturalactivity
Agricultural activity consumes
activityconsumes
activity consumes70%
consumes 70%
70%of
70% of
of the
ofthe
thedemand
the demand
demand
demand basic
basicwater
basic water infrastructureisis
waterinfrastructure
infrastructure isat
is at
at very
atvery
very least
veryleast
leastnot
least not going
notgoing
not going
going 467
467
467
467
467
bn
bn
467
bn
467bn
467 mm
467
467
bn
467
333
mm
m33 40
40 440
440 440
bn
440
440 bn
440
bnmm
440 333
mm 92
92
440bn440 33
for
for fresh
fresh water
water worldwide.
worldwide. Asia,
Asia, with
with more
more than
than two
two to
to
todecline
decline
decline inininthe
the years
years ahead.
ahead. Releasing
Releasing water
water bn
467m3 440 bn
440
bn m
m3
for fresh water worldwide. Asia, with more than two declineinin the years ahead. Releasing water
to 440 440
for
forfresh
for freshwater
fresh waterworldwide.
water worldwide.Asia,
worldwide. Asia,with
Asia, withmore
with morethan
more thantwo
than two todecline
to decline inthe
theyears
the yearsahead.
years ahead.Releasing
ahead. Releasingwater
Releasing water 532 440 bn mm 80
333
two water 532
532 440
440
440 440
bn
440
bn mm
440bn 80
33
532
532 440 440
bn
440
bn
440m
m3
thirds
thirds of
of global
global irrigated
irrigated land,
land, depends
depends heavily
heavily on
on untreated,
untreated,
untreated, asas often
often happens
happens these
these days,
days, inflicts
inflicts 532 54
thirds of global irrigated land, depends heavily on untreated, as often happens these days, inflicts
as often happens these days,
thirds
thirds of
of global
global irrigated
irrigated land,
land, depends
depends heavily
heavily on
on untreated,
untreated, asas often
often happens
happens these
these days,
days, inflicts
inflicts 532
532bn
532
532 bn
bn
bn mmm
333
54
bnmm
33
thirds of global irrigated land, depends heavily on inflicts 532
532 bn m3
irrigation,
irrigation,
irrigation, especially
especially
especially due
due
due to
to
to its
its
its rice
rice
rice production.
production.
production. While
While
While severe
severe
severe
severe long-term
long-term
long-term damage
damage
damage ononon the
the
the environment,
environment,
environment, not
not
not
irrigation,
irrigation,especially
irrigation, especiallydue
especially dueto
due toits
to itsrice
its riceproduction.
rice production.While
production. While
While severe long-term damage on the environment,not
severe long-term
long-term damage
damage onon the
the environment,
environment, not
not
global
global
global water
water
water scarcity
scarcity
scarcity is
is
isbecoming
becoming
becoming a aaserious
serious
serious threat
threat
threat to
to
to to
to
to
to mention
mention
mention posing
posing
posing aaarisk
risk
risk to
to
to human
human
human health
health
health and
and
and the
the
the
global
globalwater
global waterscarcity
water scarcityisis
scarcity isbecoming
becomingaaaserious
becoming seriousthreat
serious threatto
threat to
to tomention
to mentionposing
mention posingaaarisk
posing riskto
risk tohuman
to humanhealth
human healthand
health andthe
and the
the
large
large
large areas
areas
areas that
that
that represent
represent
represent key
key
key growing
growing
growing regions,
regions,
regions, at
at
at future
future
future
future sustainability
sustainability
sustainability of
ofofthe
the
the water
water
water supply.
supply.
supply.
large
largeareas
large areasthat
areas thatrepresent
that representkey
represent keygrowing
key growingregions,
growing regions,at
regions, at
at futuresustainability
future sustainabilityof
sustainability ofthe
of thewater
the watersupply.
water supply.
supply.
the
the
the
the same
same
same time,
time,
time, the
the
the demand
demand
demand for
for
for water
water
water by
by
by industry
industry
industry and
and
and
thesame
the sametime,
same time,the
time, thedemand
the demandfor
demand forwater
for waterby
water byindustry
by industryand
industry and
and 243
households
households also
also isis on
on the
the rise.
rise. Farmers
Farmers will
will thus
thus face
face River
River
River systems
systems
systems inininselected
selected areas
areas ofof the
the world
world already
already 178 338 320
households also is on the rise. Farmers will thus face systemsinin selected areas of the world already
River 178 338 243
households
households also
also is
is on
on the
the rise.
rise.
households also is on the rise. Farmers will thus face Farmers
Farmers will
will thus
thus face
face Riversystems
River systems inselected
selectedareas
selected areasof
areas ofthe
of theworld
the worldalready
world already
already North America Europe South America
320
tough
tough pressure
pressure to
to use
use water
water more
more efficiently.
efficiently. Overall,
Overall, are
are
are showing
showing
showing signs
signs
signs ofofofaaasevere
severe
severe deterioration
deterioration
deterioration in
in the
the North America Europe South America
tough pressure to use water more efficiently. Overall, deteriorationinin the
are North America Europe South America
tough
toughpressure
tough pressureto
pressure touse
to usewater
use watermore
water moreefficiently.
more efficiently.Overall,
efficiently. Overall,
Overall, areshowing
are showingsigns
showing signsof
signs ofaaasevere
of severedeterioration
severe deterioration inthe
in the
the NorthAmerica
North
North
North
North
America
America
America
America
Europe
Europe
Europe
Europe
Europe
SouthAmerica
South
South
South
South
America
America
America
America Industry
irrigation
irrigation
irrigation
irrigation infrastructure
infrastructure
infrastructure still
still
still has
has
has a a along
long
long ways
ways
ways to
to
togo,
go,
go, quality
quality
quality
quality of
of
of
of their
their
their
their water.
water.
water.
water. In
In
InIn China,
China,
China,
China, for
for
for
for example,
example,
example,
example, no
no
no
no North
North America
NorthAmerica
America Europe
Europe
Europe South
South America
SouthAmerica
America
Industry
Industry
Industry
irrigationinfrastructure
irrigation infrastructurestill
infrastructure stillhas
still hasaaalong
has longways
long waysto
ways togo,
to go,
go, quality
quality of of their
their water. water. In In China,
China, for for example,
example, no no 124 124
Industry
given
given that
that large
large amounts
amounts of
of water
water never
never reach
reach the
the less
less
less than
than
than 71%
71%
71% of
ofof water
water
water inininits
its seven
seven largest
largest rivers
rivers
given
given
given that
that
that large
large
large amounts
amounts
amounts of
of
of
given that large amounts of water never reach the water
water
water never
never
never reach
reach
reach the
the
the less
lessthan
less than71%
than 71%of
71% of waterinin
ofwater
water inits its
its seven
itsseven
sevenlargest
seven largest
largestrivers
largest rivers
rivers
rivers Annual
Annual
Water
Water demand
Annual
Water
water
demand
demandwater
water
demand:
demand:
demand:Group
plants
plants
plants for
for
for which
which
which the
the
the water
water
water isisisintended.
intended. Technologies
Technologies isis labeled
isis labeled
labeled asasas grade
grade
grade 4-5,
4-5,
4–5, meaning
meaning
meaning itit isis
it undrinkable.
isundrinkable.
undrinkable. Water indemand
waterisis intended. Technologies
plants labeled as grade 4-5, meaning it is undrinkable. 2030 Water Resources
plantsfor
plants forwhich
for whichthe
which thewater
the water isintended.
intended.Technologies
intended. Technologies
Technologies is labeled as grade 4-5,
is labeled as grade 4-5, meaning it is undrinkable.meaning it is undrinkable. 100
Water
Water demand
2030demand
in
2030
in
in bn
Water
billion
billion
demandWater
billion
m 3 Resources
ResourcesGroup
Household
Domestic
Household
Group
Household
Domestic
Domestic
to
to get
get “more
‘more crop
crop per
per drop’
drop’ are
are at
at least,
least, in
inin theory,
theory, But
But
But not
not
not only
only
only inininemerging
emerging countries
countries isisisthere
there aastrong
strong 100 68 cubic
cubic ininbn
bnmm3
metre
metres
3
to
to
to get
toget
get ‘more
get“more
“morecrop
‘more crop
cropper
crop per drop’
perdrop’
per drop’are
drop’ are
areat
are at least,
atleast,
at least,in
least, theory,
intheory,
in theory,
theory, But
Butnot
But notonly
not onlyinin
only emerging
inemerging
emergingcountries
emerging countries
countriesisis
countries there
thereaaaastrong
isthere
there strong
strong
strong 68 cubic metre
available. Drip irrigation and improved sprinkler need to invest in water infrastructure. The developed
© Hahn und Zimmermann, 2014
available.
available.
available. Drip
Drip
Drip irrigation
irrigation
irrigation and
and
and improved
improved
improved sprinkler
sprinkler
sprinkler need
need
need
need to
to
to invest
invest
invest in
inin water
water
water infrastructure.
infrastructure.
infrastructure. The
The
The developed
developed
developed 326
available.
available. Drip Drip irrigation
irrigation and and improved
improved sprinklersprinkler need to to invest
invest in in water
water infrastructure.
infrastructure. The The developed
developed 326 bn
326
326
326
326
326
mmm
333
21
Increase
Increase
Increase
Increase
2005–2030
2005–2030
2005–2030
Agriculture
Agriculture
Increase 2005–2030
Agriculture
2005–2030
infrastructure
infrastructure
infrastructure can
can
can significantly
significantly
significantly reduce
reduce
reduce the
the
the amounts
amounts
amounts world
world
world also
also
also has
has
has considerable
considerable
considerable gaps
gaps
gaps toto
to close,
close,
close, given
given
given 326
326
326 bn
bn 21 Agriculture
Agriculture
326bn
bnmm
33
world 326 bn Increase 2005–2030
infrastructure
infrastructurecan
infrastructure cansignificantly
can significantlyreduce
significantly reducethe
reduce theamounts
the amounts
amounts worldalso
world alsohas
also hasconsiderable
has considerablegaps
considerable gapsto
gaps toclose,
to close,given
close, given
given m3
184
180
180
180180
180
Agriculture
Industry
Industry
Industry
of
of water
water needed.
needed. One
One major
major impediment
impediment, however,
however, that
that
that reinvestment
reinvestment inin
ininexisting
existing facilities
facilities have
have been
been 184
184 Industry
of water needed. One major impediment, however, that reinvestment in existing facilities have been
reinvestment existing facilities have
of
of water
water needed.
needed. One
One major
major impediment
impediment, however,
however, that
that reinvestment
reinvestment in existing
existing facilities
facilities have
have been
been 184
184 180
180bn
180
180 bn180
bn
bn mmm
333
23 Industry
Industry
bnmm 23
33
of water needed. One major impediment however, been 184
184bn
184
184 bn184
bn
bn mmm
333
12
12 180
180 bn m3 Domestic
bnmm
33
184
184 bn m3 Domestic
Domestic
at
at least
least inininthe
the developing
developing world,
world isisthat farmers neglected
neglected
neglected inininthe
the past
past years.
years. As
As aaconsequence,
consequence, Domestic
at least
leastinin the developing world
world,is isthat
thatfarmers neglectedinin the past years. As
Asaaaaconsequence,
consequence,
neglected Domestic
at
atleast
at least inthe
thedeveloping
the developingworld,
developing world that farmers
farmers neglected inthe thepast
the pastyears.
past years.As
years. As consequence,
consequence, Expected
Domestic
Agriculture
Agriculture
Agriculture
increase in
have
have
have little
little
little access
access
access to
to
tofinancing
financing
financing they
they
they need
need
need for
for
for capital
capital
capital replacement
replacement
replacement
replacement costs
costs
costs loom
loom
loom inininthe
the
the future
future
future as
asasthe
the
the Expected
Expected increase increase inannual
in
Agricultureannual
Agriculture
Agriculture annual
have
have little
have little access
little access
access to to financing
to financing
financing they they
they needneed
needfor forcapital
for capital
capital replacementcosts
replacement costsloom
costs loominin
loom inthe
thefuture
the futureas
future asthe
as the
the Increase
water demand
Increase
water
Increase
water inin
demand
Increase
demand
Increase
Increase
annual
inin
in
in
annual
annual
annual
annual
annual
water
2005-2030
water
2000–2030
water
water
2005-2030
water
water
investments
investments
investments
investments
investments to
to
to
to
toapply
apply
apply
apply
apply these
these
these
these
these technologies.
technologies.
technologies.
technologies.
technologies. Another
Another
Another
Another
Another equipment
equipment
equipment
equipment
equipment reaches
reaches
reaches
reaches
reaches the
the
the
the
the end
end
end
end
end of
of
of
of
ofits
its
its
its
itsuseful
useful
useful
useful
useful life.
life.
life.
life.
life. demand
Source:
demand
2030 Water
demand
demand
Source:
demand (2005–2030)
2030
(2005–2030)Water
Resources
(2005–2030)
(2005–2030)
2030 Water
(2005–2030) Resources
Resources
investments to apply these technologies. Another equipment reaches the end of its useful life. 181 72 89 demand (2005–2030)
Group,
181 72 89 Group,2009
Group, 2009
2009
38 39
39
39
39
38
36
38
38 39
39
37
39
39
38 39Sie können auch lesen