EINFLUSS SCHLAFBEZOGENER ATMUNGSSTÖRUNGEN AUF DAS RECHTSVENTRIKULÄRE REMODELLING NACH MYOKARDINFARKT
←
→
Transkription von Seiteninhalten
Wenn Ihr Browser die Seite nicht korrekt rendert, bitte, lesen Sie den Inhalt der Seite unten
AUS DEM LEHRSTUHL
                FÜR INNERE MEDIZIN II
           DIREKTOR PROF. DR. LARS MAIER
             DER FAKULTÄT FÜR MEDIZIN
           DER UNIVERSITÄT REGENSBURG

EINFLUSS SCHLAFBEZOGENER ATMUNGSSTÖRUNGEN AUF DAS
        RECHTSVENTRIKULÄRE REMODELLING NACH
                  MYOKARDINFARKT

                 Inaugural – Dissertation
             zur Erlangung des Doktorgrades
                       der Medizin

                           der
                   Fakultät für Medizin
               der Universität Regensburg

                     vorgelegt von
                    Michael Eglseer

                         2015
AUS DEM LEHRSTUHL
FÜR INNERE MEDIZIN II
DIREKTOR PROF. DR. LARS MAIER
DER FAKULTÄT FÜR MEDIZIN
DER UNIVERSITÄT REGENSBURG
EINFLUSS SCHLAFBEZOGENER ATMUNGSSTÖRUNGEN AUF DAS
RECHTSVENTRIKULÄRE REMODELLING NACH
MYOKARDINFARKT
Inaugural – Dissertation
zur Erlangung des Doktorgrades
der Medizin
der
Fakultät für Medizin
der Universität Regensburg
vorgelegt von
Michael Eglseer
2015
Dekan:                               Prof. Dr. Dr. Torsten E. Reichert

1. Berichterstatter:                 Prof. Dr. Michael Arzt

2. Berichterstatter:                 Prof. Dr. Thomas-Christian Wetter

Tag der mündlichen Prüfung:          13.07.2015
Inhaltsverzeichnis

1. Zusammenfassung der wissenschaftlichen Originalarbeit................................. 4

         1.1 Einleitung.............................................................................................. 4

         1.2. Methoden............................................................................................. 6

                   1.2.1 Studiendesign.......................................................................... 6

                   1.2.2 Auswertung der Magnetresonanztomographie........................ 6

         1.3. Ergebnisse........................................................................................... 10

                   1.3.1 Rechter Vorhof........................................................................ 10

                   1.3.2 Linker Vorhof........................................................................... 11

                   1.3.3 Rechter Ventrikel..................................................................... 11

                   1.3.4 Lineare Regression................................................................. 13

         1.4. Diskussion............................................................................................ 14

         1.5 Literaturverzeichnis............................................................................... 18

2. Wissenschaftliche Originalarbeit: „Sleep-disordered breathing and

enlargement of the right heart after myocardial infarction“.................................... 23

3. Danksagung....................................................................................................... 36

                                                          3
1. Zusammenfassung der wissenschaftlichen Originalarbeit:
„Sleep-disordered breathing and enlargement of the right heart after
myocardial infarction“
[EINFLUSS SCHLAFBEZOGENER ATMUNGSSTÖRUNGEN AUF DAS
RECHTSVENTRIKULÄRE REMODELLING NACH
MYOKARDINFARKT]
1.1 Einleitung
Schlafbezogene Atmungsstörungen (SBAS) sind ein weitverbreitetes Phänomen,
dessen vollständige Ursachen und Auswirkungen mehr denn je Gegenstand
intensiver Forschung sind. Mittlerweile herrscht weitgehender Konsens darüber, dass
SBAS als bedeutender Risikofaktor für die unterschiedlichsten kardiovaskulären
Erkrankungen wie zum Beispiel der koronaren Herzerkrankung gewertet werden.
Dementsprechend überrascht es auch nicht, dass bei 43-66% der Patienten mit
einem akuten Myokardinfarkt (AMI) eine SBAS nachgewiesen werden kann [1-4].
Als Ergebnis der bisherigen Forschung konnte u.a. festgestellt werden, dass SBAS
mit weniger gerettetem Myokard und einer schlechteren Erholung der
linksventrikulären Funktion nach dem AMI assoziiert sind [1, 5]. Obwohl bereits
Hinweise darauf vorliegen, dass die strukturelle und funktionelle Integrität des
rechten Herzens ebenso von essenzieller Bedeutung für die Prognose von Patienten
nach einem AMI ist [6, 7], ist der genaue Einfluss von SBAS auf das rechte Herz
nach einem AMI noch weniger gut erforscht als für das linke Herz.
Dementsprechend lag die Entscheidung nahe, die Folgen der Schlafapnoe auf das
rechte Herz genauer zu untersuchen. Um ein möglichst genaues Bild der
4Veränderungen am rechten Herz zu gewinnen, stützt sich die vorliegende Arbeit auf
die Magnetresonanztomographie (MRT). Durch das MRT, welches als Goldstandard
der Untersuchungsmethoden des rechten Herzens gilt [8, 9], ist eine
Messgenauigkeit erreichbar, welche derzeit von keiner anderen klinisch verfügbaren
Modalität übertroffen wird [10-12].
Dementsprechend besteht die Zielsetzung der vorliegenden Studie darin, den
Einfluss der Schlafapnoe auf die Struktur und Funktion des rechten Herzens in der
Frühphase nach einem Myokardinfarkt, unter Zuhilfenahme des MRT, zu
untersuchen. Damit erhoffen wir uns Hinweise auf die pathophysiologische
Beeinflussung des Herzens durch SBAS nach einem AMI zu erhalten.
51.2 Methoden 1.2.1 Studiendesign Die vorliegende Beobachtungsstudie [4, 5, 13], deren Beobachtungseinheit Patienten mit einem erstmaligen akuten Myokardinfarkt (AMI) waren, wurde am Universitätsklinikum Regensburg durchgeführt. Alle Patienten waren jünger als 80 Jahre alt und wurden innerhalb von maximal 24 Stunden nach Beginn der Symptomatik einer Herzkatheteruntersuchung zugeführt. Nach Einschluss in die Studie wurde bei allen Patienten jeweils 3-5 Tage sowie 12 Wochen nach dem AMI eine Magnetresonanztomographie (MRT) – Untersuchung des Herzens durchgeführt. Ebenso wurde bei den Teilnehmern der Studie 3-5 Tage nach der Herzkatheteruntersuchung eine Polysomnographie (PSG) im Schlaflabor des Universitätsklinikums Regensburg durchgeführt. Anhand des dabei u.a. ermittelten Apnoe-Hypopnoe-Index (AHI) wurden die Patienten in eine „SBAS- Gruppe“ (AHI≥15) und einen „keine-SBAS-Gruppe“ (AHI
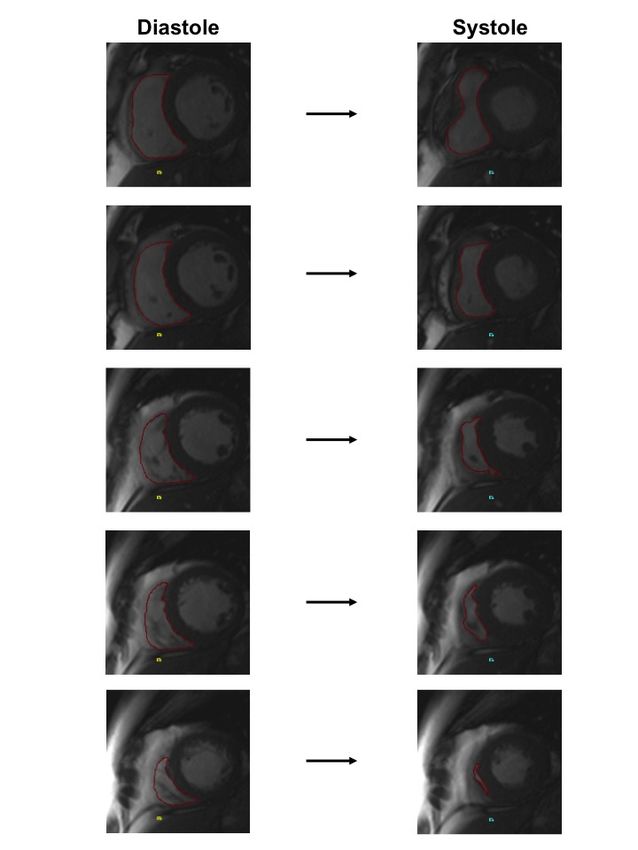
Vier-Kammer-Aufnahmen       des    Herzens    wurden     zur    Bestimmung     der

rechtsventrikulären „tricuspid anular plane systolic excursion“ (TAPSE) sowie der

Fläche der rechten und linken Vorhöfe verwendet. Zur Errechnung der TAPSE

wurde jeweils end-diastolisch und end-systolisch der Ansatzpunkt der freien Wand

des RV an der Trikuspidalklappe bestimmt. Im Anschluss wurden diese auf eine

gemeinsame Aufnahme übertragen und die Distanz zwischen den beiden Punkten in

Zentimetern gemessen. Dieser Parameter gilt als semi-quantitative Annäherung an

die Ejektionsfraktion des RV [15]. Zur Bestimmung der Fläche des rechten und linken

Vorhofs in der Systole und Diastole der Vorhöfe wurde diejenige Vier-Kammer-

Aufnahme des Herzens ausgewählt, auf der die Vorhöfe sowie das Vorhof- und

Ventrikelseptum vollständig abgebildet waren. Im Anschluss wurde manuell der

genaue endokardiale Verlauf der freien Wand der Vorhöfe, das Vorhofseptum sowie

die Mitral- bzw. Trikuspidalklappe bestimmt, um daraus die Fläche des Vorhofs zu

berechnen. Der „fractional area change“ (FAC) wurde bestimmt, indem die

prozentuale Verkleinerung der Fläche der Vorhöfe während der Kontraktion

berechnet wurde.

                                       7
Abbildung 1: Darstellung der graphischen Bestimmung der RV-Volumina und
der RVEF
8Abbildung 2: Darstellung der Bestimmung der TAPSE
Abbildung 3: Darstellung der Bestimmung der Fläche der Vorhöfe
91.3 Ergebnisse Von insgesamt 252 Patienten mit einem erstmaligen Myokardinfarkt, die in der Folge einer Herzkatheteruntersuchung zugeführt wurden, erfüllten 74 Patienten die Einschlusskriterien für die Studie. Im Anschluss mussten 20 Patienten aus der Analyse ausgeschlossen werden, u.a. weil die MRT- oder PSG-Untersuchungen nicht durchgeführt werden konnten oder weil die Analyse des RV in den gewonnenen Aufnahmen nicht möglich war. Die 54 Patienten, die in die abschließende Analyse einbezogen werden konnten, wurden anhand ihres Apnoe-Hypopnoe Index (AHI) in eine „SBAS-Gruppe“ (n=29, AHI≥15/h) und eine „keine-SBAS-Gruppe“ (n=25, AHI
Die RA-SF nahm ebenfalls in beiden Gruppen zu, dabei zeigten sich aber keine

signifikanten Unterschiede zwischen beiden Untersuchungsgruppen (p=0.175).

Beim „right atrial fractional area change“ (RA-FAC) zeigte sich kein signifikanter

Unterschied zwischen der SBAS-Gruppe und der keine-SBAS-Gruppe, weder zum

Ausgangszeitpunkt (27.4±10.7% vs. 30.7±7.9; p=0.214), noch nach 12 Wochen

(29.1±8.4% vs. 30.0±6.0%; p=0.657).

1.3.2 Linker Vorhof

Die Fläche des linken Vorhofs während der Systole (LA-SF) war bei Patienten aus

der SBAS-Gruppe im Vergleich zu Patienten aus der keine-SBAS-Gruppe zum

Ausgangszeitpunkt signifikant größer (18.2±5.3cm2 vs. 15.0±3.7cm2; p=0.017).

Dieses Verhältnis blieb auch nach 12 Wochen bestehen (17.2±4.8cm2 vs.

14.2±4.2cm2, p=0.022). Diese Effekte verschwanden allerdings nach Adjustierung für

das LVESV (p=0.194 und p=0.155).

Während der Diastole war die Fläche des linken Vorhofs (LA-DF) allerdings weder

zum Ausgangszeitpunkt (25.8±5.9cm2 vs. 23.2±5.4cm2; p=0.107) noch nach 12

Wochen    (25.7±4.9cm2 vs.     23.1±4.8cm2;     p=0.059)   signifikant   unterschiedlich

zwischen der SBAS-Gruppe und der keine-SBAS-Gruppe.

Der „left atrial fractional area change“ (LA-FAC) war bei Patienten aus der SBAS-

Gruppe im Vergleich zur keine-SBAS-Gruppe sowohl zum Ausgangszeitpunkt

(29.8±9.5% vs. 35.1±7.2%; p=0.030) als auch nach 12 Wochen (33.3±10.9% vs.

39.2±9.1%; p=0.043) signifikant kleiner.

1.3.3 Rechter Ventrikel

Das    rechtsventrikuläre   enddiastolische     Volumen      (RVEDV)       sowie    das

rechtsventrikuläre endsystolische Volumen (RVESV) waren zum Ausgangszeitpunkt
                                           11
in beiden Patientengruppen ähnlich (p=0.716 bzw. p=0.648). Während sich das
RVESV in keiner der beiden Gruppen innerhalb von 12 Wochen signifikant verändert
hatte, nahm das RVEDV im selben Zeitraum nur in der SBAS-Gruppe signifikant zu
(14±23ml vs. 0±17ml; p=0.020). Dieser Effekt blieb auch nach Anpassung für das
LVESV bestehen (p=0.014). Auch nach Normalisierung auf die Körperoberfläche
blieb die Zunahme des RVEDV in der SBAS-Gruppe im Vergleich zur keine-SBAS-
Gruppe signifikant größer (7±11ml m-2 vs. 0±9ml m-2; p=0.016).
Die ermittelten Funktionsparameter des RV, die RVEF sowie die TAPSE, zeigten
keine signifikanten Unterschiede zwischen den beiden Patientengruppen, weder zum
Ausgangszeitpunkt (p=0.466 bzw. p=0.234) noch nach 12 Wochen (p=0.520 bzw.
p=0.878). Innerhalb des zwölfwöchigen Beobachtungszeitraums wiesen die
Veränderungen der RVEF und der TAPSE ebenfalls keine signifikanten Unterschiede
auf (p=0.766 bzw. p=0.150).
Um einen eventuellen Einfluss der Infarktlokalisation auf die erhaltenen Ergebnisse
zu studieren, wurde eine Subanalyse durchgeführt, bei der nur Patienten mit
gesicherter Rechtsherzbeteiligung des Infarkts berücksichtigt wurden (n=24). Diese
Subpopulation wurde genauso in eine SBAS-Gruppe (n=13) und eine keine-SBAS-
Gruppe (n=11) unterteilt. Im Einklang mit der Primäranalyse zeigte sich dort ebenfalls
zum Ausgangszeitpunkt kein signifikanter Unterschied zwischen der SBAS-Gruppe
und der keine-SBAS-Gruppe im Bezug auf das RVEDV (p=0.379) sowie das RVESV
(p=0.668). Bei den Patienten in der SBAS-Gruppe erhöhte sich das RVEDV jedoch
ebenso signifikant (14±20ml; p=0.029), während es in der keine-SBAS-Gruppe
unverändert blieb (-3±20ml; p=0.640).
121.3.4 Lineare Regression
In einem nichtadjustierten Modell bestand eine signifikante Assoziation zwischen
dem AHI und dem RVEDV (p=0.028) sowie der RA-SF (p=0.049). In einem
vollständig für das Alter, das Geschlecht, den BMI, den Raucherstatus, das LVESV
und die Masse des linken Ventrikels angepassten Modell bestand nur noch eine
signifikante Assoziation zwischen dem AHI und dem RVEDV (p=0.041).
131.4 Diskussion
Als Hauptergebnisse der vorliegenden Arbeit können angesehen werden: Das
RVEDV nahm bei denjenigen Patienten mit SBAS innerhalb von 12 Wochen nach
dem AMI stärker zu als bei Patienten ohne SBAS. Ebenso nahm bei Patienten mit
SBAS die RA-DF im selben Beobachtungszeitraum nach dem AMI signifikant stärker
zu. Im Gegensatz dazu blieben die Funktionsparameter des RV innerhalb des 12-
Wochen-Intervalls nach dem AMI in beiden Gruppen unverändert.
Ein negativer Effekt der SBAS auf das RVEDV wurde bereits von Magalang et al [16]
und Colish et al [17] nahegelegt. Diese Interventionsstudien konnten zeigen, dass
durch die Therapie einer obstruktiven Schlafapnoe sogar bei Patienten ohne
bekannte Herzerkrankungen eine Verkleinerung des Rechtsherzvolumens erreicht
werden kann. Der Umfang der Verkleinerung des Rechtsherzvolumens entsprach
dabei etwa dem Ausmaß der Vergrößerung des RVEDV in unserer SBAS-Gruppe
innerhalb des 12-Wochen-Intervalls nach dem AMI [16, 17].
Dabei stellt sich jedoch die Frage, ob der in dieser Studie erstmalig festgestellte
negative Effekt auf das RVEDV bei Patienten mit einem AMI und SBAS tatsächlich in
direktem Kausalzusammenhang mit der beobachteten SBAS steht oder ob dieser
Effekt nur die Folge eines anderen Einflussfaktors ist, wie z.B. einer schlechteren
Linksherzfunktion. Die Zunahme des RVEDV in der SBAS-Gruppe blieb aber auch
nach Adjustierung für das LVESV, als Surrogatparameter der linksventrikulären
Funktion, im Vergleich zur keine-SBAS-Gruppe signifikant größer. Die Tatsache,
dass bereits mehrere frühere Studien zur selben Schlussfolgerung gekommen sind,
dass die Dysfunktion des rechten Herzens weitgehend unabhängig von der
Linksherzfunktion ist [6, 18, 19], unterstreicht diese These zusätzlich. Da ebenfalls
öfters der Verdacht geäußert wurde, dass die Dysfunktion des RV eher von der
14genauen Lokalisation sowie des Schweregrades des Myokardinfarktes abhängen
würde [6, 20], untersuchten wir, ob bei einer der beiden Patientengruppen ein
höherer Anteil an Herzinfarkten mit direkter Beteiligung des RV vorlag. Dabei zeigten
sich jedoch keine relevanten Unterschiede zwischen beiden Gruppen. Deshalb
führten wir eine Subanalyse durch, die nur Patienten mit im MRT gesicherter
Rechtsherzbeteiligung des Infarktareals berücksichtigte. Die Ergebnisse dieser
Subanalyse waren jedoch im Wesentlichen vergleichbar mit der Primäranalyse.
Ebenso gab es keine signifikanten Unterschiede zwischen den Patientengruppen mit
bzw. ohne SBAS hinsichtlich der Lokalisation des primären
Koronararterienverschlusses. In der Zusammenschau ergibt sich die
Schlussfolgerung, dass die in dieser Studie gefundene Vergrößerung des RVEDV
unabhängig von der linksventrikulären Funktion, der Beteiligung des RV am
Infarktareal sowie der Lokalisation des Koronararterienverschlusses zu sein scheint.
Neben der Vergrößerung der RVEDV zeigte sich bei Patienten mit AMI und SBAS
auch eine signifikant größere Zunahme der RA-DF. Dieser Effekt wird in dieser
Studie erstmals beschrieben. Die Aussagekraft der Erkenntnis, dass die RVEF,
repräsentativ für die Kontraktilität des RV, in beiden Patientengruppen nach dem AMI
unverändert bleibt, wird jedoch durch bisherige Studien verstärkt. Zwei Studien
zeigten, dass bei Patienten ohne kardiologische Erkrankungen nach mehrmonatiger
Therapie mit „Continuous Positive Airway Pressure“ (CPAP) keine signifikanten
Veränderungen der RVEF verzeichnet werden konnten [16, 17]. Dies suggeriert,
dass eine vorhandene SBAS nach einem AMI ebenfalls keinen wesentlichen Einfluss
auf die RVEF haben sollte.
15Bei der Untersuchung des linken Vorhofs konnte bei denjenigen Patienten mit
Schlafapnoe nach einem AMI eine größere LA-SF nachgewiesen werden als bei den
Patienten ohne Schlafapnoe. Ebenso wies die Patientengruppe mit SBAS eine
niedrigere LA-FAC vor, welche die Kontraktilität des linken Vorhofs repräsentiert.
Zusammen können diese Parameter in Form einer Belastung des linken Vorhofs
interpretiert werden. Eine größere Fläche des linken Vorhofs bei Patienten mit einer
Schlafapnoe nach einem AMI wurde bereits früher in der Literatur beschrieben, u.a.
von Oliveira et al und Kaviraj et al [21, 22].
Als pathophysiologische Erklärung der gefundenen Erkenntnisse muss einerseits
eine erhöhte Nachlast des RV diskutiert werden. Die vorhandene Atmungsstörung
führt über unterschiedliche Mechanismen, wie den Euler-Liljestrand-Mechanismus
[23-26] sowie eine Verringerung der Stickstoffmonoxidspiegel in der Lunge, zu
repetitiven Anstiegen des pulmonalarteriellen Druckes [27]. Selbst ohne kardiale oder
pulmonale Vorerkrankungen können leichte Formen der pulmonalen Hypertonie bei
bis zu 20% aller Patienten mit obstruktiver Schlafapnoe nachgewiesen werden [28,
29]. Andererseits kann die obstruktive Schlafapnoe ebenso eine Erhöhung der Vor-
und Nachlast des RV bewirken, u.a. durch eine Erhöhung des negativen
intrathorakalen Drucks während obstruktiver Apnoen. In Folge dessen ergibt sich ein
vergrößerter Blutfluss in Richtung des RV mit einer Druckbelastung dieser
Herzkammer und eine erhöhte rechtsventrikuläre Wandspannung [30]. Nicht zu
vernachlässigen ist aber auch die Tatsache, dass die nach einem AMI häufige
Dysfunktion des linken Ventrikels selbst ebenfalls die Ursache einer Dysfunktion des
RV sein kann [31]. Durch eine Dysfunktion des linken Ventrikels kann es zu einer
Druckerhöhung im linken Vorhof sowie in Folge dessen zu einer Vergrößerung des
linken Vorhofs kommen [6]. Diese pathophysiologischen Vorgänge konnten in dieser
16Studie nachvollzogen werden, da die gefundene Vergrößerung des RVEDV bei
Patienten mit SBAS ebenso mit einer größeren Fläche des linken Vorhofs
vergesellschaftet war.
Zusammenfassend legen die Ergebnisse der vorliegenden Studie nahe, dass die
SBAS bei Patienten in der Frühphase nach einem AMI mit einer Vergrößerung des
RV vergesellschaftet ist. Diese Veränderungen der rechten Herzkammer treten dabei
unabhängig von der linksventrikulären Funktion sowie einer Rechtsherzbeteiligung
des Infarktareals auf.
171.5 Literaturverzeichnis
1. Nakashima H, Katayama T, Takagi C, Amenomori K, Ishizaki M, Honda Y,
Suzuki S. Obstructive sleep apnoea inhibits the recovery of left ventricular function in
patients with acute myocardial infarction. Eur Heart J 2006: 27(19): 2317-2322.
2. Lee CH, Khoo SM, Tai BC, Chong EY, Lau C, Than Y, Shi DX, Lee LC,
Kailasam A, Low AF, Teo SG, Tan HC. Obstructive sleep apnea in patients admitted
for acute myocardial infarction. Prevalence, predictors, and effect on microvascular
perfusion. Chest 2009: 135(6): 1488-1495.
3. Skinner MA, Choudhury MS, Homan SD, Cowan JO, Wilkins GT, Taylor DR.
Accuracy of monitoring for sleep-related breathing disorders in the coronary care
unit. Chest 2005: 127(1): 66-71.
4. Buchner S, Greimel T, Hetzenecker A, Luchner A, Hamer OW, Debl K,
Poschenrieder F, Fellner C, Riegger GA, Pfeifer M, Arzt M. Natural course of sleep-
disordered breathing after acute myocardial infarction. Eur Respir J 2012: 40(5):
1173-1179.
5. Buchner S, Satzl A, Debl K, Hetzenecker A, Luchner A, Husser O, Hamer OW,
Poschenrieder F, Fellner C, Zeman F, Riegger GA, Pfeifer M, Arzt M. Impact of
sleep-disordered breathing on myocardial salvage and infarct size in patients with
acute myocardial infarction. Eur Heart J 2014: 35(3): 192-199.
6. Zornoff LA, Skali H, Pfeffer MA, St John Sutton M, Rouleau JL, Lamas GA,
Plappert T, Rouleau JR, Moye LA, Lewis SJ, Braunwald E, Solomon SD,
Investigators S. Right ventricular dysfunction and risk of heart failure and mortality
after myocardial infarction. J Am Coll Cardiol 2002: 39(9): 1450-1455.
187. Sakata K, Yoshino H, Kurihara H, Iwamori K, Houshaku H, Yanagisawa A,
Ishikawa K. Prognostic significance of persistent right ventricular dysfunction as
assessed by radionuclide angiocardiography in patients with inferior wall acute
myocardial infarction. Am J Cardiol 2000: 85(8): 939-944.
8. Mogelvang J, Stubgaard M, Thomsen C, Henriksen O. Evaluation of right
ventricular volumes measured by magnetic resonance imaging. Eur Heart J 1988:
9(5): 529-533.
9. Tandri H, Daya SK, Nasir K, Bomma C, Lima JA, Calkins H, Bluemke DA.
Normal reference values for the adult right ventricle by magnetic resonance imaging.
Am J Cardiol 2006: 98(12): 1660-1664.
10. Longmore DB, Klipstein RH, Underwood SR, Firmin DN, Hounsfield GN,
Watanabe M, Bland C, Fox K, Poole-Wilson PA, Rees RS, et al. Dimensional
accuracy of magnetic resonance in studies of the heart. Lancet 1985: 1(8442): 1360-
1362.
11. Sechtem U, Pflugfelder PW, Gould RG, Cassidy MM, Higgins CB.
Measurement of right and left ventricular volumes in healthy individuals with cine MR
imaging. Radiology 1987: 163(3): 697-702.
12. Grothues F, Moon JC, Bellenger NG, Smith GS, Klein HU, Pennell DJ.
Interstudy reproducibility of right ventricular volumes, function, and mass with
cardiovascular magnetic resonance. Am Heart J 2004: 147(2): 218-223.
13. Buchner S, Eglseer M, Debl K, Hetzenecker A, Luchner A, Husser O,
Stroszczynski C, Hamer OW, Fellner C, Zeman F, Pfeifer M, Arzt M. Sleep
disordered breathing and enlargement of the right heart after myocardial infarction.
Eur Respir J 2014. Oct 30. pii: erj00570-2014. [Epub ahead of print]
1914. Sleep-related breathing disorders in adults: recommendations for syndrome
definition and measurement techniques in clinical research. The Report of an
American Academy of Sleep Medicine Task Force. Sleep 1999: 22(5): 667-689.
15. Nijveldt R, Germans T, McCann GP, Beek AM, van Rossum AC. Semi-
quantitative assessment of right ventricular function in comparison to a 3D volumetric
approach: a cardiovascular magnetic resonance study. Eur Radiol 2008: 18(11):
2399-2405.
16. Magalang UJ, Richards K, McCarthy B, Fathala A, Khan M, Parinandi N,
Raman SV. Continuous positive airway pressure therapy reduces right ventricular
volume in patients with obstructive sleep apnea: a cardiovascular magnetic
resonance study. J Clin Sleep Med 2009: 5(2): 110-114.
17. Colish J, Walker JR, Elmayergi N, Almutairi S, Alharbi F, Lytwyn M, Francis A,
Bohonis S, Zeglinski M, Kirkpatrick ID, Sharma S, Jassal DS. Obstructive sleep
apnea: effects of continuous positive airway pressure on cardiac remodeling as
assessed by cardiac biomarkers, echocardiography, and cardiac MRI. Chest 2012:
141(3): 674-681.
18. Pfisterer M, Emmenegger H, Soler M, Burkart F. Prognostic significance of
right ventricular ejection fraction for persistent complex ventricular arrhythmias and/or
sudden cardiac death after first myocardial infarction: relation to infarct location, size
and left ventricular function. Eur Heart J 1986: 7(4): 289-298.
19. Gadsboll N, Hoilund-Carlsen PF, Madsen EB, Marving J, Pedersen A,
Lonborg-Jensen H, Dige-Petersen H, Jensen BH. Right and left ventricular ejection
fractions: relation to one-year prognosis in acute myocardial infarction. Eur Heart J
1987: 8(11): 1201-1209.
2020. Pfisterer M, Emmenegger H, Muller-Brand J, Burkart F. Prevalence and extent
of right ventricular dysfunction after myocardial infarction--relation to location and
extent of infarction and left ventricular function. Int J Cardiol 1990: 28(3): 325-332.
21. Kaviraj B, Bai SC, Su L, Zheng XO, Huang R, Li TP, Xu DL. Effect of
obstructive sleep apnea syndrome on serum C-reactive protein level, left atrial size
and premature atrial contraction. Nan Fang Yi Ke Da Xue Xue Bao 2011: 31(2): 197-
200.
22. Oliveira W, Campos O, Cintra F, Matos L, Vieira ML, Rollim B, Fujita L, Tufik
S, Poyares D. Impact of continuous positive airway pressure treatment on left atrial
volume and function in patients with obstructive sleep apnoea assessed by real-time
three-dimensional echocardiography. Heart 2009: 95(22): 1872-1878.
23. Arias MA, Garcia-Rio F, Alonso-Fernandez A, Martinez I, Villamor J.
Pulmonary hypertension in obstructive sleep apnoea: effects of continuous positive
airway pressure: a randomized, controlled cross-over study. Eur Heart J 2006: 27(9):
1106-1113.
24. Bady E, Achkar A, Pascal S, Orvoen-Frija E, Laaban JP. Pulmonary arterial
hypertension in patients with sleep apnoea syndrome. Thorax 2000: 55(11): 934-939.
25. Bonsignore MR, Marrone O, Insalaco G, Bonsignore G. The cardiovascular
effects of obstructive sleep apnoeas: analysis of pathogenic mechanisms. Eur Respir
J 1994: 7(4): 786-805.
26. Sajkov D, Wang T, Saunders NA, Bune AJ, Neill AM, Douglas Mcevoy R.
Daytime pulmonary hemodynamics in patients with obstructive sleep apnea without
lung disease. Am J Respir Crit Care Med 1999: 159(5 Pt 1): 1518-1526.
27. Lattimore JD, Wilcox I, Adams MR, Kilian JG, Celermajer DS. Treatment of
obstructive sleep apnoea leads to enhanced pulmonary vascular nitric oxide release.
Int J Cardiol 2008: 126(2): 229-233.
2128. Alchanatis M, Tourkohoriti G, Kakouros S, Kosmas E, Podaras S, Jordanoglou
JB. Daytime pulmonary hypertension in patients with obstructive sleep apnea: the
effect of continuous positive airway pressure on pulmonary hemodynamics.
Respiration 2001: 68(6): 566-572.
29. Atwood CW, Jr., McCrory D, Garcia JG, Abman SH, Ahearn GS. Pulmonary
artery hypertension and sleep-disordered breathing: ACCP evidence-based clinical
practice guidelines. Chest 2004: 126(1 Suppl): 72S-77S.
30. Malone S, Liu PP, Holloway R, Rutherford R, Xie A, Bradley TD. Obstructive
sleep apnoea in patients with dilated cardiomyopathy: effects of continuous positive
airway pressure. Lancet 1991: 338(8781): 1480-1484.
31. Marmor A, Geltman EM, Biello DR, Sobel BE, Siegel BA, Roberts R.
Functional response of the right ventricle to myocardial infarction: dependence of the
site of left ventricular infarction. Circulation 1981: 64(5): 1005-1011.
222. Wissenschaftliche Originalarbeit
„Sleep-disordered breathing and enlargement of the right heart
after myocardial infarction“
23ERJ Express. Published on October 30, 2014 as doi: 10.1183/09031936.00057014
ORIGINAL ARTICLE
IN PRESS | CORRECTED PROOF
Sleep disordered breathing and
enlargement of the right heart after
myocardial infarction
Stefan Buchner1,5, Michael Eglseer1,5, Kurt Debl1, Andrea Hetzenecker1,
Andreas Luchner1, Oliver Husser1, Christian Stroszczynski2, Okka W. Hamer2,
Claudia Fellner2, Florian Zeman3, Michael Pfeifer1,4 and Michael Arzt1
Affiliations:
1
Klinik und Poliklinik für Innere Medizin II, Universitätsklinikum Regensburg, Regensburg, Germany.
2
Institut für Röntgendiagnostik, Universitätsklinikum Regensburg, Regensburg, Germany.
3
Zentrum für klinische Studien, Biostatistics, Universitätsklinikum Regensburg, Regensburg, Germany.
4
Zentrum für Pneumologie, Klinik Donaustauf, Donaustauf, Germany.
5
Both authors contributed equally.
Correspondence:
Stefan Buchner, Klinik und Poliklinik für Innere Medizin II, Universitätsklinikum Regensburg, Franz-Josef-
Strauss-Allee 11, 93053 Regensburg, Germany.
E-mail: stefan.buchner@ukr.de
ABSTRACT Structural and functional integrity of the right heart is important in the prognosis after acute
myocardial infarction (AMI). The objective of this study was to assess the impact of sleep disordered
breathing (SDB) on structure and function of the right heart early after AMI.
54 patients underwent cardiovascular magnetic resonance 3–5 days and 12 weeks after AMI, and were
stratified according to the presence of SDB, defined as an apnoea–hypopnoea index of o15 events?h-1.
12 weeks after AMI, end-diastolic volume of the right ventricle had increased significantly in patients
with SDB (n527) versus those without (n525) (mean¡SD 14¡23% versus 0¡17%, p50.020).
Multivariable linear regression analysis accounting for age, sex, body mass index, smoking, left ventricular
mass and left ventricular end-systolic volume showed that the apnoea–hypopnoea index was significantly
associated with right ventricular end-diastolic volume (B-coefficient 0.315 (95% CI 0.013–0.617); p50.041).
From baseline to 12 weeks, right atrial diastolic area increased more in patients with SDB (2.9¡3.7 cm2
versus 1.0¡2.4 cm2, p50.038; when adjusted for left ventricular end systolic volume, p50.166).
SDB diagnosed shortly after AMI predicts an increase of right ventricular end-diastolic volume and
possibly right atrial area within the following 12 weeks. Thus, SDB may contribute to enlargement of the
right heart after AMI.
@ERSpublications
Sleep disordered breathing may predispose to enlargement of the right heart after acute myocardial
infarction http://ow.ly/Cc6vv
This article has supplementary material available from erj.ersjournals.com
Received: March 25 2014 | Accepted after revision: Sept 05 2014
Support statement: The study was funded by ResMed (Martinsried, Germany), Philips Home Healthcare Solutions
(Murrysville, PA, USA) and the Faculty of Medicine of the University of Regensburg (Regensburg, Germany).
Conflict of interest: Disclosures can be found alongside the online version of this article at erj.ersjournals.com
Copyright !ERS 2014
Eur Respir J 2014; in press | DOI: 10.1183/09031936.00057014 1
Copyright 2014 by the European Respiratory Society.
24SLEEP | S. BUCHNER ET AL.
Introduction
Right ventricular (RV) dysfunction occurs in approximately 20% of patients with acute myocardial
infarction (AMI) and impaired left ventricular (LV) systolic function [1]. Structural and functional integrity
of the right heart is important in the prognosis after AMI [1, 2]. Long-term survival is significantly lower in
patients with persistent RV dysfunction 3 months after AMI, and RV dysfunction is associated with a higher
end-diastolic dimension of the right ventricle [2]. Furthermore, RV systolic dysfunction is an independent
predictor of the development of heart failure and mortality after AMI [1].
Sleep disordered breathing (SDB) is present in 43–66% of patients with AMI [3–6]. AMI patients with SDB
are exposed to repetitive hypoxia, increased heart rate and increased cardiac afterload [7]. In addition,
coronary blood flow is uncoupled from cardiac workload in patients with SDB and related endothelial
dysfunction [8]. Through these mechanisms, SDB contributes to reduced myocardial salvage, increased
infarct size and impaired recovery of LV function in the early phase after AMI [3, 9]. Furthermore, SDB can
specifically affect the right heart via hypoxia-induced increases in pulmonary artery pressure [10–12].
Reduced nitric oxide-mediated vasodilation of the pulmonary vessels may contribute to increased
pulmonary artery pressure in patients with SDB [13].
Cardiovascular magnetic resonance (CMR) has been used to assess the influence of SDB on the right
ventricle of patients who do not have overt cardiac disease. Two recent uncontrolled trials using CMR
concluded that continuous positive airway pressure treatment in otherwise healthy patients with moderate-
to-severe SDB significantly reduced RV volume [14, 15], implying that SDB exerts adverse effects on the
right ventricle, even in the absence of other cardiovascular comorbidities.
However, the influence of SDB on RV function has not yet been studied in AMI patients. Therefore, the aim
of this study was to evaluate whether the presence of SDB in patients with AMI influences the structure and
function of the right heart, as assessed by CMR.
Methods
Patients
Inclusion criteria were as follows: patients aged 18–80 years with a first-time AMI (ST elevation on ECG or
complete occlusion of the coronary artery in non-ST elevation myocardial infarction) and percutaneous
coronary intervention (PCI) who were treated at the University Hospital Regensburg (Regensburg,
Germany) within 24 h of symptom onset. Exclusion criteria were as follows: previous myocardial infarction
or previous myocardial revascularisation (PCI or surgical); indication for surgical myocardial
revascularisation; cardiogenic shock; implanted cardiac device or other contraindications for CMR; known
treated SDB; lung disease; other severe diseases (e.g. stroke); and unfeasible follow-up (e.g. length of distance
to place of residence, language, etc.).
Study design
This prospective observational study was performed at the Universitätsklinikum Regensburg (Regensburg,
Germany). The study protocol was reviewed and approved by the local institutional ethics committee. The
study was performed according to the Helsinki Declaration of Good Clinical Practice. Written informed
consent was obtained from all patients prior to enrolment. Eligible patients underwent an overnight
in-laboratory sleep study (polysomnography) 3–5 days after PCI. CMR studies were performed 3–5 days
and 12 weeks after PCI. Clinical management and medication was at the discretion of the responsible
physician according to current practice and guidelines.
Patients were stratified into those with SDB (SDB group) (apnoea–hypopnoea index (AHI) of
o15 events?h-1) and those without SDB (no SDB group) (AHI ,15 events?h-1). An AHI of o15 events?h-1
indicated at least a moderate degree of SDB [16]. None of the included patients was treated with positive
airway pressure therapy within the first 12 weeks of AMI. In a subanalysis, the SDB group was stratified into
patients with predominantly central apnoeas and hypopnoeas (central sleep apnoea (CSA)) and those with
obstructive sleep apnoea (OSA). Another subgroup analysis was performed that only included patients with
RV involvement in myocardial infarction determined by analysis of late-enhancement CMR images.
Polysomnography
Polysomnography was performed in all subjects using standard polysomnographic techniques (Alice
System; Respironics, Pittsburgh, PA, USA) [6]. The sleep lab is located on the cardiology ward of the
hospital to which participants were admitted with AMI. The median times to baseline and follow-up
polysomnography after AMI were 3 days and 12 weeks, respectively. Respiratory efforts were measured with
the use of respiratory inductance plethysmography, and airflow was measured using a nasal pressure
cannula. Sleep stages, arousals, and apnoeas and hypopnoeas were determined according to the criteria of
2 DOI: 10.1183/09031936.00057014
25SLEEP | S. BUCHNER ET AL.
the American Academy of Sleep Medicine [17] by one experienced sleep technician blinded to the clinical
data. Apnoea was defined as a cessation of inspiratory airflow for o10 s. Hypopnea definition A was used
(o30% airflow reduction and o4% desaturation) [17]. AHI was defined as the number of apnoeas and
hypopnoeas per hour of sleep.
CMR acquisition protocol
CMR studies were performed using a clinical 1.5-Tesla scanner (Avanto; Siemens Healthcare Sector,
Erlangen, Germany) with a 32-channel phased-array receiver coil. Examination of ventricular function was
performed using acquisition of steady-state free precession cine images in standard short axis planes (slice
thickness 8 mm, inter-slice gap 2 mm, repetition time 60.06 s, echo time 1.16 s, flip angle 60u, field of view
3006300 mm, matrix size 1346192 pixels, readout pixel bandwidth 930 Hz per pixel). Delayed
enhancement images were obtained using a segmented inversion recovery steady-state free precession
technique (slice thickness 8.0 mm, inter-slice gap 2 mm, repetition time 1 RR interval, echo time 1.48 ms,
flip angle 60u, field of view 3606360 mm, matrix size 1286256) and acquired 10–15 min after injection
of gadolinium.
CMR image analysis
Evaluation of RV volume and RV ejection fraction (RVEF) was performed in the serial short axis slices
using commercially available software (Syngo Argus, version B15; Siemens Healthcare Sector). In order to
determine the volume of the right ventricle, endocardial contours of the right ventricle were traced
manually for each short axis slice, from the most basal slice at the level of the cardiac valves to the most
apical slice. These tracings were performed both at the end-diastolic and the end-systolic phases of the
ventricular contraction.
RV tricuspid annular plane systolic excursion (TAPSE) was determined in the four-chamber view by tracing
the point of insertion of the tricuspid valve onto the free wall of the right ventricle at end-diastole and end-
systole of the right ventricle. Both insertion points were then transferred to a single four-chamber view in
order to calculate the distance of these two points in respect to each other in centimetres. TAPSE can be
interpreted as a semi-quantitative evaluation of RVEF overall [18]. RV infarct size was assessed manually
using planimetry on short-axis slices, delineating hyper-enhanced areas.
The four-chamber view was also used to assess the area of the right and left atria. At the end of the diastolic
and systolic phase of the atrial contraction, the free-walls, the atrial septum and the tricuspid or mitral valve
were traced manually in order to determine the area of the atria. The adequate four-chamber view was
chosen based on the following criteria: 1) all boundaries of the atria were represented; and 2) the atrial and
ventricular septum were clearly depicted in their full extent on the selected slice. The diastolic and systolic
area of the right and left atria where then used to determine the right atrial fractional area change and the
left atrial fractional area change. Fractional area change represents the change in area during the contraction
of the atria as a percentage.
Statistical analysis
Data are expressed as mean¡SD, unless otherwise indicated. Differences between groups were assessed using
two-sided t-tests for continuous variables and Chi-squared tests for nominal variables. If the expected
counts were ,5, the Fisher’s exact test was used.
Simple linear regression models were performed to assess the impact of baseline AHI on RV volume and the
right atrial area. To control for potential confounders, such as age, sex, body mass index (BMI), smoking,
LV mass and LV end-systolic volume (LVESV), additional multivariable linear regression models were
calculated [19].
ANCOVA was used to compare changes in variables over time between the two patient groups. p-values for
between-group differences were adjusted for LVESV using linear regression analysis. All reported p-values
are two-sided, and a p-value of 0.05 was considered the threshold for statistical significance. Data entry and
calculations were made using SPSS 19.0 (IBM Corp., Armonk, NY, USA).
Results
Patient characteristics
A total of 252 consecutive patients with first-time AMI who received PCI were evaluated for eligibility to be
included in this study. 74 patients fulfilled the inclusion criteria and the exclusion criteria and were able to
give written informed consent. 20 patients had to be excluded from the analysis due to withdrawal of
consent for CMR or polysomnography, or because of an inability to analyse RV function. 54 patients were
DOI: 10.1183/09031936.00057014 3
26SLEEP | S. BUCHNER ET AL.
252 consecutive patients with first
AMI and PCI withinSLEEP | S. BUCHNER ET AL.
TABLE 1 Baseline patient characteristics
SDB No SDB p-value
Subjects n 29 25
Age years 55¡10 53¡10 0.563
BMI kg?m-2 30¡4 27¡3 0.002
Male 26 (90) 19 (76) 0.179
Hypertension 16 (55) 15 (60) 0.721
Diabetes mellitus 5 (17) 3 (12) 0.589
Hypercholesterolaemia 9 (31) 10 (40) 0.492
Smoking 19 (66) 22 (88) 0.054
STEMI 24 (83) 20 (80) 0.856
Target of primary coronary occlusion 0.363
LAD 14 (48) 9 (36)
Non-LAD 15 (52) 16 (64)
Grade 0 TIMI flow before PCI 25 (86) 19 (76) 0.340
Grade 3 TIMI flow after PCI 27 (93) 24 (96) 0.643
Killip classification 0.715
Class I 22 (76) 20 (80)
Class II 7 (24) 5 (20)
Heart rate beats?min-1 76¡17 71¡17 0.300
Systolic blood pressure mmHg 130¡20 129¡23 0.875
Diastolic blood pressure mmHg 78¡12 80¡13 0.580
LVEF after PCI % 45¡9 49¡8 0.057
LVESV after PCI mL 97¡31 77¡22 0.010
Peak CK U?L-1 2023¡1243 1475¡1271 0.123
Medication after PCI
Aspirin 29 (100) 25 (100) 1.0
ADP receptor inhibitors 29 (100) 25 (100) 1.0
b-blockers 27 (93) 25 (100) 0.181
ACE inhibitor/ARB 29 (100) 25 (100) 1.0
Statins 27 (93) 25 (100) 0.181
Medication at 12 weeks
Aspirin 26 (90) 24 (96) 0.384
ADP receptor inhibitors 22 (76) 22 (88) 0.261
b-blockers 25 (86) 22 (88) 0.848
ACE inhibitor/ARB 27 (93) 21 (84) 0.297
Statins 27 (93) 24 (96) 0.651
Data are presented as mean¡SD or n (%), unless otherwise stated. SDB: sleep disordered breathing; BMI: body mass index; STEMI: ST-segment
elevation myocardial infarction; LAD: left anterior descending; TIMI: thrombolysis in myocardial infarction; PCI: percutaneous coronary
intervention; LVEF: left ventricular ejection fraction; LVESV: left ventricular end-systolic volume; CK: creatinine kinase; ADP: adenosine
diphosphate; ACE: angiotensin-converting enzyme; ARB: angiotensin receptor blocker.
RV parameters
At baseline, RV end-diastolic volume (RVEDV) and RV end-systolic volume (RVESV) were similar in both
groups (table 3). RVEDV increased significantly in the SDB group over 12 weeks, while it remained
unchanged in the no SDB group (table 3 and fig. 2). The increase in RVEDV from baseline to 12 weeks was
significantly greater in the SDB compared with the no SDB group (table 3). This effect persisted after
accounting for LVESV or body surface area (table 3). There was no significant change in RVESV in either
group (table 3). RVEF and TAPSE were similar in the SDB and no SDB groups at baseline and after 12 weeks,
and changes from baseline to 12 weeks did not differ significantly between groups (table 3). The change in
RVEDV and RVEDV index from baseline to 12 weeks was similar in patients with OSA and CSA (table 4).
The analysis was repeated in a subset of patients with RV involvement of myocardial infarction (n524, 44%
of the study population), of whom 54% had SDB (n513) and 46% had no SDB (n511). As with the
primary analysis, RVEDV and RVESV were similar in the SDB group and the no SDB group (124¡37 mL
versus 137¡32 mL, p50.379, and 52¡23 mL versus 55¡19 mL, p50.668, respectively). In patients with
SDB, RVEDV increased significantly from baseline to 12 weeks (an increase of 14¡20 mL, p50.029); there
was no significant change in the no SDB group (-3¡20 mL, p50.640). In addition, there was no significant
difference in the infarct size of the right ventricle between the no SDB group and the SDB group
(6.7¡1.7 mL versus 5.8¡2.2 mL, p50.301).
DOI: 10.1183/09031936.00057014 5
28SLEEP | S. BUCHNER ET AL.
TABLE 2 Sleep characteristics
SDB No SDB p-value
Subjects n 29 25
AHI events?h-1 30 (21–40) 5 (3–7) ,0.001
Central AHI events?h-1 8 (5–22) 1 (0–3) 0.001
Oxygen desaturation index events?h-1 21 (12–31) 4 (2–6) ,0.001
Minimum oxygen saturation % 83¡7 87¡4 0.010
Sleep efficiency % 72¡13 70¡16 0.605
N3 % 14¡8 17¡8 0.137
REM sleep % 14¡6 18¡8 0.047
Data are presented as median (interquartile range) or mean¡ SD, unless otherwise stated. SDB: sleep disordered breathing; AHI: apnoea–
hypopnoea index; N3: slow wave sleep; REM: rapid eye movement.
Right atrial parameters
Right atrial diastolic area (RA-DA) increased in both patient groups during the 12 weeks following AMI
(fig. 3). The change in RA-DA from baseline to 12 weeks was similar in patients with OSA and CSA
(table 4). The increase in RA-DA was significantly larger in the SDB group compared with the no SDB
group (table 5 and fig. 3). This difference was attenuated after accounting for LVESV (p50.166). There was
TABLE 3 Changes in right ventricular morphological and functional parameters
SDB No SDB p-value
Subjects n 29 25
RVEDV mL
Baseline 129¡28 132¡28 0.716
12 weeks 143¡29 132¡31 0.200
D 14¡23 0¡17 0.020
p-value# 0.003 0.954
RVEDV index mL?m-2
Baseline 62¡13 68¡13 0.099
12 weeks 69¡14 68¡13 0.777
D 7¡11 0¡9 0.016
p-value# 0.004 0.861
RVESV mL
Baseline 56¡21 53¡16 0.648
12 weeks 58¡21 51¡15 0.162
D 3¡14 -2¡11 0.179
p-value# 0.276 0.411
RVESV index mL?m-2
Baseline 27¡10 28¡8 0.747
12 weeks 28¡10 27¡7 0.493
D 1¡7 -1¡6 0.163
p-value# 0.280 0.367
RVEF %
Baseline 58¡10 60¡8 0.466
12 weeks 59¡9 61¡8 0.520
D 2¡5 1¡5 0.766
p-value# 0.081 0.248
TAPSE cm
Baseline 2.1¡0.5 2.2¡0.4 0.234
12 weeks 2.2¡0.3 2.2¡0.4 0.878
D 0.2¡0.4 0.0¡0.4 0.150
p-value# 0.040 0.992
Data are presented as mean¡ SD, unless otherwise stated. SDB: sleep disordered breathing; RVEDV: right
ventricular end-diastolic volume; RVESV: right ventricular end-systolic volume; RVEF: right ventricular
ejection fraction; TAPSE: tricuspid annular plane systolic excursion. #: baseline versus 12 weeks.
6 DOI: 10.1183/09031936.00057014
29SLEEP | S. BUCHNER ET AL.
20 p=0.020 SDB
Change from baseline to 12 weeks mL
No SDB
15
10
p=0.179
5
0
-5
RVEDV RVESV
FIGURE 2 Change in right ventricular volumes. Data are presented as mean¡SE. SDB: sleep disordered breathing;
RVEDV: right ventricular end-diastolic volume; RVESV: right ventricular end-systolic volume.
no significant difference between groups in changes in right atrial systolic area (RA-SA) or right atrial
fractional area.
Linear regression models
In the unadjusted linear regression analysis, AHI was significantly associated with RVEDV and RA-SA, but not
RVESV and RA-DA (table 6). In the fully adjusted multivariable linear regression analysis, accounting for age,
sex, smoking, BMI, LVESV and LV mass, AHI was still significantly associated with RVEDV (p50.041). AHI
was not significantly associated with RVESV, RA-DA and RA-SA in the fully adjusted model.
Discussion
The current study provides novel insights into right heart remodelling in patients with SDB early after AMI.
The results show that patients with AMI and SDB had a greater increase in RVEDV within the 12 weeks
following AMI compared with those without SDB. In addition, RA-DA increased to a significantly greater
extent in AMI patients with SDB versus patients without SDB over the 12-week follow-up period. Measures
of RV function were similar and did not change over 12-week follow-up in AMI patients with or without
SDB. OSA and CSA are associated with similar changes of RV and atrial morphological parameters in the
early phase after AMI.
The finding that RVEDV increases in AMI patients with SDB is supported by two recent interventional
studies, both of which also used CMR to assess RV remodelling in patients with SDB and non-cardiac
disease [14, 15]. These studies showed that treatment of SDB with continuous positive airway pressure
decreased RV volume, suggesting that SDB has a negative influence on the right ventricle even in the
absence of other cardiovascular conditions. The magnitude of the decrease in RVEDV index after treatment
of SDB in these interventional studies (10 mL?m-2 in [14] and 8 mL?m-2 in [15]) was comparable to the
TABLE 4 Changes in right ventricular and atrial morphological parameters in obstructive sleep
apnoea (OSA) and central sleep apnoea (CSA)
OSA CSA p-value
Subjects n 15 14
RVEDV mL 17¡22 11¡3.6 0.492
RVEDV index mL?m-2 8¡11 5¡12 0.561
RVESV mL 4¡14 1¡15 0.583
RVESV index mL?m-2 2¡3.6 1¡8 0.634
RA-DA cm2 3.1¡3.0 2.7¡4.6 0.807
RA-SA cm2 1.7¡2.2 2.3¡3.7 0.572
Data are presented as mean¡ SD, unless otherwise stated. RVEDV: right ventricular end-diastolic volume;
RVESV: right ventricular end-systolic volume; RA-DA: right atrial diastolic area; RA-SA: right atrial systolic
area.
DOI: 10.1183/09031936.00057014 7
30SLEEP | S. BUCHNER ET AL.
4 p=0.038 SDB
Change from baseline to 12 weeks cm2
No SDB
3 p=0.175
2
1
0
RA-DA RA-SA
FIGURE 3 Change in right atrial area. Data are presented as mean¡SE. SDB: sleep disordered breathing; RA-DA: right
atrial diastolic area; RA-SA: right atrial systolic area.
increase in RVEDV index seen in patients with SDB after AMI in the present study (7 mL?m-2). To our
knowledge, this is the first study showing changes in the right ventricle after AMI in patients with SDB.
The question arises as to whether changes in RV volume are directly caused by SDB or by another factor,
such as LV function. However, the increase of RVEDV from baseline to 12 weeks remained significantly
greater in AMI patients with SDB versus patients without SDB after accounting for LVESV, a marker of LV
function. This is reinforced by the fact that, in accordance with previous studies [20, 21], ZORNOFF et al. [1]
also concluded that RV dysfunction is largely independent of LV function. In addition, the significant
association of AHI and RVEDV was robust after accounting for age, sex, smoking, BMI, LVESV and LV
mass. Furthermore, because previous studies have suggested that RV dysfunction might be more susceptible
to the influence of the location and magnitude of myocardial infarction than to the extent of LV
dysfunction [1, 22], we conducted an analysis based on myocardial infarct location in both patient groups.
This showed that RV involvement was seen in both the SDB and the no SDB groups across a range of infarct
locations. Secondly, we conducted a subanalysis of patients with proven RV involvement on CMR, which
showed similar results to the main analysis of all patients. There was also no significant difference in terms
of the target of primary coronary occlusion between both groups. In summary, this suggests that
enlargement of the right ventricle after AMI in SDB patients is independent of LV function, RV involvement
TABLE 5 Changes in right atrial morphological and functional parameters
SDB No SDB p-value
Subjects n 27 25
RA-DA cm2
Baseline 25.3¡4.1 25.5¡3.6 0.877
12 weeks 28.1¡4.4 26.5¡4.1 0.194
D 2.9¡3.7 1.0¡2.4 0.038
p-value# 0.001 0.048
RA-SA cm2
Baseline 18.3¡3.6 17.6¡2.7 0.437
12 weeks 20.0¡4.1 18.5¡3.0 0.160
D 2.0¡3.0 0.9¡2.4 0.175
p-value# 0.002 0.063
RA-FAC %
Baseline 27.4¡10.7 30.7¡7.9 0.214
12 weeks 29.1¡8.4 30.0¡6.0 0.657
D 0.8¡11.8 -0.8¡8.1 0.577
p-value# 0.721 0.641
Data are presented as mean¡ SD, unless otherwise stated. SDB: sleep disordered breathing; RA-DA: right
atrial diastolic area; RA-SA: right atrial systolic area; RA-FAC: right atrial fractional area change. #: baseline
versus 12 weeks.
8 DOI: 10.1183/09031936.00057014
31SLEEP | S. BUCHNER ET AL.
TABLE 6 The relationship between apnoea–hypopnoea index (AHI) and the change in right ventricular volumes and right atrial
areas: linear regression models
Variables Unadjusted Adjusted#
Dependent Independent B-coefficient (95% CI) p-value B-coefficient (95% CI) p-value
RVEDV AHI 0.324 (0.035–0.612) 0.028 0.315 (0.013–0.617) 0.041
RVESV AHI 0.114 (-0.063–0.292) 0.202 0.123 (-0.067–0.313) 0.200
RA-DA AHI 0.041 (-0.005–0.087) 0.082 -0.006 (-0.054–0.041) 0.790
RA-SA AHI 0.038 (0.000–0.077) 0.049 0.017 (-0.023–0.054) 0.398
RVEDV: right ventricular end-diastolic volume; RVESV: right ventricular end-systolic volume; RA-DA: right atrial diastolic area; RA-SA: right atrial
systolic area. #: adjusted for age, sex, body mass index, smoking, left ventricular end-systolic volume and left ventricular mass.
in AMI and differing sites of primary coronary artery occlusion. The results of this study cannot definitely
prove that SDB is the only cause of an increase in RV volume. However, taking into account data from
previous interventional studies [14, 15], our data provide good evidence to support the conclusion that SDB
contributes to the observed effects.
In a similar manner to the changes in RVEDV, there was a significantly greater increase in RA-DA in AMI
patients with SDB compared to those without SDB. This finding expands on the results of previous studies
and has not been assessed previously.
RVEF, as a measure of RV contractility, was similar in those with and without SDB and remained
unchanged in both groups over the follow-up period. This is in line with previous research showing no
significant changes in RVEF after 12 weeks [14], or 6 and 12 months [15], of continuous positive airway
pressure therapy in patients with SDB and without known heart disease.
LA-SA was significantly increased in AMI patients with SDB, while left atrial fractional area change was
impaired in this group, suggesting that contractility of the left atrium is lower in patients with SDV versus
patients without SDB. Such data complement previous studies showing an increased left atrial area in
patients with SDB and without known cardiac disease [23, 24].
There are a number of pathogenic mechanisms that might explain the results observed in this study.
Patients with SDB are exposed to chronic intermittent hypoxia, leading to pulmonary hypertension due to
hypoxic vasoconstriction [10–12, 25] and reduced pulmonary levels of nitric oxide [13], in turn resulting in
increased afterload of the right ventricle. Mild levels of pulmonary hypertension have been reported
to occur in up to 20% of patients with OSA without pre-existing pulmonary or cardiovascular conditions
[26, 27]. Increased preload of the right ventricle is caused by elevated negative intrathoracic pressure
occurring during exaggerated inspirational efforts due to obstructive apnoeas; this leads to increased venous
return, volume overload and subsequent distension of the right ventricle [28]. While the mechanism of
pulmonary hypertension due to intermittent hypoxia in OSA may be extrapolated to some extent to CSA,
the mechanism of increased RV preload due to negative intrathoracic pressure swings is a phenomenon of
obstructive apnoea. Nevertheless, our data do not support the idea that OSA causes greater RV structural
changes than CSA. Furthermore, myocardial infarction may itself cause RV dysfunction. Impaired RV
function after AMI is often associated with LV dysfunction, which is common after AMI [29].
LV dysfunction may increase left atrial pressure leading to left atrial enlargement [23]. RV function is highly
dependent on afterload, for which left atrial pressure is a widely accepted indicator [1, 30]. This fact is
supported by the current results, which show RV enlargement in the presence of increased left atrial area.
The results of this study support the clinically important evidence that SDB may have specific adverse effects
in patients in the early stages following AMI, not only on the left heart but also on the right heart. Increased
focus on such deleterious changes could help to improve strategies for the prevention of impaired long-term
cardiovascular function after AMI.
This study does have some limitations. Both CSA and OSA can be temporarily worsened during the acute
phase of AMI [31] and improvement of CSA and OSA in the early stages following AMI is associated with
an improvement in cardiac function [6]. The observational study design cannot account for the change of
SDB burden overtime in the early stages following AMI and cannot prove causal relationships (between
CSA and OSA and RV remodelling, for example). Larger interventional trials are therefore required to test
whether the observed effects can be partially reversed with CSA and OSA treatment in AMI patients.
DOI: 10.1183/09031936.00057014 9
32Sie können auch lesen