Halbjahresbericht 2014 Interim Report 2014 - Innovation for success
←
→
Transkription von Seiteninhalten
Wenn Ihr Browser die Seite nicht korrekt rendert, bitte, lesen Sie den Inhalt der Seite unten
Halbjahresbericht 2014
                Interim Report 2014

Innovation for success
«Wir unterstützen unsere Kunden weltweit dabei technologisch
hochstehende Lösungen erfolgreich zu implementieren.»

“We support our customers worldwide in successfully
implementing high-tech solutions.“
Cicor | Geschäftsbericht 2014 | Kernaussagen
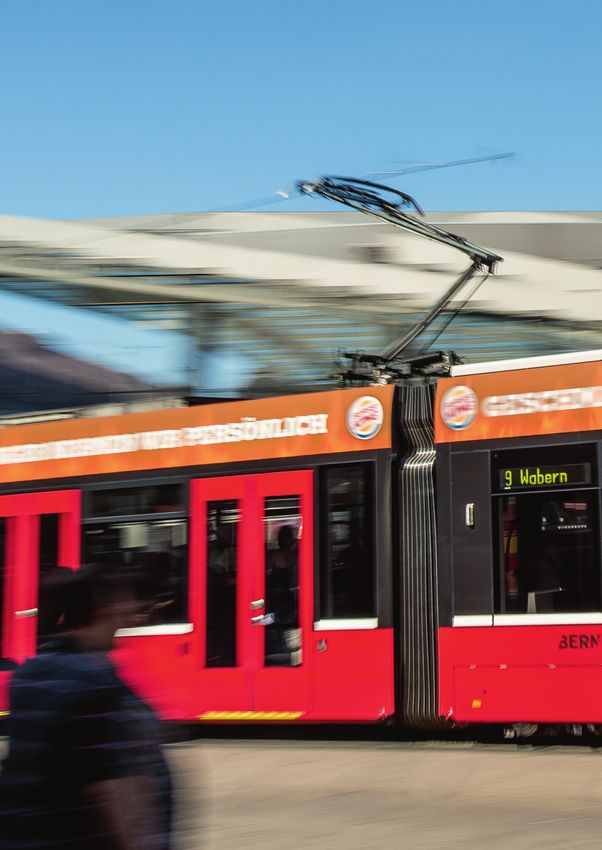
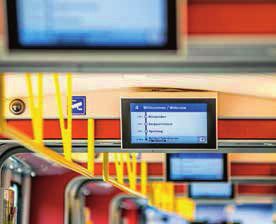
Transport – Kommunikation zwischen
Zentrale und Leitstelle, Fahrern und Fahrzeugen
Die Trapeze Group versorgt die öffentlichen und privaten
Verkehrsunternehmen mit Komplettlösungen wie dem
Intermodal Transport Control System (ITCS). Das ITCS organi-
siert die gesamte Kommunikation und bietet den Disponenten
stets einen Überblick über die aktuelle Situation auf dem Netz.
Dies betrifft sowohl die Sprache (Funkgespräche) als auch eine
Vielzahl von Daten. Auch können sich Fahrzeuge an Ampel-
kreuzungen anmelden, um durch eine grüne Welle kürzere
Fahrzeiten und eine höhere Pünktlichkeit zu ermöglichen.
Im Rahmen einer langfristigen Zusammenarbeit übernimmt die
Cicor Gruppe verschiedene Dienstleistungen für die Produktion
Intermodal Transport Control System (ITCS) der Steuergeräte, welche in Betriebsleitsystemen weltweit im
Einsatz sind. Als Outsourcing-Partner ist Cicor für die Kompo-
nenten-Beschaffung, die Herstellung der elektronischen Steu-
erung, die Leiterplattenbestückung, die Konfektionierung sowie
für das komplette Box-Building und den After Sales Service
verantwortlich.
Transport – Communication between head
quarters and control centers, drivers and vehicles
The Trapeze Group provides public and private transport compa-
nies with comprehensive solutions such as the Intermodal Transport
Control System (ITCS). The ITCS organizes all communication and
keeps dispatchers up to date on the current network situation at
all times. This includes verbal communication (radio) as well as an
abundance of different data. Vehicles can also identify themselves
at junctions with traffic lights so as to be able to take advantage of
synchronized green lights and thereby shorten journey times and
increase punctuality.
As part of a long-term collaboration, the Cicor Group is taking over
production services for various control units that are used in opera-
tional control systems worldwide. As the outsourcing partner, Cicor
is responsible for the procurement of components, the manufacture
of electronic controls, printed circuit board assembly, final assembly,
the entire box-building process and the after-sales service.Cicor | Geschäftsbericht 2014 | Kernaussagen Inhalt 4 Kennzahlen 5 Bericht des Präsidenten und des CEO 15 Financial Report 2014 24 Agenda 25 Adressen Contents 10 Key figures 11 Report of the Chairman and CEO 15 Financial Report 2014 24 Agenda 25 Addresses
Halbjahresbericht 2014

                         3
Cicor | Halbjahresbericht 2014 | Auf einen Blick
Kennzahlen
in CHF 1 000, falls nicht anders angegeben 30.6.2014 in % 30.6.2013 in %
Nettoerlös aus Lieferungen und Leistungen 102 873 100.0 94 251 100.0
Veränderung gegenüber Vorjahr (%) 9.1 11.7
Ergebnis vor Abschreibungen und Amortisationen (EBITDA) 8 482 8.2 7 180 7.6
Veränderung gegenüber Vorjahr (%) 18.1 10.8
Operatives Ergebnis (EBIT) 3 562 3.5 2 853 3.0
Veränderung gegenüber Vorjahr (%) 24.9 13.0
Ergebnis vor Steuern (EBT) 2 433 2.4 1 875 2.0
Veränderung gegenüber Vorjahr (%) 29.8 6.1
Gewinn 1 779 1.7 1 197 1.3
Veränderung gegenüber Vorjahr (%) 48.6 –10.9
Ergebnis je Aktie (in CHF) 0.60 0.42
Beschäftigte (Stichtag) 1 954 1 686
Investitionen in Sachanlagen 3 512 7 150
in % des Nettoerlöses 3.4 % 7.6 %
Nettoerlös nach Märkten Nettoerlös nach Ländern
5 % (8 %) 9 % (10 %) 1 % (3 %)
7 % (4 %)
12 % (16 %)
8 % (11 %)
19 % (9 %)
37 % (45 %)
10 % (8 %)
2014 (2013) 2014 (2013)
27 % (20 %)
29 % (27 %) 36 % (39 %)
Luft-/Raumfahrt & Verteidigung Automobil & Transport Schweiz Nordamerika
Kommunikation Uhren & Konsumgüter Übriges Europa Übrige Länder
Industrie Andere Asien
Medizin
in CHF 1 000, falls nicht anders angegeben 30.6.2014 in % 31.12.2013 in %
Anlagevermögen 134 409 57.9 135 777 60.0
Umlaufvermögen 97 877 42.1 90 522 40.0
Total Aktiven 232 286 100.0 226 299 100.0
Eigenkapital 127 226 54.8 125 853 55.6
Finanzielle Verbindlichkeiten 44 047 19.0 43 590 19.3
Zahlungsmittel und Zahlungsmitteläquivalente 11 070 4.8 15 369 6.8
Nettoverschuldung 32 977 14.2 28 221 12.5
Gearing ratio (Nettoverschuldung in % des Eigenkapitals) 25.9 % 22.4 %
Vorräte 44 971 19.4 40 893 18.1
Forderungen aus Lieferungen und Leistungen 36 567 15.7 29 553 13.1
Verbindlichkeiten aus Lieferungen und Leistungen –24 675 –10.6 –21 037 –9.3
Nettoumlaufvermögen 56 863 24.5 49 409 21.8
4Cicor | Halbjahresbericht 2014
Guter Start ins Geschäftsjahr 2014 – Auftragseingang
und Umsatz über CHF 100 Mio. im ersten Halbjahr
Die Cicor Gruppe entwickelte sich auch im ersten Halbjahr 2014 weiter positiv und übertraf Auftragseingang,
Umsatz und Gewinn des ersten Halbjahres 2013 zum Teil deutlich. Die Gruppe ist seit Mitte 2012 kontinuierlich
gewachsen und hat sich Semester für Semester verbessert. Der Umsatzzuwachs im ersten Semester 2014 liegt
vor allem dank dem Gewinn von Marktanteilen in den Sektoren Medizin, Automobil und Transport sowie Indus
trie über dem Marktwachstum. Während das Geschäft der ES Division im ersten Halbjahr 2014 in allen Regi
onen wuchs, war die AMS Division mit einer weiterhin zurückhaltenden Nachfrage konfrontiert und hatte
einen schwierigen Jahresbeginn. Basierend auf einer verbesserten Entwicklung des Geschäftsverlaufes in der
AMS Division in der zweiten Jahreshälfte und der Fortsetzung des Wachstumskurses in der ES Division
rechnet die Cicor Gruppe damit, den positiven Geschäftsverlauf voraussichtlich auch in der zweiten Jahres
hälfte 2014 fortsetzen zu können.
Mit der neuen Organisation der Gruppe per 1. Januar 2014 und
der schlankeren Struktur wurde eine Basis geschaffen, die einen
optimistischen Ausblick erlaubt. Insbesondere die durch die Zu-
sammenlegung der ehemaligen PCB und ME Divisionen geschaf-
fenen Fertigungsmöglichkeiten decken ein weiteres Kundenbe-
Im ersten Halbjahr 2014 erzielt die Cicor Gruppe einen Umsatz dürfnis ab. Mit der Kombination aus PCB-Herstellung in Boudry,
von CHF 102.9 Mio., was einem Umsatzwachstum von 9.1 % ge- Schweiz und Mikromontage in Radeberg, Deutschland konnten
genüber dem ersten Halbjahr 2013 entspricht (währungsberei- bereits erste Aufträge gewonnen werden.
nigt 11.3%). Dies ist vor allem auf die im ersten Semester sehr
starke positive Entwicklung der ES Division zurückzuführen, der Cicor setzt in der Marktbearbeitung auf Kundennähe und legt
es gelang, das Geschäft mit bestehenden Kunden in Europa und verstärkt das Gewicht auf die Leistungserbringung aus einer
in Asien weiter auszubauen und neue Kunden von den vorhan- Hand, durch Dienstleistungen wie z.B. Engineering, Product De-
denen Fähigkeiten zu überzeugen. Im Gegensatz dazu hatte die velopment und Testing. Diese Art der Marktpflege ist umso wich-
AMS Division mit einem schwierigen ersten Halbjahr und einem tiger, als der Wettbewerbsdruck durch zahlreiche andere Out-
Umsatzrückgang zu kämpfen. sourcing-Anbieter stark ist. Von diesen meistens auf einzelne
Technologien spezialisierten Anbietern kann sich die Cicor Gruppe
Der Umsatzrückgang in der AMS Division begründet sich einer- durch ihr Technologieportfolio und das Anbieten von Gesamt-
seits durch das schwierige Marktumfeld im Euroraum in Bezug lösungen abheben. Innovation ist dabei ein wichtiger Wachs-
auf die Segmente Luft-/Raumfahrt und Verteidigung sowie den tumstreiber und ein Entscheidungskriterium beim Kunden.
Kernenergiesektor und andererseits durch den Wegfall des Um-
satzes aus der Fertigung eines End-of-Life-Produktes. Die AMS Die tieferen Resultate der AMS Division konnten dank den
Division liess sich aber trotz widrigen Umständen nicht vom Ergebnissen der ES Division und dank einer Effizienzsteigerung
eingeschlagenen Weg abbringen und nahm in den ersten sechs im Corporate Bereich kompensiert werden. Der EBIT der Gruppe
Monaten 2014 gezielte Anpassungen innerhalb der Organisation betrug im ersten Halbjahr 2014 CHF 3.6 Mio., was im Vergleich
vor, die sich positiv auf die Ergebnisse auswirken werden. zum EBIT des ersten Halbjahres 2013 von CHF 2.9 Mio. einer
Steigerung von 24.9 % entspricht. Die EBIT-Profitabilität der
Der Auftragseingang der Cicor Gruppe wuchs von CHF 99.7 Mio. Cicor Gruppe wurde verbessert und betrug 3.5 % (1. Halbjahr
im ersten Halbjahr 2013 um 0.4 % auf CHF 100.2 Mio. im ersten 2013: 3.0 %). Mit einem in der Berichtsperiode erzielten EBITDA
Halbjahr 2014 (zu konstanten Wechselkursen: + 2.2%). Der Auf- von CHF 8.5 Mio. betrug das Wachstum gegenüber dem ersten
tragsbestand per 30. Juni 2014 ist mit CHF 119.7 Mio. weiterhin Halbjahr 2013 gute 18.1 % und die EBITDA-Marge konnte auf
sehr gut. 8.2 % im ersten Halbjahr 2014 erhöht werden.
5Cicor | Halbjahresbericht 2014
Die erzielte Margenverbesserung der Cicor Gruppe ist das direk-
te Resultat der operativen Leistung. Die Kosteneinsparungen
und Effizienzverbesserungen aufgrund der am 1. Januar 2014
erfolgten Konsolidierung auf zwei Divisionen werden erst in der
zweiten Jahreshälfte 2014 realisiert. Anstatt aber nur kurzfristig
und als Einmaleffekt in die Ergebnisse einzufliessen, sollen die-
se freigewordenen Ressourcen gezielt in die weitere Stärkung Advanced Microelectronics & Substrates:
der Organisation reinvestiert werden, wo sie die nachhaltige Herausforderndes erstes Halbjahr
operative Leistungsverbesserung unterstützen werden.
Die AMS Division erzielte im ersten Halbjahr 2014 einen Umsatz
Der Reingewinn für das erste Halbjahr schloss 48.6 % über Vor- von CHF 27.9 Mio. (1. Halbjahr 2013: CHF 31.4 Mio.) und sah sich
jahr bei CHF 1.8 Mio. (1. Halbjahr 2013: CHF 1.2 Mio.). Der Gewinn mit einem Umsatzrückgang von 11.3 % konfrontiert. Der Um-
pro Aktie stieg auf CHF 0.60 (1. Halbjahr 2013: CHF 0.42). satzrückgang war einerseits durch das Auslaufen eines Rah-
menvertrages mit einem Grosskunden in der Mikroelektronik
Nach zwei Jahren, die von hohen Investitionen geprägt waren, bedingt, dessen Produkt die End-of-Life Phase erreichte und
reduzierten sich die getätigten Investitionen in Sachanlagen im noch nicht mit einem Nachfolgeprodukt kompensiert werden
ersten Halbjahr 2014 deutlich auf CHF 3.5 Mio. (1. Halbjahr 2013: konnte, und andererseits durch das weiterhin schwierige Markt-
CHF 7.2 Mio.). Die Investitionen dienten dem Ersatz und der umfeld im Segment Luft-/Raumfahrt und Verteidigung sowie
Modernisierung von Produktionsanlagen, die Innovationen im den anhaltenden Investitionsstopp im Kernenergiesektor.
Produktionsprozess ermöglichen. Den Investitionen standen
Abschreibungen und Amortisationen in Höhe von CHF 4.9 Mio. Die negative Umsatzentwicklung im ersten Halbjahr 2014 war
gegenüber (1. Halbjahr 2013: CHF 4.3 Mio.). Für das Gesamtjahr voraussehbar und kam daher nicht überraschend. Mit der klaren
2014 werden die Investitionen voraussichtlich ebenfalls unter Intention, die neu geschaffene AMS Division zur rentabelsten
dem Vorjahr liegen. Division der Cicor Gruppe zu entwickeln, wurde nichtsdestotrotz
im ersten Halbjahr 2014 in den AMS Gesellschaften eine Reihe
Die Konzernbilanz war auch im ersten Halbjahr sehr solide. Bei von Anpassungen in den Bereichen Organisation, Produktion
einem Eigenkapital von CHF 127 Mio. und einer Bilanzsumme von und Logistik aufgegleist. Zum Beispiel erlaubt die neue Organi-
CHF 232 Mio. lag die Eigenkapitalquote bei 54.8 %. Die Netto- sation der beiden Werke im Dünnschichtbereich, Ulm in Deutsch-
verschuldung per 30. Juni 2014 betrug CHF 33.0 Mio. (1. Halbjahr land und Wangs in der Schweiz, unter der Leitung eines Ge-
2013: CHF 28.4 Mio.; per 31. Dezember 2013: CHF 28.2 Mio.). schäftsführers ein besseres Ausschöpfen der Synergien. Auf
Die konsolidierte Geldflussrechnung per 30. Juni 2014 zeigte diese Weise ist eine einheitliche Steuerung und eine noch en-
einen Nettogeldfluss von CHF –4.3 Mio. (1. Halbjahr 2013: gere Zusammenarbeit gewährleistet mit dem Ziel, maximalen
CHF –2.0 Mio.). Das Net Working Capital stieg im ersten Halbjahr Nutzen aus dem vorhandenen Know-how und Potential im
2014 von CHF 49.4 Mio. per Ende 2013 auf CHF 56.9 Mio. an. Dünnschichtbereich zu ziehen.
6Cicor | Halbjahresbericht 2014
Electronic Solutions:
Gute Wachstumsdynamik und konstante Erträge
Die ES Division konnte in der Berichtsperiode den Umsatz deut-
lich steigern und das Betriebsergebnis im Vergleich zur Vorjah-
Nur dank einem strikten Kostenmanagement konnte im ersten resperiode übertreffen. Dank den starken Nischenpositionen,
Halbjahr 2014 ein EBIT von CHF –0.1 Mio. erzielt werden. Dieser der intensiven Marktbearbeitung und den erfolgreich umgesetz-
lag aber letztlich dennoch deutlich unter dem EBIT des ersten ten Wachstumsprojekten gewannen die Gesellschaften der ES
Halbjahres 2013 von CHF 1.0 Mio.. Die AMS Division rechnet für Division weitere Marktanteile und profitierten von der hohen
das zweite Halbjahr 2014 mit einer positiven Umsatzentwicklung Nachfrage. Ausschlaggebend für dieses erfolgreiche und profi-
und einem verbesserten EBIT – insbesondere aus der Uhren- table Wachstum waren unter anderem Marktanteilsgewinne bei
und Telekommunikationsindustrie werden erfreulichere Ge- global tätigen Kunden sowie der hohe Anteil von absatzstarken
schäftsentwicklungen erwartet. Kundenprojekten in der Medizinal-, Industrie- und Automotive-
Sparte.
Die nächsten Schritte für die AMS Division bestehen nun darin,
die im ersten Halbjahr 2014 eingeleitete Zusammenlegung der Die Umsatzzunahme von 19.3 % auf CHF 75.0 Mio. (1. Halbjahr
ehemaligen PCB und ME Division zu Ende zu führen und die 2013: CHF 62.9 Mio.) reflektiert die starke Marktstellung auf-
Kundenbasis weiter auszubauen. Gerade der Technologiebereich grund der qualitativ überzeugenden Leistung der Division. Zur
Dünnschicht in Kombination mit der PCB-Technologie bietet guten Entwicklung des Umsatzes trugen sowohl die europäi-
ausreichend Potential dafür. Aber auch die Dickschichttechno- schen wie auch die asiatischen Standorte bei. Auch der Schwei-
logie und Mikromontage bieten als Produktionsschritt nach der zer Standort in Bronschhofen (Gemeinde Wil/SG), steigerte sich
Herstellung des PCBs grosse Wachstumschancen, welche es zu im Vergleich zum ersten Halbjahr 2013 stark und die dort ange-
nutzen gilt. Die Strukturverschlankung und vertikale Integration botenen Dienstleistungen wie Engineering und Produktentwick-
der Wertschöpfung ermöglichen für den Kunden ein besseres lung waren rege gefragt.
und breiteres Leistungsspektrum aus einer Hand.
Hauptsächlich gestützt auf die Standorte in Indonesien und Viet-
Mit ihrem gesamten Know-how aus der Leiterplattenherstel- nam blieb auch die Wachstumsrate in Asien im ersten Semes-
lung, der Dünnschichttechnologie und der Mikroelektronik ist die ter 2014 auf einem hohen Niveau. Nach einer eher verhaltenen
AMS Division bestens positioniert, um die Produkte ihrer Kunden Geschäftsentwicklung in China seit Markteintritt im Jahr 2011
noch kleiner, noch dünner und noch leistungsfähiger zu machen. konnte die lokale Gesellschaft im ersten Halbjahr 2014 zwei
Die erfolgreiche Kombination der vorhandenen Technologien der Kunden mit sehr interessanten Volumen gewinnen, womit nun
ehemaligen PCB und ME Divisionen und die daraus entstehen- die Basis für eine positive Entwicklung im chinesischen Markt
den Möglichkeiten für das Insourcing einer kompletten Ferti- gelegt ist. Der Schlüssel zum weiteren Wachstum in der Region
gung – nämlich von der Herstellung des Substrates bis zur Asien wird auch in Zukunft in der Investition in technologische
Mikromontage und Endprüfung – werden es der AMS Division Differenzierung und der Erschliessung der aufstrebenden Märkte
ermöglichen, verstärkt positiv zum Gruppenergebnis beizutragen. liegen.
7Cicor | Halbjahresbericht 2014
Weitere Umsatz und
Der EBIT im ersten Halbjahr 2014 betrug CHF 4.4 Mio. (1. Halbjahr Ergebnisverbesserungen geplant
2013: CHF 3.1 Mio.) und die EBIT-Marge erreichte einen guten Wert
von 5.9 % (1. Halbjahr 2013: 4.9 %). Das Wachstum und die gute Im ersten Halbjahr 2014 hat Cicor weitere Fortschritte gemacht.
Auslastung der Maschinen wirkte sich positiv auf das Ergebnis Seit Mitte 2012 entwickelt sich Cicor besser als der Markt und ist
und die Marge der Division aus. Anderseits gelang es der Division gut aufgestellt, um Umsatz und Gewinn auch im Gesamtjahr 2014
auch, mit innovativen Fertigungslösungen und Dienstleistungen in einem stabilen wirtschaftlichen Umfeld erneut zu steigern.
Kundenprojekte mit höheren Margen zu akquirieren.
Im Namen des Verwaltungsrates und der Geschäftsleitung
Die Geschäfte der ES Division dürften sich für das zweite danken wir allen Mitarbeitenden für ihren Einsatz und ihr Enga-
Semester 2014 in der Grössenordnung der ersten Jahreshälfte gement. Den Kunden und Geschäftspartnern danken wir für ihre
weiterentwickeln. Die strategische Geschäftsentwicklung mit Treue und wertvolle Zusammenarbeit. Ihnen, geschätzte Aktio-
internationalen Kunden, die in allen Regionen bedient werden, närinnen und Aktionäre, danken wir für Ihr Vertrauen, das Sie
wird dabei speziell im Fokus stehen. uns stets entgegenbringen.
Personelle Wechsel
Im ersten Halbjahr 2014 gab es keine Veränderungen in der Cicor
Gruppenleitung. An der Generalversammlung vom 24. April 2014
wurden alle Verwaltungsräte wiedergewählt und somit blieb das Antoine Kohler Patric Schoch
Gremium in der Berichtsperiode unverändert. Präsident des Verwaltungsrates Acting CEO/CFO
8Interim Report 2014
9Cicor | Interim Report 2014 | At a glance
Key figures
in CHF 1 000 unless otherwise specified 30.6.2014 in % 30.6.2013 in %
Net sales 102 873 100.0 94 251 100.0
Change compared to previous year (%) 9.1 11.7
Profit before depreciation and amortization (EBITDA) 8 482 8.2 7 180 7.6
Change compared to previous year (%) 18.1 10.8
Operating profit (EBIT) 3 562 3.5 2 853 3.0
Change compared to previous year (%) 24.9 13.0
Profit before taxes (EBT) 2 433 2.4 1 875 2.0
Change compared to previous year (%) 29.8 6.1
Net profit 1 779 1.7 1 197 1.3
Change compared to previous year (%) 48.6 –10.9
Earnings per share (in CHF) 0.60 0.42
Number of employees (FTEs at end of period) 1 954 1 686
Capex in tangible assets 3 512 7 150
in % of sales 3.4 % 7.6 %
Sales by industry Sales by destination
5 % (8 %) 9 % (10 %) 1 % (3 %)
7 % (4 %)
12 % (16 %)
8 % (11 %)
19 % (9 %)
37 % (45 %)
10 % (8 %)
2014 (2013) 2014 (2013)
27 % (20 %)
29 % (27 %) 36 % (39 %)
Aerospace & defence Automotive & transport Switzerland North America
Communication Watches & consumer Rest of Europe Other
Industrial Other Asia
Medical
in CHF 1 000 unless otherwise specified 30.6.2014 in % 31.12.2013 in %
Noncurrent assets 134 409 57.9 135 777 60.0
Current assets 97 877 42.1 90 522 40.0
Total assets 232 286 100.0 226 299 100.0
Equity 127 226 54.8 125 853 55.6
Financial liabilities 44 047 19.0 43 590 19.3
Cash and cash equivalents 11 070 4.8 15 369 6.8
Net debt 32 977 14.2 28 221 12.5
Gearing ratio (net debt in % of equity) 25.9 % 22.4 %
Inventories 44 971 19.4 40 893 18.1
Trade receivables 36 567 15.7 29 553 13.1
Trade payables –24 675 –10.6 –21 037 –9.3
Net working capital 56 863 24.5 49 409 21.8
10Cicor | Interim Report 2014
Good start into 2014 – Order intake and sales of more
than CHF 100 million in the first half of the year
The Cicor Group continued its positive performance in the first six months of 2014, exceeding order intake,
sales and net profit figures of the first half of 2013 – in some cases by a substantial amount. The Group has
grown steadily since the middle of 2012, consistently posting better results every semester. The increase in
sales recorded in the first half of 2014 can be attributed primarily to the gain in market share in the medical,
automotive, transport and industrial sectors. While the Electronic Solutions (ES) Division grew in all regions
during the first half of the year, the Advanced Microelectronics & Substrates (AMS) Division suffered from on
going subdued demand, resulting in a difficult start into the year. Based on the projected business improve
ment for the AMS Division and the continuation of the ES Division's growth course, the Cicor Group expects
the positive performance of the first half of the year to continue into the second half.
In its market development efforts, Cicor emphasizes the proxim-
ity to its customers and is increasingly placing its focus on the
In the first half of 2014, the Cicor Group posted sales of provision of services from a single source, primarily via services
CHF 102.9 million, an increase of 9.1 % over the prior-year pe- such as engineering, product development and testing. Ap-
riod (adjusted for currency effects: +11.3%). This growth was proaching market development in this way is becoming all the
mainly driven by the very positive performance of the ES Divi- more important, given that competition is intensifying due to
sion, which was able to further expand its business with existing increased pressure from numerous other outsourcing providers.
customers in Europe and Asia, as well as win over new custom- However, as these competitors tend to specialize in individual
ers with its expertise. The AMS Division, on the other hand, technologies, the Cicor Group can set itself apart with its tech-
experienced a difficult start into the year, which resulted in a nology portfolio and comprehensive solutions. Innovation is an
decline in sales, attributable to the challenging market environ- important driver and criterion on which customers base their
ment in the eurozone's aerospace, defense and nuclear energy decisions.
sectors, as well as to the loss of sales related to the manufacture
of an end-of-life product. Relatively unperturbed by these ad- The good results of the ES Division, together with an increase
verse conditions, the AMS Division did not deviate from its in efficiency in the Corporate area, compensated for the AMS
course, and the targeted adjustments implemented within the Division's poorer results. Group EBIT amounted to CHF 3.6 mil-
organization during the first half of 2014 will have a positive lion in the first half of 2014, an increase of 24.9 % compared
impact on the Division's results. with CHF 2.9 million during the same period in 2013. The Cicor
Group's EBIT profitability has thus improved, reaching 3.5 %
The Cicor Group's order intake grew from CHF 99.7 million in the (first half of 2013: 3.0 % ). EBITDA for the period under review
first half of 2013 to CHF 100.2 million in the first half of 2014, an amounted to CHF 8.5 million, which corresponds to a pleasing
increase of 0.4 % (adjusted for currency effects: +2.2%). At growth of 18.1 % compared with the prior-year period. The
CHF 119.7 million, the order backlog as at 30 June 2014 was again EBITDA margin increased to 8.2 % in the first half of 2014.
very pleasing.
This higher margin was a direct result of the Cicor Group's
The reorganization and streamlining of the Group's structures operational performance. Cost savings and efficiency improve-
with effect from 1 January 2014 laid the foundations for an ments achieved through the merger of Cicor's previous Divisions
optimistic outlook. Merging the former Printed Circuit Boards on 1 January 2014 into just two Divisions will be realized in the
(PCB) and Microelectronics (ME) Divisions, in particular, created second half of the year. Instead of booking the released
production capabilities that meet yet another customer require- resources in the results as one-off effects in the short term,
ment. This has already resulted in the Cicor Group winning the they will be reinvested specifically to further strengthen the
first orders for a combination of PCB production in Boudry, Swit- Cicor Group's organization and enable sustainable improvement
zerland, and microassembly in Radeberg, Germany. in the Group's operational services.
11Cicor | Interim Report 2014
Advanced Microelectronics & Substrates:
Net profit for the first half of the year was 48.6 % higher year- Challenging first half of the year
on-year, amounting to CHF 1.8 million (first half of 2013:
CHF 1.2 million). Earnings per share rose to CHF 0.60 (first half In the first half of 2014, the AMS Division posted sales of
of 2013: CHF 0.42). CHF 27.9 million (first half of 2013: CHF 31.4 million), a decline of
11.3 % . This drop in sales is attributable, on the one hand, to the
After two years of heavy investment, the first half of 2014 saw expiry of a framework agreement with a major customer in mi-
markedly reduced investment in property, plants and equipment croelectronics, whose products had reached the end-of-life
of CHF 3.5 million (first half of 2013: CHF 7.2 million), which was phase but could not yet be compensated with the next genera-
directed toward replacing and modernizing production facilities tion. On the other hand, it was also caused by the ongoing chal-
to enable innovations in the production process. The invest- lenging market environment in the aerospace and defense sec-
ments were offset by depreciations and amortizations in the tors, as well as the continued investment freeze in the nuclear
amount of CHF CHF 4.9 million (first half of 2013: CHF 4.3 million). energy sector.
For 2014 overall, investments are expected to remain below the
prior-year level also for the full year 2014. The negative sales performance in the first half of 2014 was
expected and thus came as no surprise. Nevertheless, based on
The Group balance sheet was again very strong in the first half the clear intention to turn the newly created AMS Division into
of 2014. With equity of CHF 127 million and a balance sheet the most profitable Division of the Cicor Group, a number of
total of CHF 232 million, the Cicor Group's equity ratio was adjustments in the areas of organization, production and logis-
54.8 % . Net debt as at 30 June 2014 was CHF 33.0 million (first tics were initiated within the AMS companies during the first
half of 2013: CHF 28.4 million; at 31 December 2013: CHF 28.2 mil- half of 2014. The reorganization of the two thin-film facilities,
lion). The consolidated cash flow statement as at 30 June 2014 Ulm in Germany and Wangs in Switzerland, under one head, has
showed net cash flows of CHF –4.3 million (first half of 2013: allowed synergies to be better exploited. It also ensures that the
CHF –2.0 million). Net working capital increased in the first half facilities are managed consistently and that they work together
of 2014, from CHF 49.4 million as at the end of 2013 to even more closely in the aim of maximizing the utilization of
CHF 56.9 million. existing know-how and potential in thin-film technologies.
12Cicor | Interim Report 2014
Electronic Solutions:
Great growth dynamic and constant earnings
In the period under review, the ES Division achieved substan-
Thanks to strict cost management, EBIT for the first half of 2014 tially higher sales and exceeded its operating results of the first
reached CHF –0.1 million, which, however, was far below the half of 2013. Its strong niche positions, intensive market devel-
CHF 1.0 million achieved in the first half of 2013. For the second opment efforts and successfully implemented growth projects
half of this year, the AMS Division is anticipating an upturn in enabled its companies to gain further market share and benefit
sales as well as a higher EBIT. The watchmaking and telecom- from high demand. The decisive factors in achieving this suc-
munications industries in particular are expected to provide cessful and profitable growth included the winning of market
positive momentum. share with global customers and the high proportion of cus-
tomer projects that generate strong sales in the medical, indus-
As next steps the AMS Division will complete the merger of the trial and automotive sectors.
former PCB and ME Divisions initiated in the first half of 2014
and further expand its customer base. The combination of thin- Sales grew 19.3 % to CHF 75.0 million (first half of 2013:
film technology with traditional PCB technology will offer suf- CHF 62.9 million), which reflects the solid market position the
ficient potential for this. Thick-film technology and microas- Division has attained due to the compelling quality of its ser-
sembly as production steps after the manufacture of PCBs vices. The positive performance in terms of sales was driven by
should also generate great opportunities for growth, which the both European and Asian locations, while the Swiss location in
Division will need to exploit. The streamlining of the Group's Bronschhofen (municipality of Wil/SG) also recorded a signifi-
organizational structure and vertical integration of the value cant increase in its sales compared with the first half of 2013,
chain have resulted in a better and broader service portfolio with demand for its engineering, product development and
from one single source for the customers. other services soaring.
With its expertise in the manufacture of printed circuit boards, The growth rate in Asia remained high in the first half of 2014,
thin-film technology and microelectronics, the AMS Division is mainly based on the performance in Indonesia and Vietnam.
perfectly positioned to produce customer products that are even After relatively subdued performance in China since entering the
smaller, even thinner and even more powerful. The winning market there in 2011, the local company was able to win two
combination of existing technologies from the former PCB and customers with very interesting volumes in the first half of the
ME Divisions and the resulting opportunities to insource the year and thus lay the foundations for future positive develop-
complete manufacturing process, i.e. from the production of the ments in these markets. Investing in technological differentia-
substrate to microassembly and final testing, will enable the tion and development of emerging markets will continue being
AMS Division to increase its positive contribution to Group per- key success factors for further growth in the Asia region in the
formance in the future. future.
13Cicor | Interim Report 2014
In the first half of 2014, EBIT was CHF 4.4 million (first half of Further improvements in sales
2013: CHF 3.1 million), and the EBIT margin reached a solid 5.9 % and results planned for the future
(first half of 2013: 4.9 % ). While this growth, coupled with good
machine capacity utilization, had a positive impact on the Divi- Cicor has made further progress in the first half of 2014. Since
sion's results and margin, the Division also succeeded in acquir- the middle of 2012, Cicor has been on an above-market growth
ing customer projects with high margins thanks to innovative course and is now well positioned to further increase its sales
production solutions and services. and net profit overall for 2014 in a stable economic environment.
The Division is expected to develop at around the same rate in On behalf of the Board of Directors and Management team, we
the second half of the year. One particular focus will be strate- would like to extend our thanks to all our employees for their
gic business development with international customers with a commitment and efforts. We would also like to thank our cus-
specific need for production capacities in different regions. tomers and business partners for their loyalty and valued coop-
eration. And, last but not least, we would like to thank you, our
shareholders, for the trust you continue to place in us.
Personnel changes
There were no personnel changes in Cicor's Group Management
in the first half of 2014. All members of the Board of Directors
were re-elected at the Annual General Meeting on 24 April 2014
and the Board thus remained unchanged in the period under Antoine Kohler Patric Schoch
review. Chairman of the Board of Directors Acting CEO/CFO
14Cicor | Interim Report 2014
Financial Report 2014
15Cicor | Interim Report 2014
Consolidated Financial Statements
(unaudited)
Consolidated balance sheet
in CHF 1 000 30.06.2014 in % 31.12.2013 in %
Asset
Property, plant and equipment 47 469 20.4 48 199 21.3
Intangible assets 80 569 34.7 81 137 35.9
Deferred tax assets 6 371 2.7 6 441 2.8
Non-current assets 134 409 57.9 135 777 60.0
Inventories 44 971 19.4 40 893 18.1
Trade accounts receivable 36 567 15.7 29 553 13.1
Income tax receivable 9 0.0 12 0.0
Other accounts receivable 3 513 1.5 3 738 1.7
Prepaid expenses and accruals 1 747 0.8 957 0.4
Cash and cash equivalents 11 070 4.8 15 369 6.8
Current assets 97 877 42.1 90 522 40.0
Total assets 232 286 100.0 226 299 100.0
Liabilities and shareholders' equity
Ordinary share capital 28 892 12.4 28 806 12.7
Share premium 114 251 49.2 114 955 50.8
Treasury shares –37 –0.0 –37 –0.0
Retained earnings –10 623 –4.6 –12 450 –5.5
Translation reserve –5 491 –2.4 –5 606 –2.5
Equity attributable to Cicor shareholders 126 992 54.7 125 668 55.5
Non-controlling interests 234 0.1 185 0.1
Total equity 127 226 54.8 125 853 55.6
Long-term provisions 2 213 1.0 2 057 0.9
Deferred tax liabilities 3 186 1.4 3 375 1.5
Long-term financial liabilities 38 017 16.4 38 064 16.8
Liabilities for post-employment benefits 15 530 6.7 15 174 6.7
Other long-term liabilities 47 0.0 46 0.0
Non-current liabilities 58 993 25.4 58 716 25.9
Short-term financial liabilities 6 030 2.6 5 526 2.4
Trade accounts payable 24 675 10.6 21 037 9.3
Other current liabilities and accruals 12 981 5.6 12 769 5.6
Short-term provisions 2 130 0.9 2 243 1.0
Income tax payable 251 0.1 155 0.1
Current liabilities 46 067 19.8 41 730 18.4
Total liabilities 105 060 45.2 100 446 44.4
Total equity and liabilities 232 286 100.0 226 299 100.0
16Cicor | Interim Report 2014
Consolidated income statement
in CHF 1 000 Notes 1.1.–30.6.2014 in % 1.1.–30.6.2013 in %
Net Sales (2)
102 873 100.0 94 251 100.0
Material costs –52 439 –51.0 –46 401 –49.2
Personnel costs –30 332 –29.5 –29 138 –30.9
Other operating income 841 0.8 563 0.6
Other operating expenses –12 461 –12.1 –12 095 –12.8
Depreciation –4 200 –4.1 –3 709 –3.9
Amortization –720 –0.7 –618 –0.7
Operating profit (EBIT) 3 562 3.5 2 853 3.0
Financial income 1 716 1.7 2 655 2.8
Financial expenses –2 845 –2.8 –3 633 –3.9
Profit before tax (EBT) 2 433 2.4 1 875 2.0
Income tax –654 –0.6 –678 –0.7
Net profit 1 779 1.7 1 197 1.3
Attributable to:
– Cicor shareholders 1 733 1 210
– Non-controlling interests 46 –13
Earnings per share (CHF)
– basic 0.60 0.42
– diluted 0.60 0.42
Consolidated statement of comprehensive income
in CHF 1000 1.1.–30.6.2014 1.1.–30.6.2013
Net profit 1 779 1 197
Other comprehensive income:
Items that will not be reclassified to profit or loss:
Remeasurements on employees' defined benefit plans 120 –87
Income tax effect on remeasurements on employees' defined
benefit plans –23 11
Items that may be reclassified subsequently to profit or loss:
Translation adjustment 115 429
Other comprehensive income 212 353
Total comprehensive income 1 991 1 550
Attributable to:
– Cicor shareholders 1 942 1 560
– Non-controlling interests 49 –10
17Cicor | Interim Report 2014
Condensed consolidated cash flow statement
in CHF 1 000 Notes 1.1.–30.6.2014 1.1.–30.6.2013
Profit before tax 2 433 1 875
Depreciation / Amortization 4 920 4 327
Other non-cash income and expenses – 29
Net interest costs 803 722
(Gain) / loss on disposal of assets –38 –
Increase / (decrease) in provisions 226 249
Unrealized currency (gains) / losses 717 691
Subtotal before working capital changes 9 061 7 893
(Increase) / decrease in working capital –8 437 –9 927
Income tax paid –440 –545
Interest paid –786 –887
Interest received 150 349
Net cash from / (used in) operating activities –452 –3 117
Purchase of property, plant and equipment –3 498 –7 150
Proceeds from sale of property, plant and equipment 59 5
Purchase of intangible assets –152 –494
Net cash (used in) / from investing activities –3 591 –7 639
Proceeds from issue of share capital 248 86
Dividend / capital contribution paid to shareholders (6)
–866 –862
Payment of finance lease liabilities –552 –564
Proceeds from borrowings 3 511 10 110
Repayment of borrowings –2 625 –
Net cash from / (used in) financing activities –284 8 770
Net increase / (decrease) in cash and cash equivalents –4 327 –1 986
Cash and cash equivalents at the beginning of the period 15 369 16 756
Net increase / (decrease) in cash and cash equivalents –4 327 –1 986
Currency translation effects 28 56
Cash and cash equivalents at the end of the period 11 070 14 826
18Cicor | Interim Report 2014
Consolidated statement of changes in equity
Equity
attributable Non-
Share Share Treasury Retained Translation to Cicor controlling Total
in CHF 1 000 capital premium shares earnings reserve shareholders interest equity
Balance at 1 January 2014 28 806 114 955 –37 –12 450 –5 606 125 668 185 125 853
Net profit – – – 1 733 – 1 733 46 1 779
Other comprehensive income – – – 94 115 209 3 212
Total comprehensive income – – – 1 827 115 1 942 49 1 991
Transactions with owners, recorded
directly in equity:
Dividend/capital contribution paid to
shareholders – –866 – – – –866 – –866
Capital increase for the established
stock option plans 86 162 – – – 248 – 248
Total transactions with owners 86 –704 – – – –618 – –618
Balance at 30 June 2014 28 892 114 251 –37 –10 623 –5 491 126 992 234 127 226
Equity
attributable Non-
Share Share Treasury Retained Translation to Cicor controlling Total
in CHF 1 000 capital premium shares earnings reserve shareholders interest equity
Balance at 1 January 2013 28 765 115 739 –37 –18 928 –5 339 120 200 190 120 390
Net profit – – – 1 210 – 1 210 –13 1 197
Other comprehensive income – – – –79 429 350 3 353
Total comprehensive income – – – 1 131 429 1 560 –10 1 550
Transactions with owners, recorded
directly in equity:
Dividend/capital contribution paid to
shareholders – –862 – – – –862 – –862
Capital increase for the established
stock option plans 30 56 – – – 86 – 86
Total transactions with owners 30 –806 – – – –776 – –776
Balance at 30 June 2013 28 795 114 933 –37 –17 797 –4 910 120 984 180 121 164
19Cicor | Interim Report 2014
Notes to the condensed consolidated financial statements
(unaudited)
1. Principles of consolidation and valuation
These condensed consolidated interim financial statements as
of 30 June 2014 are prepared in accordance with IAS 34 Interim
Financial Reporting. They do not include all of the information
and disclosures required for full annual financial statements and
should be read in conjunction with the Group’s annual report as
at 31 December 2013. The consolidated financial statements of
the Group as at and for the year ended 31 December 2013 are
available at www.cicor.com or upon request from the Company’s
registered office.
These condensed consolidated interim financial statements
were authorized for issue by the Board of Directors on 20 August IFRS standards and interpretations applied for 2014
2014. Cicor has adopted the following new standards and amend-
ments to standards, including any consequential amendments
When preparing the consolidated interim statements, manage- to other standards, with a date of initial application of 1 January
ment is required to make estimates and assumptions. Any 2014 which had no impact on the Group’s overall results and
alterations to these estimates and assumptions are adjusted in financial position:
the reporting period in which the estimates and assumptions • Amendments to IAS 32 “Offsetting Financial Assets and
are changed. Income taxes are calculated based on an estimate Financial Liabilities“
of the income tax rate expected for the whole year and depend- • Amendments to IFRS 10, 12 and IAS 27 “Investment Entities“
ing on local rules and requirements. • Amendments to IAS 36 “Recoverable Amount Disclosure for
Non-Financial Assets“
The consolidated interim financial statements were drawn up • Amendments to IAS 39 “Novation of Derivatives and Continu-
in compliance with the accounting principles described in the ation of Hedge Accounting“
consolidated annual financial statements 2013. • IFRIC 21 “Levies“
20Cicor | Interim Report 2014
2. Segment reporting
Total
reportable Corporate and
2014 AMS Division ES Division segments eliminations Consolidated
in CHF 1 000 1.1.–30.6.2014 1.1.–30.6.2014 1.1.–30.6.2014 1.1–30.6.2014 1.1.–30.6.2014
Income statement
Sales to external customers 27 854 75 019 102 873 – 102 873
Intersegment sales – 26 26 –26 –
Segment result before depreciation
and amortization (EBITDA) 2 724 6 432 9 156 –674 8 482
Segment result (EBIT) –128 4 393 4 265 –703 3 562
Balance sheet 30.6.2014 30.6.2014 30.6.2014 30.6.2014 30.6.2014
Intangible segment assets 37 523 42 860 80 383 186 80 569
Other than intangible segment assets 66 031 81 863 147 894 3 823 151 717
Total assets 103 554 124 723 228 277 4 009 232 286
Segment liabilities 68 068 68 580 136 648 –31 588 105 060
Other segment information 1.1.–30.6.2014 1.1.–30.6.2014 1.1.–30.6.2014 1.1.–30.6.2014 1.1.–30.6.2014
Depreciation and amortization 2 852 2 039 4 891 29 4 920
Capital expenditures for property,
plant and equipment 2 171 1 341 3 512 – 3 512
Total
reportable Corporate and
2013 AMS Division ES Division segments eliminations Consolidated
in CHF 1 000 1.1.–30.6.2013 1.1.–30.6.2013 1.1.–30.6.2013 1.1.–30.6.2013 1.1.–30.6.2013
Income statement
Sales to external customers 31 376 62 875 94 251 – 94 251
Intersegment sales 15 22 37 –37 –
Segment result before depreciation
and amortization (EBITDA) 3 757 4 687 8 444 –1 264 7 180
Segment result (EBIT) 1 045 3 104 4 149 –1 296 2 853
Balance sheet 31.12.2013 31.12.2013 31.12.2013 31.12.2013 31.12.2013
Intangible segment assets 37 906 42 995 80 901 236 81 137
Other than intangible segment assets 68 086 72 183 140 269 4 893 145 162
Total assets 105 992 115 178 221 170 5 129 226 299
Segment liabilities 70 500 58 990 129 490 –29 044 100 446
Other segment information 1.1.–30.6.2013 1.1.–30.6.2013 1.1.–30.6.2013 1.1.–30.6.2013 1.1.–30.6.2013
Depreciation and amortization 2 712 1 583 4 295 32 4 327
Capital expenditures for property,
plant and equipment 3 704 3 446 7 150 – 7 150
Cicor defines its reportable segments based on the internal reporting to its chief operating decision makers. They base their strategic
and operative decisions on these monthly distributed reports, which include the aggregated financial data for the Group and for the
divisions. As from 1 January 2014, Cicor adjusted its structure and reduced the number of Divisions from four to two. The former Cicor
Printed Circuit Boards (PCB) and Cicor Microelectronics (ME) Divisions were merged into the division “Advanced Microelectronics &
Substrates (AMS) and the Cicor Electronic Solutions and Cicor Asia Divisions were merged into the Division “Electronic Solutions"
(ES). Previous year’s segment reporting has been adjusted accordingly.
21Cicor | Interim Report 2014
For the internal reporting and therefore the segment reporting the applied principles of accounting and valuation are the same as
in the consolidated financial statements. Intersegment sales are recognized at arm’s length.
in CHF 1 000 1.1.–30.6.2014 1.1.–30.6.2013
Reconciliation of total reportable segment result
Total reportable segment result (EBIT) 4 265 4 149
Other corporate expenses –703 –1 296
Financial income 1 716 2 655
Financial expenses –2 845 –3 633
Consolidated profit before tax 2 433 1 875
in CHF 1 000 1.1.–30.6.2014 % 1.1.–30.6.2013 %
Sales by destination
Switzerland 37 944 36.9 42 539 45.1
Europe (without Switzerland) 36 814 35.8 37 192 39.5
Asia 19 955 19.4 8 632 9.2
North America 7 318 7.1 3 452 3.7
Other 842 0.8 2 436 2.5
Total 102 873 100.0 94 251 100.0
Sales by industry
Aerospace & defence 9 006 8.8 9 137 9.7
Communication 8 544 8.3 10 889 11.6
Industrial 27 567 26.8 18 707 19.8
Medical 29 681 28.9 25 135 26.7
Automotive & transport 10 062 9.8 7 555 8.0
Watches & consumer 12 274 11.9 15 068 16.0
Other 5 739 5.5 7 760 8.2
Total 102 873 100.0 94 251 100.0
Major customers
Cicor Group has no single customer with 10 % or more of the Group’s consolidated sales.
22Cicor | Interim Report 2014
Conditional capital
3. Share-based payments At the Shareholders’ Meeting of 13 May 2009, the shareholders
decided to increase the conditional share capital up to 200 000
There have neither been any costs recognized in profit or loss fully paid in registered shares with a total nominal value up to
related to stock option plans nor have any new plans been CHF 2 000 000 for the exercise of stock option rights granted
established during the financial years 2013 and 2014. to officers and other key employees under an employee stock
option plan to be established by the Board of Directors. During
Option holdings the first six months 2014 8 584 shares have been issued (finan-
During the first six months 2014, 8 584 options (first half-year cial year 2013: 4 084 shares).
2013: 3 000) were exercised, 2 000 options (first half-year 2013:
3 834) have expired and no options (2013: 0) have forfeited. All At the Shareholders’ Meeting of 13 May 2009, the shareholders
outstanding options of 38 793 (31.12.2013: 49 377) are exercis- decided to create additional conditional share capital of up to
able and dilutive. The dilution effect is immaterial; therefore the 500 000 fully paid in registered shares with a total nominal
basic and dilutive earnings per share do not differ. value of up to CHF 5 000 000 for the exercise of conversion
rights granted to holders of convertible debt securities to be
issued by the company. Such conversion rights would have to
4. Issued capital be exercised within five years of the issuance of such converti-
ble debt securities.
in CHF 1 000
Share capital at 1 January 2013 28 765
Increase of ordinary share capital of
5. Seasonality of the business
4 084 registered shares at CHF 10 41
Share capital at 31 December 2013 28 806 Although Cicor’s business has been fluctuating in the past, these
Increase of ordinary share capital of fluctuations were not due to seasonal effects.
8 584 registered shares at CHF 10 86
Share capital at 30 June 2014 28 892
6. Dividend paid
2 889 092 registered shares of CHF 10
At the Shareholders’ Meeting of 24 April 2014 the shareholders
Ordinary share capital decided to allocate TCHF 866 from the capital contributions to
In 2014, the ordinary share capital was increased by 8 584 the free reserves and to distribute CHF 0.30 per share (totaling
shares out of conditional capital at a nominal value of CHF 10 CHF 866 277.60) to the shareholders out of these free reserves.
for the established stock option plans (financial year 2013: 4 084
shares).
7. Subsequent events
Authorized capital
At the Shareholders’ Meeting at 24 April 2014 the shareholders There were no events between 30 June 2014 and 20 Au-
decided to renew the authorization of the Board of Directors to gust 2014 that would require an adjustment to the carrying
increase the share capital by a maximum of 600 000 fully paid amounts of assets and liabilities or need to be disclosed under
in shares at a nominal value of CHF 10 until 24 April 2016. this heading.
23Cicor | Interim Report 2014
Agenda
Annual Report 2014: 11 March 2015
Annual Shareholders’ Meeting: 23 April 2015
Interim Report 2015: August 2015
24Cicor | Interim Report 2014
Addresses
Head Office Contact
Cicor Technologies Ltd. Cicor Management AG Phone +41 43 811 44 05
Route de l’Europe 8 World Trade Center Fax +41 43 811 44 09
2017 Boudry Leutschenbachstrasse 95 info@cicor.com
Switzerland 8050 Zurich investor@cicor.com
info@cicor.com Switzerland
www.cicor.com www.cicor.com
Advanced Microelectronics & Substrates Electronic Solutions
Cicorel SA RHe Microsystems GmbH Swisstronics Contract Cicor Asia Pte Ltd.
Route de l’Europe 8 Heidestrasse 70 Manufacturing AG 45 Changi South Avenue 2
2017 Boudry 01454 Radeberg Industriestrasse 8 #02-00 Singapore 486133
Switzerland Germany 9552 Bronschhofen Singapore
Phone +41 32 843 05 00 Phone +49 3528 4199-0 Switzerland Phone +65 6546 16 60
Fax +41 32 843 05 99 Fax +49 3528 4199-99 Phone +41 71 913 73 73 Fax +65 6546 65 76
www.cicor.com www.cicor.com Fax +41 71 913 73 74 www.cicor.com
www.cicor.com
Cicorel SA Reinhardt Microtech GmbH Cicor Ecotool Pte Ltd.
Avenue de Préville 4 Sedanstrasse 14 Swisstronics Contract 45 Changi South Avenue 2
1510 Moudon 89077 Ulm Manufacturing AG #04-01 Singapore 486133
Switzerland Germany Via Luserte Sud 7 Singapore
Phone +41 21 905 92 92 Phone +49 731 9858 8413 6572 Quartino Phone +65 6546 16 60
Fax +41 21 905 92 93 Fax +49 731 9858 8411 Switzerland Fax +65 6545 00 32
www.cicor.com www.cicor.com Phone +41 91 850 38 11 www.cicor.com
Fax +41 91 850 39 88
Cicor Americas Ltd. Reinhardt Microtech AG www.cicor.com PT. Cicor Panatec
185 Alewife Brook Parkway, Aeulistrasse 10 Jl. Beringin Lot 323-324 BIP
Suite #410 7323 Wangs S.C. Systronics S.R.L. Muka Kuning, Batam
Cambridge Switzerland Zone Parc Industrial F-N Indonesia
MA 02138 Phone +41 81 720 04 56 310580 Arad Phone +62 770 612 233
USA Fax +41 81 720 04 50 Romania Fax +62 770 61 22 66
Phone + 1 617 576 2005 www.cicor.com Phone +40 257 285 944 www.cicor.com
Fax + 1 617 576 2001 Fax +40 257 216 733
www.cicor.com www.cicor.com Cicor Anam Ltd.
15 Street 4, Vietnam Singapore
Industrial Park Thuan An Town
Binh Duong Province, Vietnam
Vietnam
Phone +84 650 375 66 23
Fax +84 650 375 66 24
www.cicor.com
Suzhou Cicor Technology Co. Ltd
No.11 Building
No. 666 Jianlin Road
SND-EPZ Sub-industrial Park
Suzhou 215151, China
Phone +86 512 6667 2033
www.cicor.com
25Cicor | Interim Report 2014
Concept and Design: DACHCOM.CH AG, Winterthur
Photos: © Trapeze Group
Printing: Binkert Buag AG, Laufenburg
Climate-neutrally printed on FSC-certified paper
This Interim Report can be accessed on the internet at
www.cicor.com
© Cicor Technologies Ltd., August 2014
26Cicor Technologies Ltd. Route de l’Europe 8 2017 Boudry Switzerland www.cicor.com
Sie können auch lesen