Ich brauche eine Übersicht! Neues zu Medikamenten der MS - Prof. Dr. Philipp Albrecht

Die Seite wird erstellt Petra-Hortensia Arndt
 
WEITER LESEN
Ich brauche eine Übersicht! Neues zu Medikamenten der MS - Prof. Dr. Philipp Albrecht
Ich brauche eine Übersicht!
Neues zu Medikamenten der MS

   Prof. Dr. Philipp Albrecht

      Leitung MS Zentrum
      Klinik für Neurologie
    Heinrich Heine Universität
            Düsseldorf
Ich brauche eine Übersicht! Neues zu Medikamenten der MS - Prof. Dr. Philipp Albrecht
Interessenskonflikte
•Honorare für Referenten- und Berater-Tätigkeit von Biogen, Celgene, Novartis, TEVA,
Allergan, IPSEN, Merz.
•Unterstützung für Kongress-Reisen von Biogen, Celgene, Novartis, TEVA, Allergan,
IPSEN, Merz, Esai, GSK.

•Förderung wissenschaftlicher Projekte von Allergan, Biogen, Celgene, Ipsen, Merz, Merck,
Novartis, TEVA, Roche.
Ich brauche eine Übersicht! Neues zu Medikamenten der MS - Prof. Dr. Philipp Albrecht
Langzeitprognose MS ohne prophylaktische Behandlung

                                                                                                                                                                   Ohne Behandlung ...
    % of patients
                                                                                                                                                             ▪ Erreichen 50%...

                                                                                                                                                             .... innerhalb von 2-3 Jahren eine klinisch
                                                                                                                                                                   relevante Behinderungsprogression2

                                                                                                                                                             .... innerhalb von 10 Jahren eine SPMS2

                                                                                                                                                             .... innerhalb von 15 Jahren
                                                                                                                                                                   eine Gehbehinderung2

                                                                                                                                                             .... innerhalb von 25 Jahren eine Abhängigkeit
                                                                                                                                                             __auf einen Rollstuhl2
        1. Entnommen aus The natural history of multiple sclerosis: a geographically based study

                                                         Ziel der MS-Therapie: Verbessern der natürlichen Prognose

  MS: Multiple Sklerose; EDSS: expanded disability status scale; SPMS: sekundär progrediente Multiple Sklerose
  1.The natural history of multiple sclerosis: a geographically based study. 2. Predictive value of the early clinical course. Weinshenker B et al. Brain 1989, 112:1419-1428.
Ich brauche eine Übersicht! Neues zu Medikamenten der MS - Prof. Dr. Philipp Albrecht
2021… and more to come

                         X
Ich brauche eine Übersicht! Neues zu Medikamenten der MS - Prof. Dr. Philipp Albrecht
Das zentrale Nervensystem

                                               Axon
                        Hirn   Myelinscheide
       N. opticus

       Myelon

                                                      Courtesy of L. Balk 2015
Ich brauche eine Übersicht! Neues zu Medikamenten der MS - Prof. Dr. Philipp Albrecht
Early Treatment:
A Window of Opportunity to Modify Disease Progression

 • The Rennes EDMUS database comprises 2054 patients with clinically definite MS
 • Disability progression of MS reflects a two-phase process:
      • Phase 1: highly variable rates of disease progression, which may be dependent on levels of inflammation
      • Phase 2: disability accumulation that is constant and may be independent of inflammation

                7

                6

                                                                                                                                      Phase 2
                5
    DSS score

                4

                3                                                                                                                         Irreversible disability
                2
                        The Window of Opportunity: treating early offers the best opportunity to
                        modify the course of disease and delay neurological progression                                               Phase 1
                1

                0
                    0               5                             10                        15                             20    25       30
                                                                            Reused under Creative Commons License CC BY-NC 2.5

                                                       Years from clinical onset of multiple sclerosis
                           n=718 MS patients divided into five subgroups according to the duration of phase 1
                           DSS = Disability Status Scale; EDMUS = European Database for Multiple Sclerosis
                           Leray E, et al. Brain 2010; 133(Pt 7):1900–13.                                                                              6
Ich brauche eine Übersicht! Neues zu Medikamenten der MS - Prof. Dr. Philipp Albrecht
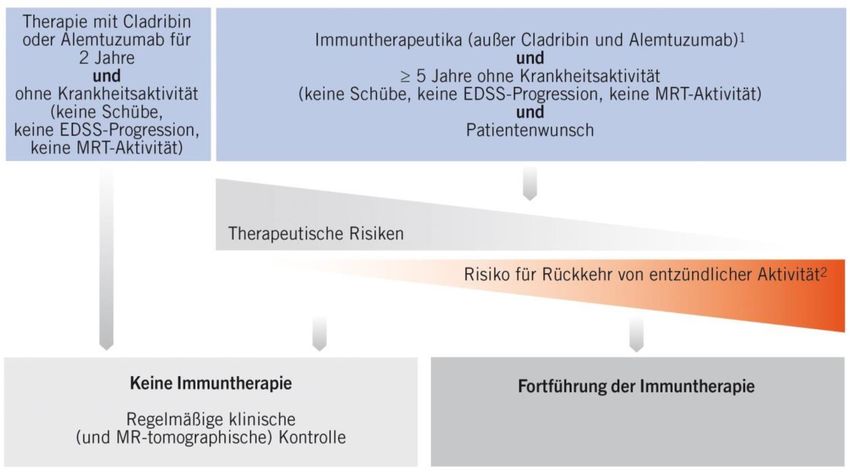
Bessere Verläufe: Verzögerung der Progression durch früheren
Therapiebeginn
                                                                Daten des Karolinska Hospitals Stockholm

                                                     1,00
                                                                                                            Intervall
                   Wahrscheinlichkeit für EDSS < 4
                                                                                                            Diagnose/
                                                     0,90                                                   Therapiestart
                                                                                                             1 Jahr

                                                                                                                         Das Risiko für Erreichen eines EDSS =
                                                                                                             1-3 Jahre   4 steigt bei späterem
                                                     0,80                                                                Therapiebeginn signifikant an.
                                                                                                                         HR = 1,79 (95%CI: 1,27-2,53)
                                                                                                                         für > 3 Jahre vs. ≤1 Jahr
                                                                                                             >3 Jahre    p = 0,001
                                                     0,70
                                                            0           50          100         150             200
                                                                       Beobachtungsdauer [Monate]

 Ein möglichst früher Therapiebeginn verlängert signifikant das Intervall bis zum Erreichen eines irreversiblen EDSS-Wertes von 4.

                   CI = Konfidenzintervall; EDSS = Expanded Disability Status Scale; HR = Hazard Ratio.
                   Kavaliunas A et al. ECTRIMS 2016; Poster P1222.
                   Hutchinson M. ECTRIMS 2016; Plenary Session 2 (Clinical Highlights); Präsentation 258.
Ich brauche eine Übersicht! Neues zu Medikamenten der MS - Prof. Dr. Philipp Albrecht
Bessere Verläufe: Verzögerung der Progression
durch zunehmend wirksamere Therapien
                                                1,00
                                                                  Jahr der Diagnose                                      Daten aus MS-Zentren in
                                                                  1980-1990                                              Brescia und Bologna
                                                                  1991-1995
              Wahrscheinlichkeit für EDSS = 6   0,95
                                                                  1996-2000
                                                                  2001-2005
                                                                  2006-2010
                                                0,90              2011 +                                                 Das Alter beim Erreichen
                                                            n = 1324 Patienten                                           eines EDSS = 6 nimmt zu.
                                                0,85                                                                     HR = 0,56 *
                                                                                                                         p = 0,02
                                                0,80
                                                                                                                         * adjustiert für mittleres Alter bei Diagnose
                                                                                                                         in jeder Periode und für die Länge der
                                                                                                                         Intervalle zwischen den EDSS-Visiten.
                                                0,75
                                                       15      25         35          45             55             65
                                                                               Alter [Jahre]

 Zunehmend wirksamere Therapien erhöhen (vor allem seit dem Jahr 2000) signifikant das Alter bei
 Erreichen eines EDSS-Wertes von 6.
                           EDSS = Expanded Disability Status Scale; HR = Hazard Ratio.
                           Cordioli C et al. ECTRIMS 2016; Poster P299.
                           Hutchinson M. ECTRIMS 2016; Plenary Session 2 (Clinical Highlights); Präsentation 258.
Ich brauche eine Übersicht! Neues zu Medikamenten der MS - Prof. Dr. Philipp Albrecht
Brown et al. JAMA 2019
Ich brauche eine Übersicht! Neues zu Medikamenten der MS - Prof. Dr. Philipp Albrecht
Hemmer et al., 2021   Wiendl et al., Nervenarzt 2021
Treatment choice

                      1. Wilson SL et al. Int J MS Care 2015;17:74–82; 2. Kruk EM et al. Clin Ther 2006;28:1989–95;
                       3. Shingler SL et al. J Med Econ 2013;16:1036–42; 4. Riñon A et al. Patient Prefer Adherence
Hemmer et al., 2021                                                                                   2011;5:629–43   Wiendl et al., Nervenarzt 2021
NEDA (No Evidence of Disease Activity) at year 2 across medications

                                                                     )

Proportion of patients for whom NEDA was achieved at 2 years with disease-modifying therapies and AHSCT. Blue dots are the mean, bars represent 95 % confidence intervals.
Adaptiert nach Muraro P et al. Nature Reviews Neurology; Autologous haematopoietic stem cell transplantation for treatment of multiple sclerosis * Indirekter Vergleich.
• N=2200 RRMS, >7y follow up @
             Brigham and Women‘s hospital
           • NEDA @ 2 y had 78.3% positive
             predictive value for no EDSS
             progression @7 years.
           • NEDA is difficult to sustain long
             term even with treatment

Rotstein et al., JAMA Neurol 2015
Risiko-Nutzen Abwägung

                                     Cladribine
                         Siponimod

                         Ozanimod

                                                  verändert nach Hauser et al., 2013, Ann Neurol; 74: 317-327
Nebenwirkungen -> Lateral Switch

                                              Cladribine
                                  Siponimod

                                  Ozanimod

              Sciencedirect.com                            verändert nach Hauser et al., 2013, Ann Neurol; 74: 317-327
Optimierung: Eskalation

                                      Cladribine
                          Siponimod

                          Ozanimod, Ponesimod

                                                   verändert nach Hauser et al., 2013, Ann Neurol; 74: 317-327
Algorithmus Therapie-Absetzen, DGN Leitlinie

Hemmer et al., 2021
Optimierung: Deeskalation

                                        Cladribine
                            Siponimod
                                        , Ozanimod,
                                        Ponesimod

                                                      verändert nach Hauser et al., 2013, Ann Neurol; 74: 317-327
SPMS Konversion

                              Cladribine
                  Siponimod

                  Ozanimod

                                           verändert nach Hauser et al., 2013, Ann Neurol; 74: 317-327
Update: Corona und MS
Gupta et al., Lancet Respir. Med. 2021

                                                                     11 predictors of deterioration (on admission):

                                                                     •    age,
                                                                     •    sex,
                                                                     •    nosocomial infection,
                                                                     •    Glasgow coma scale score,
                                                                     •    peripheral oxygen saturation (SpO2) at admission,
                                                                     •    breathing room air or oxygen therapy (contemporaneous
                                                                          with SpO2 measurement),
                                                                     •    Respiratory rate,
                                                                     •    urea concentration,
                                                                     •    C-reactive protein concentration,
                                                                     •    lymphocyte count,
                                                                     •    presence of radiographic chest infiltrates

Solomon, presented at AAN 2021 in Neurological Covid-19 Disease
                                                                  M-ES-00003284, M-GB-00003135, M-BE-00000582, M-DE-00006023, M-IT-00000643, M-PT-00000731, April 2021
•   Thrombotic/embolic vascular events
    •   Autoimmune mechanisms
    •   Endothelial inflammation/vasculitis
    •   CNS/PNS virus infection

Metaanalysis: Neurological Associations of Covid-19
901 patients in 70 publications

•   93 (10%) encephalopathy
•   54 (6%) stroke
•   19 (2%) Guillain-Barré syndr.
•   8 (0.9%) encephalitis

Common: Anosmia & ageusia

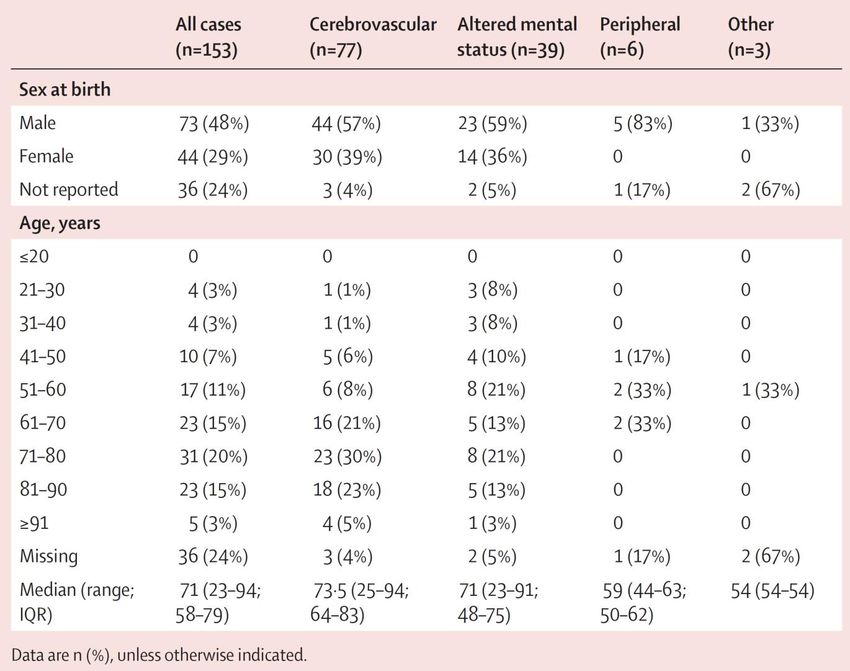
T. Solomon, Nat. Rev. Neurol. 2021; Ellul et al., Lancet Neurol 2020
•   CoroNerve Study
                                            •   N=153 pat. with
                                                neurological manifestations

Varatharaj et al., Lancet Psychiatry 2020
modified by Roche

             •      A total of 347 patients
             •      (mean [SD]) age, 44.6 [12.8] years,
             •      249 women;
             •      disease duration, 13.5 [10.0] years

Louparé et al., JAMA Neurol 2021;
Anti-CD20

  modified by Roche

Louparé et al., JAMA Neurol 2021;
MS Symptoms Following COVID-19
                          57% of people with MS and COVID-19 had an exacerbation of their MS

                                                                  Worsened                                                         New
                                                                  Pre-existing                               N=59                  MS
                                                                  MS symptoms                                                      symptoms
                                                                  N=207                                                            N=82

Garjani A, et al. COVID-19 is associated with multiple sclerosis exacerbations that are prevented by disease modifying therapies. medRxlv 2021 Jan1.,
presented at AAN 2021 in Covid-19 vaccines in patients with MS receiving DMTs                      M-ES-00003284, M-GB-00003135, M-BE-00000582, M-DE-00006023, M-IT-00000643, M-PT-00000731, April 2021
Background information regarding immunosuppression:
Own case report on SARS-CoV-2 infection in RAG1-/- severe combined
immunodeficiency (SCID)

 Keitel et al., Front Neurol 2021;   RDV: Remdesivir
Immune Response to SARS-CoV-2 Infection

                                                                                                         Level of response/antigen load
  SARS-CoV-2                Innate immune                    Induction of            Immune memory                                                       Virus/antigen
   infection               response to virus              adaptive immunity           to SARS-CoV-2?                                                     Specific antibodies

                                                                    Cytokine                                                                             Memory B cells
                                                           TH
                                                                   production            Memory T cell                                                   Specific T cells

                                                           Treg   Regulation of
                                                                  inflammation           Memory B cell
                             DC activation
                             and uptake of                           Killing of
                             viral antigens                CTL
                                                                  infected cells

                                                           TFH    Induction of
                                                                   antibodies                                                             Weeks     Months            Years
                                                                                                            Infection                             Timeline

                                                          B cell       Plasma cell

Adapted from Cox R. and Brokstad K., Nature Reviews Immunology, 2020
Kister et al., presented at AAN 2021 in P15.014

                                                  M-ES-00003284, M-GB-00003135, M-BE-00000582, M-DE-00006023, M-IT-00000643, M-PT-00000731, April 2021
Kister et al., presented at AAN 2021 in P15.014

                                                  M-ES-00003284, M-GB-00003135, M-BE-00000582, M-DE-00006023, M-IT-00000643, M-PT-00000731, April 2021
Vaccination response: Efficacy

                                                           HS                                  MS

                                               10,0

                                                                                                                                                             15

                                                                                                                           Last Tx dose to vaccine, months
                    CoV-2 IgG Antibody Titer

                                                7,5

                                                5,0
                                                                                                                                                             10

                                                2,5

                                                                                                                                                              5

                                                0,0

                                                                             Untreated Cladribine Fingolimod Ocrelizumab                                                Cladribine                   Ocrelizumab
          Time from 2nd vaccine [Days]                      44                  46.5       33         39.5        37
          Median [25-75 IQR]                              34.5-50              35-55    29.5-35.5   33.2-51.5   32-42.2
                                                                                                                                                                            Disease Modifying Treatment

                                                                          Disease Modifying Treatment
                                                      Lymphocyte Count:       1000                                                  Post-vaccination SARS-COV-2 IgG:    IgG-     IgG+

Achiron et al. Ther Adv. Neurol Disord, 2021
Vaccination response: Safety

                                                                                                    First COVID-19    Second COVID-19
                                                                                                   vaccination dose   vaccination dose
                                              Study population                                           555                435
                                              Any adverse events, n (%)                               165 (29.7)         175 (40.2)
                                              Pain at the injection site                               89 (16)           62 (14.2)
                                              Fever/chills, flu-like symptoms                           11 (2)           52 (11.9)
  •   COVID-19 BNT162b2 vaccine proved        Fatigue                                                  51 (9.2)          69 (15.9)
      safe for MS patients.                   Headache                                                 25 (4.5)           32 (7.3)
  •   No increased risk of relapse activity
                                              Muscle or joint pain                                     13 (2.2)           40 (9.2)
      was noted.
                                              Infection with SARS-CoV-2 after vaccination, n (%)        3 (0.5)              0
                                              New or worsening neurological symptomatology, n
                                                                                                        11 (2)            21 (4.8)
                                              (%)
                                              Face tingling                                             3 (0.5)            5 (1.1)
                                              Acute MS relapses, n (%)*                                 8 (2.1)            5 (1.6)
                                              Time to relapse, days
                                              Median                                                      16                 15
                                              Range                                                     10-19              14-21

Achiron et al. MSJ, 2021
Update: neue MS Therapien
Vielen Dank für Ihre Aufmerksamkeit

                                      Biogen-127744
Evolution von Natalizumab in der MS-Therapie

* Durch kürzere Dauer der Verabreichung im Vergleich zur intravenösen Infusion8,9 | # Anteil der Patienten über 2 Jahre | § Kumulative Wahrscheinlichkeit über 10 Jahre
1. Gold R et al. Akt Neurol 2009; 36: 334 – 344; 2.Bevan CJ, Cree BAC. JAMA Neurol. 2014; 71(3): 269 – 270; 3. Lee P et al. J Clin Virol. 2013; 57(2): 141 – 146; 4. Arzt-lnformation und Management-Leitlinien für Patienten mit Multipler
Sklerose, die TYSABRI®(i.v. & s.c.) erhalten. Version 19, genehmigt vom PEI: Februar 2021; 5. Ho PR et al. Lancet Neurol. 2017; 16: 925 – 933; 6.Havrdova E et al. Lancet Neurol. 2009; 8(3): 254 – 260; 7. Butzkueven H et al. J Neurol
Neurosurg Psychiatry. 2020; 91(6): 660 – 668; 8. TYSABRI®s.c. Fachinformation, Stand April 2021; 9. TYSABRI®i.v. Fachinformation, Stand April 2021

                                                                                                                                                                                                                                                    34
                                                                                                                                                                                                                                         Biogen-127744
Der nächste Evolutionsschritt:
Natalizumab in subkutaner Applikation

                                        Biogen-127744
DELIVER & REFINE: Datengrundlage Natalizumab s.c.

                                                                                          DELIVER1                                                                                 REFINE2
                                                                                                                                                           Exploratorische, hinsichtlich der Dosis und
                                                    Randomisierte, offene Phase-I-Studie mit mehreren                                                      Anwendungsfrequenz verblindete, prospektive,
                                                    Dosierungen zur Untersuchung der s.c., i.m. und i.v.                                                   randomisierte Phase-II-Studie mit mehreren Dosierungen zur
               Studiendesign
                                                    Anwendung von TYSABRI® bei Patienten mit RRMS oder                                                     Untersuchung der Wirksamkeit, Sicherheit und Verträglichkeit
                                                    SPMS, die bisher nicht mit Natalizumab behandelt wurden                                                verschiedener Verabreichungswege von TYSABRI® bei
                                                                                                                                                           klinischen stabilen RRMS-Patienten
                                                    • 300 mg i.v. alle 4 Wochen                                                                            • 300 mg i.v./s.c. alle 4 Wochen
               TYSABRI®
                                                    • 300 mg s.c. alle 4 Wochen                                                                            • 300 mg i.v./s.c. alle 12 Wochen
               Dosierung                            • 300 mg i.m. alle 4 Wochen (nur SPMS-Patienten)                                                       • 150 mg i.v./s.c. alle 12 Wochen

i.m.: intramuskulär; i.v.: intravenös; RRMS: Schubförmig remittierende Multiple Sklerose; s.c.: subkutan; SPMS: Sekundär progrediente Multiple Sklerose.
SPMS ist außerhalb den USA keine zugelassene Indikation für die Anwendung von TYSABRI®.
1. Plavina T et al. J Clin Pharmacol. 2016; 56(10): 1254–1262 | 2. Trojano M et al. MSJ 2021, doi.org/10.1177/13524585211003020

                                                                                                                                                                                                                          Biogen-127744
α4-Integrin-Sättigung (%) unter Natalizumab 300 mg s.c. und i.v. alle 4
Wochen waren vergleichbar
                                                                                                                                      REFINE: Patienten mit ≥ 11 i.v. Infusionen von 300 mg
    DELIVER: Patienten ohne Natalizumab-Vorbehandlung1                                                                               Natalizumab in den 12 Monaten vor der Randomisierung 2

     Die s.c. Injektion von Natalizumab 300 mg alle 4 Wochen führte zu                                                                  Nur die Gabe von Natalizumab 300 mg s.c. alle 4 Wochen führte zu
     einer vergleichbaren α4-Integrin-Sättigung wie die i.v. Infusion von                                                                        einer vergleichbaren α4-Integrin-Sättigung wie
                      Natalizumab 300 mg alle 4 Wochen                                                                                               Natalizumab 300 mg i.v. alle 4 Wochen

Schwarze Pfeile zeigen die Zeitpunkte der Natalizumab-Gaben an.
Die α4-Integrin-Sättigung der Lymphozyten wurde in allen Gruppen schnell erreicht, wobei eine Sättigung von > 80% innerhalb von 4 Stunden zu beobachten war und blieb von Woche 12 an im Allgemeinen ≥ 80%
1. Plavina T et al. J Clin Pharmacol. 2016;56:1254-1262 | 2. Trojano M et al. MSJ 2021, doi.org/10.1177/13524585211003020

                                                                                                                                                                                                             Biogen-127744
REFINE1: Wirksamkeit – Primärer Endpunkt aktive Läsionen

                             In Woche 60 war die mittlere Gesamtzahl aller einzelnen aktiven Läsionen seit Baseline in der Gruppe mit
                   Natalizumab 300 mg s.c. alle 4 Wochen (0,02) und in der Gruppe mit Natalizumab 300 mg i.v. alle 4 Wochen (0,23) vergleichbar

In der REFINE-Studie wurden keine formalen Vergleiche zwischen den Therapiearmen durchgeführt.
1. Trojano M et al. MSJ 2021, doi.org/10.1177/13524585211003020

                                                                                                                                                  Biogen-127744
REFINE1: Wirksamkeit – jährliche Schubrate

                               Die jährliche Schubrate war in der Gruppe mit Natalizumab 300 mg i.v. alle 4 Wochen (0,07) und in der Gruppe mit
                                                           Natalizumab 300 mg s.c. alle 4 Wochen (0,08) vergleichbar

In der REFINE-Studie wurden keine formalen Vergleiche zwischen den Therapiearmen durchgeführt.
1. Trojano M et al. MSJ 2021, doi.org/10.1177/13524585211003020

                                                                                                                                                  Biogen-127744
Anwendung von Natalizumab s.c.
                                                    • Zwei Fertigspritzen = Eine Dosis1
                                                    •   Jede Natalizumab s.c. Fertigspritze enthält 150 mg Natalizumab
                                                    •   Je 1 ml Flüssigkeit

                                                    • Nachbeobachtung1
                                                    •   Nach der 1. bis 6. Injektion = Eine Stunde
                                                    •   Ab der 7. Injektion nach Ermessen des Arztes

                                                    • Wechsel i.v.↔ s.c. jederzeit möglich1
                                                    •   Anwendung in Klinik oder Praxis
                                                    •   Injektion kann durch Nurse erfolgen

1. TYSABRI® s.c. Fachinformation, Stand März 2021

                                                                                                                         Biogen-127744
TOUCH Registry: Natalizumab PML incidence standard vs extended dosing interval
                                                                            EID primary                                                                                                        EID secondary                                                                                                              EID tertiary
                                          Tests whether dosing history in the last 18 months of                                                                          Tests whether a prolonged period of EID occurring                                                                        Tests whether a primarily EID dosing history
                                          natalizumab treatment affects PML risk                                                                                         anytime in the dosing history affects PML risk                                                                           affects PML risk

                                          P value from log-rank test:
α4-Integrin-Sättigung (%) unter Natalizumab 300 mg s.c. und i.v. alle 4
    Wochen waren vergleichbar
                                                                 DELIVER: Patienten ohne Natalizumab-Vorbehandlung1

Schwarze Pfeile zeigen die Zeitpunkte der Natalizumab-Gaben an.
Die α4-Integrin-Sättigung der Lymphozyten wurde in allen Gruppen schnell erreicht, wobei eine Sättigung von > 80% innerhalb von 4 Stunden zu beobachten war und blieb von Woche 12 an im Allgemeinen ≥ 80%
1. Plavina T et al. J Clin Pharmacol. 2016;56:1254-1262 | 2. Trojano M et al. MSJ 2021, doi.org/10.1177/13524585211003020                                                                                    Biogen-127744
Ofatumumab

             1. Klinische Evidenz für den frühen
                Einsatz einer adäquaten Therapie

             2. Ofatumumab: Direktes
                lymphatisches Targeting durch
                subkutane Applikation

             3. Ofatumumab: Phase III Studien
ASCLEPIOS I
                                                                                                                                                                                              ASCLEPIOS II
Identisches Studiendesign* ASCLEPIOS I und II                                                                                                                                                 STUDIENDESIGN

       • Alter:                                                 Behandlungszeitraum                                      (doppelblind, double-dummy)                                           Follow-Up
         18–55 Jahre
       • EDSS-Score:                                                             Teriflunomid 14 mg oral (1x täglich)
         0–5,5                                                                      + Placebo s.c. (1x monatlich)
       • Patienten:                                                                                                                                                                            Extensions-
                                                                             Ofatumumab 20 mg s.c. (1x monatlich)a                                                                              studie**
         >900 mit RMS                                                              + Placebo oral (1x täglich)
         pro Studie

                         Randomisierung                                             Mediane Studiendauer: ~20 Monate                                                                  Studienende
                                                                                                                                                                                       (flexibel***)

          •a 20mg Ofatumumab in einem Injektionsvolumen von 0.4ml; *parallele Durchführung, **open label Extension Study; siehe Redner-Anmerkungen; ***maximal 30 Monate für den
          einzelnen Patienten, minimale Behandlungsdauer für den letzten rekrutierter Patienten 1 Jahr, Studienende definiert durch gesammelte statistische Information (Schübe und
          Behinderungsverschlechterung; EDSS, Expanded Disbility Status Scale; M, Monat; s.c., subkutan; T, Tag;
          •Kappos L et al, Presented at ECTRIMS 2018. P965; Hauser SL, et al. N Engl J Med. 2020;383:546–57;
ASCLEPIOS I
Ofatumumab - Primärer Endpunkt:                                                                                                                                                           ASCLEPIOS II

Signifikante Abnahme der jährlichen Schubrate                                                                                                                                             WIRKSAMKEIT

                                                            ASCLEPIOS I                                                                                    ASCLEPIOS II
                                     0,30

                                     0,25
                                                                                                                                                    0,25
              Jährliche Schubratea

                                     0,20               0,22                           50,5%                                                                                     58,5%
                                                                               Relative Abnahme                                                                               Relative Abnahme
                                                                                    p
ASCLEPIOS I
Ofatumumab – sekundärer Endpunkt:                                                                                                                                                                  ASCLEPIOS II

Mittlere Anzahl Gd+ T1-Läsionen pro Scan                                                                                                                                                              WIRKSAMKEIT

                                                                    ASCLEPIOS I                                                                                              ASCLEPIOS II
                                        0,60

                                        0,50
              Anzahl Gd+ T1-Läsionena
                                                                                                                                                                   0,51
                                                                                                                                                                  0,5141
                                                            0,4523
                                                              0,45
                                        0,40                                                           98%                                                                                    94%
                                                                                       Relative Abnahme                                                                                  Relative Abnahme
                                        0,30                                                          p
ASCLEPIOS I
Ofatumumab – sekundärer Endpunkt:                                                                                                                                                                                        ASCLEPIOS II

Neue oder vergrößerte T2-Läsionen pro Jahr                                                                                                                                                                                 WIRKSAMKEIT

                                                                             ASCLEPIOS I                                                                                               ASCLEPIOS II
                                        5,00

            vergrößerter T2-Läsionena   4,00                                                                                                                                  4,15
                                                                       4,00                                    82%                                                                                                85%
                Anzahl neuer oder

                                                                                              Relative Abnahme                                                                                       Relative Abnahme
                                        3,00                                                                 p
ASCLEPIOS I
Ofatumumab – Subgruppenanalyse*:                                                                                                                                                                               ASCLEPIOS II

Reduktion der jährlichen Schubrate                                                                                                                                                                              WIRKSAMKEIT

                                                                                                     Ofatumumab Teriflunomid                                                                                  Interaktions
                                                                                                                                                                                                                P-Werta
              Gesamtkohorte                                                                                       0,12                                  0,26

              Alter (Jahre)
              ≤40                                                                                                 0,12                                  0,29
                                                                                                                                                                                                                 0,049
              >40                                                                                                 0,12                                  0,20
              EDSS bei Baseline
              ≤3.5                                                                                                0,10                                  0,25
                                                                                                                                                                                                                 0,023
              >3.5                                                                                                0,18                                  0,28
              Anzahl Schübe 2 Jahre vor Studie
              ≤2                                                                                                  0,10                                  0,21
                                                                                                                                                                                                                 0,560
              >2                                                                                                  0,19                                  0,37
              Anzahl an Gd+ T1 Läsionen bei Baseline
              0                                                                                                   0,11                                  0,23
                                                                                                                                                                                                                 0,398
              >0                                                                                                  0,13                                  0,31

               *gepoolte Analyse                                                                                                                                        0.1                 1            10
                                                                                                                                                Rate ratio (95% CI)
                                                                                                                         Vorteil Ofatumumab 20 mg             Vorteil Teriflunomide 14 mg

                                                 Patienten mit jüngerem Alter oder einem niedrigeren EDSS
                                                       profitieren tendenziell stärker von Ofatumumab
              • CI, confidence interval; EDSS, Expanded Disability Status Scale; Gd+, gadolinium-enhancing; N, total number of patients included in the analysis
              •ªP-value for the type-3 test of the treatment by subgroup interaction is a heterogeneity test (the treatment effect is similar between subgroups if the test is non-significant). Model
              was adjusted for study, treatment for the overall analysis, with additional co-factors of subgroup, treatment by subgroup interaction for subgroup analysis. Natural log of the time-
              in-study was used as offset to annualize the relapse rate
              •Hauser S, et al. presented at EAN 2020, Poster Session P7.1-013
ASCLEPIOS I
Ofatumumab – sekundärer Endpunkt*:                                                                                                                                                  ASCLEPIOS II

Reduktion der Behinderungsverschlechterung                                                                                                                                          WIRKSAMKEIT

                                                   Behinderungsverschlechterung, bestätigt über 3 Monate
                                                                      (3M-confirmed disability worsening/CDW**)
                                          20

               Patienten mit 3M-CDW (%)
                                          18         Ofatumumab
                                          16         Teriflunomid                                                                                                                  Relative
                                          14                                                                                                                          34,4%        Risiko-
                                          12                                                                                                                                       Reduktiona
                                          10                                                                                                                                       p=0,002b
                                           8
                                           6
                                           4
                                           2
                                           0
                                               0        3         6             9             12             15             18             21             24             27   30     33
                                                                                                           Studienmonat
    Anzahl der Patienten mit Risiko einer Verschlechterung
    Ofatumumab                                 944     908      878            844            810           784            534            319            176            49    1
    Teriflunomid                               932     901      841            804            756           718            478            298            146             41   1

       Ofatumumab senkt das Risiko einer Behinderungsverschlechterung signifikant
                                                                                                                      Hazard-Ratio (95% CI): 0,675 (0,498; 0,916)
•*Komplettes Analyseset. gepoolte Analyse Asclepios I und II **CDW, bestätigte Behinderungs-Verschlechterung (confirmed disability worsening), sowohl abhängig als auch
unabhängig von Schüben (über CDP wird nur die Schubunabhängige Progression gemessen), CDW = Erhöhung von ≥1,5 EDSS Punkten bei Patienten mit einem Baseline EDSS von
0, oder Erhöhung von ≥1,0 EDSS Punkten bei Patienten mit einem Baseline EDSS von 1,0-5,0 oder Verschlechterung von ≥0,5 EDSS Punkten bei Patienten mit einem Baseline EDSS
von 5,5; aCox Regression. bZeigt statistische Signifikanz (2-seitig) bei dem 0.04875 Level.

•Hauser SL, et al. N Engl J Med. 2020;383:546–57;
Neue S1P Modulatoren

Ozanimod               ®
               (ZEPOSIA )
Ponesimod (Ponvory®)
Hochwirksame orale Therapieoptionen für den frühzeitigen
Einsatz bei aktiver RRMS
SUNBEAM und RADIANCE: Zwei große Phase-III-Studien mit
2.659 Patienten zum Vergleich von Ozanimod vs. IFN ß-1a bei RRMS

Multizentrisch, randomisiert, doppelblind, doppel-dummy, aktive Kontrollgruppe

                                                                       Aufdosierung
                                                                                      Ozanimod 0,92 mg oral (n = 447)                              Behandlung bis letzter Patient 12 Mo. in Studie

                      Randomisierung
SUNBEAM1                                                                              Ozanimod 0,46 mg oral (n = 451)                              Behandlung bis letzter Patient 12 Mo. in Studie
                             1:1:1
(n = 1.346)
                                                                                      IFN β-1a i.m. (Avonex) (n = 448)                             Behandlung bis letzter Patient 12 Mo. in Studie

                                                                      Aufdosierung
                                                                                      Ozanimod 0,92 mg oral (n = 433)

                      Randomisierung
RADIANCE2                                                                             Ozanimod 0,46 mg oral (n = 439)
                             1:1:1
(n = 1.313)
                                                                                      IFN β-1a i.m. (Avonex) (n = 441)

                                                                                                   Nur SUNBEAM:
                            Baseline                                0 Monate                         6 Monate                        12 Monate                                                  24 Monate

                 MRT:

Expanded Disability Status Scale (EDSS): Alle 3 Monate und zum Zeitpunkt eines Schubs. Alle MRT-Analysen wurden von einer verblindeten zentralen Bildgebungseinheit durchgeführt. IFN = Interferon;
MRT = Magnetresonanztomografie; RRMS = schubförmig remittierende Multiple Sklerose; i.m. = intramuskulär.
1) Comi et al. Lancet Neurol. 2019;18(11):1009-20. 2) Cohen et al. Lancet Neurol. 2019;18(11):1021-33.                                                                                                      51
Ozanimod reduzierte signifikant die annualisierte Schubrate1-4

       SUNBEAM (≥ 1 Jahr)                                                                                           RADIANCE (2 Jahre)
Adjustierte annualisierte Schubrate

                                                                                                                    Adjustierte annualisierte Schubrate
                                      0,6                                                                                                                 0,6

                                      0,5                                                                                                                 0,5

                                      0,4                               48 %                                                                              0,4                         38 %
                                                                       Reduktion                                                                                                     Reduktion
                                      0,3
                                                                       p < 0,0001                                                                         0,3
                                                                                                                                                                                     p < 0,0001

                                      0,2                                                                                                                 0,2

                                      0,1                                                                                                                 0,1

                                              0,35                          0,18                                                                                  0,28                    0,17
                                       0                                                                                                                   0
                                            IFN β-1a                     Ozanimod                                                                               IFN β-1a                Ozanimod
                                              30 µg                       0,92 mg                                                                                 30 µg                  0,92 mg
                                            (n = 448)                    (n = 447)                                                                              (n = 441)               (n = 433)

       1) Comi G et al. Lancet Neurol.2019;18(11):1009-1020. 2) Cohen JA et al. Lancet Neurol. 2019;18(11):1021-1033. 3) Comi G et al. AAN 2018 Annual Meeting, Los Angeles, USA; Poster 396.
       4) Cohen JA et al. AAN 2018 Annual Meeting, Los Angeles, USA; Poster 410.                                                                                                                    52
Signifikante Reduktion von neuen oder sich vergrößernden T2-Läsionen
unter Ozanimod

SUNBEAM (1 Jahr)1                                                                                          RADIANCE (2 Jahre)2

                                                                                                             Adjustierte mittlere Anzahl (95%-KI) von
 Adjustierte mittlere Anzahl (95%-KI) von

                                                                                                             neuen/sich vergrößernden T2-Läsionen
 neuen/sich vergrößernden T2-Läsionen

                                            6                                                                                                           6

                                            5
                                                             48 %                                                                                       5
                                                                                                                                                                         42 %
                                                            Reduktion                                                                                                   Reduktion
                                            4
                                                            p < 0,0001                                                                                  4
                                                                                                                                                                        p < 0,0001

                                            3                                                                                                           3

                                            2                                                                                                           2

                                            1                                                                                                           1

                                                  2,836                    1,465                                                                              3,183                    1,835
                                            0                                                                                                           0

                                                IFN β-1a                 Ozanimod                                                                           IFN β-1a                 Ozanimod
                                                  30 µg                   0,92 mg                                                                             30 µg                   0,92 mg
                                                (n = 448)                (n = 447)                                                                          (n = 441)                (n = 433)

KI = Konfidenzintervall; IFN = Interferon, GdE = Gadolinium-anreichernd; Die Analyse erfolgte mit einem negativen binomialen Regressionsmodell mit Datenanpassung nach Region (Osteuropa vs .Rest der Welt),
Alter und Anzahl GdE-Läsionen zu Studienbeginn; ln-Transformation der Anzahl verfügbarer Bilder in Monat 12 als Offset-Term. 1) Comi et al. AAN 2018, P396. 2) Cohen et al. AAN 2018, P410.                    53
Signifikante Reduktion von GdE-Läsionen unter Ozanimod

   SUNBEAM (1 Jahr)1                                                                                           RADIANCE (2 Jahre)2

                              0,6
                                                      63 %                                                                                  0,6
                                                                                                                                                                  53 %
Adjustierte mittlere Anzahl

                                                                                                              Adjustierte mittlere Anzahl
                                                  Reduktion                                                                                                   Reduktion
 an GdE-Läsionen (95%-KI)

                                                                                                               an GdE-Läsionen (95%-KI)
                              0,5                 p < 0,0001                                                                                0,5               p = 0,0006
                              0,4                                                                                                           0,4

                              0,3                                                                                                           0,3

                              0,2                                                                                                           0,2

                              0,1                                                                                                           0,1

                                      0,433                                  0,160                                                                  0,373                                0,176
                              0,0                                                                                                           0,0

                                    IFN β-1a                             Ozanimod                                                                 IFN β-1a                           Ozanimod
                                      30 µg                               0,92 mg                                                                   30 µg                             0,92 mg
                                    (n = 448)                            (n = 447)                                                                (n = 441)                          (n = 433)

   KI = Konfidenzintervall; IFN = Interferon; GdE = Gadolinium-anreichernd. Die Analyse erfolgte mit einem negativen binomialen Regressionsmodell mit Datenanpassung nach Region (Osteuropa vs .Rest der Welt),
   Alter und Anzahl GdE-Läsionen zu Studienbeginn; ln-Transformation der Anzahl verfügbarer Bilder in Monat 12 als Offset-Term. 1) Comi G et al. AAN 2018, P396. 2) Cohen JA et al. AAN 2018, P410.               54
Geringe Rate an Behinderungsprogression unter Ozanimod1

Wahrscheinlichkeit einer über 12 Wochen anhaltenden Behinderungsprogression2

                                                                                                                                                                            IFN β-1a 30 µg
 Behinderungsprogression

                           0,4                                                                                                                                              Ozanimod 0,92 mg
     Anteil Patienten
     mit anhaltender

                           0,2

                            0

 IFN β-1a 30 g
 Ozanimod 0,92 mg

                                   Tag 1             Monat 3            Monat 6             Monat 9           Monat 12            Monat 15           Monat 18            Monat 21           Monat 24

  Der Anteil Patienten mit einer dauerhaften Behinderungsprogression nahm im Laufe der Behandlung
  nur langsam zu und lag nach 24 Monaten zwischen 8,0 und 10,2 %.
EDSS = Expanded Disability Status Scale; IFN = Interferon; NS = nicht signifikant; NE = nicht evaluierbar aufgrund des hierarchischen statistischen Analyseverfahrens.
1) Cohen et al. ECTRIMS 2017, Oral Presentation # 280. 2) Zeit bis zur über 3 Monate bestätigten Behinderungsprogression wurde analysiert unter Verwendung der Cox-Regression, angepasst an die Region, das
Ausgangsalter und den Ausgangs-EDSS-Score. Geschätzte Anteile basieren auf Kaplan-Meier-Schätzungen. Die Patienten in SUNBEAM verblieben so lange auf Therapie, bis der letzte randomisierte Patient 12 Monate
abgeschlossen hatte; durchschnittliche Behandlungsdauer 13,6 Monate.                                                                                                                                          55
Ozanimod / Ponesimod: Anwendung Kurzübersicht

                                                     Zur Anwendung bei erwachsenen Patienten mit
                                       schubförmig remittierender Multipler Sklerose (RRMS) mit aktiver Erkrankung,
                                                   definiert durch klinische oder bildgebende Befunde

Empfohlene Dosis:                            Keine Prä- oder                                 Einnahme zu           Die meisten Patienten Keine Geno-typisierung
0,92 mg Ozanimoda                            Begleitmedikation                               einer Mahlzeit oder   benötigen keine
1 x täglich                                  notwendig                                       unabhängig davon      kardiale Über-
(oral, Hartkapsel)                                                                                                 wachung bei
                                                                                                                   der Erstdosis.        Kürzere Halbwertzeit /
                                                                                                                                         schnellere Reversibilität

•   Ozanimod Fachinformation, aktueller Stand. a Zu Behandlungsbeginn erfolgt eine schrittweise Aufdosierung.                                                 56
In Kürze zu erwarten: Diroximelfumarat
• Diroximelfumarat (DRF),
  schnelle präsystemische
  Hydrolyse zu Monomethyl-
                                                                                                                  −
  fumarat

                                                                                   DRF                                       MMF
                                                                                                                      (aktiver Metabolit)

• Niedrigere Inzidenz von GI
  mit DRF als mit DMF (Therapieabbruch durch GI-Nebenwirkungen < 1% bei DRF-
  behandelten Patienten*)

                                                                                                                                                                  Biogen-82344
  Diroximelfumarat ist nicht zugelassen in der EU; MMF: Monomethylfumarat, DMF: Dimethylfumarat; *Wundes et al., präsentiert beim AAN virtual meeting, Mai 2020
OPTIMIERUNG DER PATIENTENERFAHRUNG          INDIVIDUELLES PATIENTENMANAGEMENT                   FORTSCHRITTE BEI ERGEBNISPARAMETERN

Diroximel Fumarate and Dimethyl Fumarate Demonstrate Early Radiological Efficacy
in Relapsing-Remitting Multiple Sclerosis
Singer BA, Shafer SJ, Arnold DL, et al.

                     Bei Patienten, die EVOLVE-MS-2 abgeschlossen hatten und anschließend
                an EVOLVE-MS-1 teilnahmen, war eine signifikante Reduktion der mittleren Anzahl
                                         der Gd+-Läsionen zu beobachten
                                                                                                                                                                      314 Patienten
                                                                                                                                                              Bis 7. Februar 2020 hatten 314 Patienten
                                                                                                       p
OPTIMIERUNG DER PATIENTENERFAHRUNG   INDIVIDUELLES PATIENTENMANAGEMENT   FORTSCHRITTE BEI ERGEBNISPARAMETERN

Schlussfolgerungen

                          Die Zwischenauswertung der noch laufenden Studie EVOLVE-MS-1 zeigt, dass die jährliche prozentuale
                          Veränderung des Hirnvolumens in dieser Subgruppe von Patienten mit DRF-Therapie (n=447) –0,38
                          (0,60) in Jahr 1 und –0,35 (0,56) in Jahr 2 betrug; dieses ähnelt der Rate bei gesunden Erwachsenen und
                          ist konsistent mit den Beobachtung aus den DMF Studien.

     • Etwa 89,3% der Patienten mit DRF-Therapie blieben über 2 Jahre frei von bestätigter Behinderungsprogression
     • In dieser Subgruppe wurden keine neuen oder unerwarteten Sicherheitsbefunde beobachtet
     • Die Rate der gastrointestinalen Nebenwirkungen betrug 36,0%, und die Rate der gastrointestinalen Nebenwirkungen,
       die zum Therapieabbruch führten, betrug 0,2%

                                                                                                                                                                                      BIOGEN-116611
Oh J et al. Virtual AAN Annual Meeting, 17.−22. April 2021, P15.097.
In der Pipeline:

BTK Inhibitoren:
EVOBRUTINIB (Merck)
Tolebrutinib (Sanofi/Genzyme)

             Evobrutinib reactive deck. GL-EVO-00010 | Approved December 2020. For reactive use only.
Bruton’s tyrosine kinase (BTK) is a key enzyme for development and
 function within lymphoid and myeloid cells in the periphery and CNS1,2
              Hematopoietic stem cell

                                                                                          Common myeloid
                                                                                          progenitor
             Common                                                                                                                                  The BTK protein is a TEC family
            lymphoid                                                                                                                                 kinase that is a key regulator of
           progenitor
                                                                                                                                                       adaptive and innate immune
                                                                                                                                                               signaling1–4
No BTK                                              Monocyte
expression                                                                      Immature
in T or NK                                                                     dendritic cell                                                            In mouse models of MS,
cells
                                                                                                                                                       BTK knockout is associated with
                                                                                                                                                      improved outcomes and reduced
                                                                                                                                                             disease severity5,6

               T cell          B cell           NK cell          Macrophage      Dendritic cell   Neutrophil     Eosinophil   Basophil

                   Adaptive
                                                                                                                                                       BTK inhibition may target
                                                                           Innate immune cells
                 immune cells                                                                                                                            multiple autoimmune
                                                                         In addition to expression in cells                                                responses in MS
 Figure adapted from Chaplin
 DD. Allergy Clin Immunol                                                of the immune system, BTK is also
 2010;125(Suppl. 2):S3–23                                                found in a subset of astrocytes7

 BTK, Bruton’s tyrosine kinase; CNS, central nervous system; NK, natural killer; TEC, protein tyrosine kinase gene
 1. Hendriks RW. Nat Chem Biol 2011;7:4–5; 2. López‐Herrera G et al. J Leukoc Biol 2014;95:243–50; 3. Crofford LJ et al. Expert Rev Clin Immunol 2016;12:763–73; 4. Alankus YB et al.
 ECTRIMS 2018 [P557]; 5. Svensson L et al. Eur J Immunol 2002;32:1939–46; 6. Mangla A et al. Blood 2004;104:1191–7; 7. Martin E et al. Brain Plasticity 2020;5:123–33
                                                                                                        61

                                                       Evobrutinib reactive deck. GL-EVO-00010 | Approved December 2020. For reactive use only.
BTK signaling is estimated to return to pre-inhibition levels within
one week1,2

                Active B cells                                                     Inhibited B cells                                            Active B cells

                  Before                                                                   After                                                ~1 week after
                BTK inhibitor                                                           BTK inhibitor                                            BTK inhibitor
               administration                                                          administration                                             cessation

                                                                                                               BTK signaling is estimated
                                                                                                               to return to pre-inhibition
                                                                                                                 levels within one week
                                                                                                               due to new BTK protein
                                                                                           B-cell                       synthesis
                                                                                         inhibition
      Simplified graphic for illustrative purposes

BTK, Bruton’s tyrosine kinase
1. Evans EK et al. J Pharmacol Exp Ther 2013;346:219–28; 2. Haselmayer P et al. J Immunol 2019;202:2888–906
 62                                                                                                62

                                                     Evobrutinib reactive deck. GL-EVO-00010 | Approved December 2020. For reactive use only.
Phase II study: Primary endpoint: total number of T1 Gd+ lesions at
Weeks 12–24 (mITT)1,2

               8
               7
               6                                                                                                                                                           4.78 (22.05)
   Mean (SD)

                                                                 4.06 (8.02)
               5                       3.85 (5.44)
               4
               3                                                                            1.69 (4.69)
               2
                                                                                                                       1.15 (3.70)
               1
               0
                                        Placebo               Evobrutinib                Evobrutinib                Evobrutinib                                             Dimethyl
                                         n=53                  25 mg qd                   75 mg qd                   75 mg bid                                             fumarateb
                                                                 n=50                       n=51                       n=53                                                   n=54
                                                                     1.45                       0.30                        0.44
               Lesion rate ratioa [95% CI]
                                                                 [0.72–2.91]                [0.14–0.63]                 [0.21–0.93]              Adapted from N Engl J Med, Montalban X et al, Placebo-controlled trial
                                                                                                                                                   of an oral BTK inhibitor in multiple sclerosis, vol. 380, pp 2406–17.
               Adjusted p-value vs placebo                            0.32                       0.005                       0.06                   Copyright © (2019) Massachusetts Medical Society. Reprinted with
                                                                                                                                                                        permission from Massachusetts Medical Society
               Unadjusted p-value vs placebo                          0.29                       0.002                       0.03

                               By Week 12, a reduction in the mean number of T1 Gd+ lesions was seen in the
                                     evobrutinib 75 mg bid group compared with the placebo group2
aBased  on a negative binomial model for total lesion count (summed over available scans through Week 24) that adjusts for baseline lesion activity. Scans collected within
3 weeks of high-dose corticosteroid use are considered missing. Patients missing all post-baseline scans have total lesion count imputed. p-values are adjusted/unadjusted for multiplicity;
bOne patient in the dimethyl fumarate group had 46 lesions at baseline and a total of 160 lesions over 3 post-baseline scans and was considered a T1 Gd+ outlier

bid, twice daily; CI, confidence interval; Gd+, gadolinium-enhancing; mITT, modified intention-to-treat population; qd, once daily; SD, standard deviation
1. Montalban X et al. N Engl J Med 2019;380:2406–17; 2. Montalban X et al. AAN 2019 [S5.6-004]
                                                                                                           63

                                                         Evobrutinib reactive deck. GL-EVO-00010 | Approved December 2020. For reactive use only.
Phase II study: ARR at Week 24 and Week 48 (mITT)

                                                  0.57
                          0.6
                                              (0.30–0.97)
                                                                                                                                                           0.52
Unadjusted ARR (95% CI)

                                                                                                                                                       (0.33–0.78)
                          0.5

                                    0.37                                                                                                  0.37
                          0.4
                                (0.17–0.70)                                                                                           (0.21–0.59)

                          0.3                                                                                                                                            0.25
                                                                                                                                                                     (0.12–0.44)
                                                                                                            0.20
                          0.2                                                                           (0.06–0.47)
                                                                    0.13                                                                                                                             0.14
                                                                (0.03–0.38)                                                                                                            0.11      (0.06–0.29)
                                                                                      0.08                                                                                         (0.04–0.25)
                          0.1                                                     (0.01–0.30)

                           0
                                  Placebo     Evobrutinib Evobrutinib             Evobrutinib             Dimethyl                     Placebo–   Evobrutinib Evobrutinib Evobrutinib             Dimethyl
                                   n=53        25 mg qd    75 mg qd                75 mg bid              fumarate                    evobrutinib  25 mg qd    75 mg qd    75 mg bid              fumarate
                                                 n=50        n=51                    n=53                   n=54                       25 mg qda     n=50        n=51        n=53                   n=54
                                                                                                                                         n=53

                                                                   Weeks 0–24                                                                                    Weeks 0–48
               Adapted from N Engl J Med, Montalban X et al, Placebo-controlled trial of an oral BTK inhibitor in multiple sclerosis, vol. 380, pp 2406–17.
               Copyright © (2019) Massachusetts Medical Society. Reprinted with permission from Massachusetts Medical Society
               aPatients
                       switched from placebo to evobrutinib 25 mg qd for the second 24-week treatment period
               ARR, annualized relapse rate; bid, twice daily; CI, confidence interval; mITT, modified intention-to-treat population; qd, once daily
               Montalban X et al. N Engl J Med 2019;380:2406–17
                                                                                                                           64

                                                                        Evobrutinib reactive deck. GL-EVO-00010 | Approved December 2020. For reactive use only.
EVOLUTION RMS Phase III studies trial design:
NCT04338022 and NCT043380611–4
    Two randomized, parallel-group, double-blind, active-controlled Phase III studies of oral evobrutinib bid
    vs oral teriflunomide qd in patients with RMS, with the objective of evaluating efficacy and safety

                                                                MAIN STUDY PERIOD                                                          OPTIONAL OLE PERIOD

   Main inclusion criteria
                                                  Evobrutinib 45 mg bid
   • Patients with RRMS or                        and oral placebo qd (n=~465)
     SPMS with relapses
   • Baseline EDSS score                                                                                                        Evobrutinib 45 mg bid
     0–5.5 (if EDSS score
     ≤2, disease duration
     must be ≤10 years)                           Teriflunomide 14 mg qd
                                                  and oral placebo bid (n=~465)                                                                                                              OLE
                                                                                                                  Safety                                                                    safety
                            Screening                            Treatment period                               follow-up                 OLE treatment period                            follow-up
                             4 weeks                                96 weeksa                                   4 weeksb                      ~144 weeks                                   4 weeks

                                    Randomization                                                 Primary endpoint                                                                     OLE
                                        (1:1)                                                         analysis                                                                       analysis
aParticipants experiencing initial progression of disability between Weeks 72 and 96 will continue participating in the main study for up to 12 additional weeks. The continuation period will
increase the duration of participation to a maximum of 108 weeks; bFor participants who do not enter the OLE period, the follow-up/discontinuation visit will be performed 4 weeks after the
last study interventions administration. For participants entering the OLE, there will be no 4-week follow-up period between the main study and the OLE
bid, twice daily; EDSS, Expanded Disability Status Scale; OLE, open-label extension; RMS, relapsing MS; RRMS, relapsing–remitting MS; qd, once daily; SPMS, secondary progressive MS
1. US National Library of Medicine. https://clinicaltrials.gov/ct2/show/NCT04338022 [Accessed April 30, 2020]; 2. US National Library of Medicine.
https://clinicaltrials.gov/ct2/show/NCT04338061 [Accessed April 30, 2020]; 3. Montalban X et al. AAN 2020 [P9.008]; 4. Data on File
                                                                                                           65

                                                         Evobrutinib reactive deck. GL-EVO-00010 | Approved December 2020. For reactive use only.
VielenVielen
      Dank für  Ihre
             Dank fürAufmerksamkeit
                     Ihre Aufmerksamkeit

    Kontakt: phil.albrecht@gmail.com
Sie können auch lesen