RENEWABLE ENERGY OUTLOOK 2030 - ISUSI
←
→
Transkription von Seiteninhalten
Wenn Ihr Browser die Seite nicht korrekt rendert, bitte, lesen Sie den Inhalt der Seite unten
Supported by Ludwig Bölkow Stiftung

Renewable Energy Outlook 2030
Energy Watch Group Global Renewable Energy Scenarios

         Executive Summary

Authors:
Stefan Peter, Harry Lehmann

iSuSI Sustainable Solutions and Innovations
Gutsstraße 5, 04416 Markkleeberg Germany
www.isusi.de, info@isusi.de

World Council for Renewable Energy (WCRE), c/o EUROSOLAR, Kaiser-
Friedrich-Straße 11, 53113 Bonn Germany
www.wcre.org, info@wcre.org

Scientific and parliamentarian advisory board:
see at www.energywatchgroup.org

© Energy Watch Group / Ludwig-Boelkow-Foundation
  Quoting and partial reprint allowed with detailed reference and by
  sendig a deposit copy.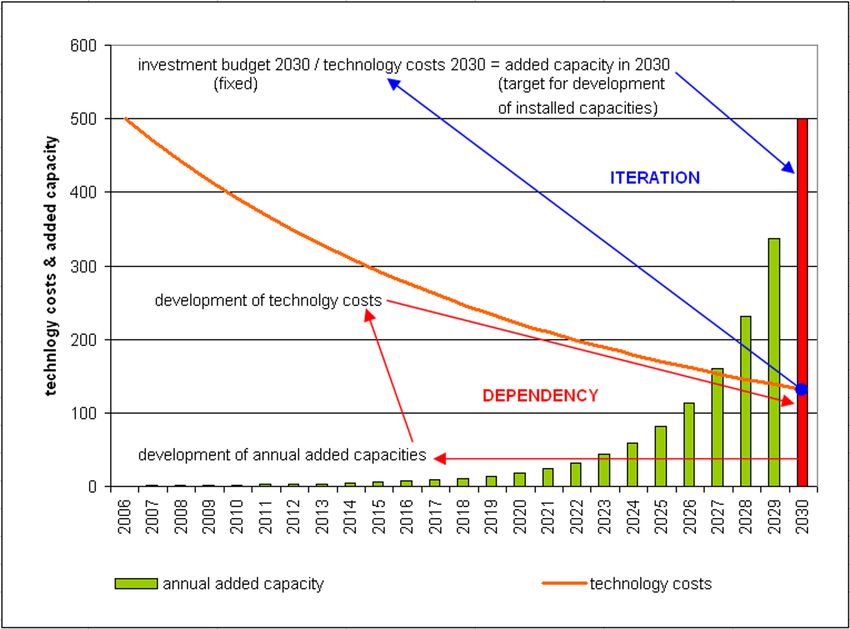
REO 2030                                                                  V0810

About Energy Watch Group

Energy policy needs objective information.

The Energy Watch Group is an international network of scientists and
parliamentarians. The supporting organization is the Ludwig-Bölkow-
Foundation. In this project scientists are working on studies independently of
government and company interests concerning

   •   the shortage of fossil and nuclear energy resources,

   •   development scenarios for regenerative energy sources

   as well as

   •   strategic deriving from these for a long-term secure energy supply at
       affordable prices.

The scientists are therefore collecting and analysing not only ecological but
above all economical and technological connections. The results of these
studies are to be presented not only to experts but also to the politically
interested public.

Objective information needs independent financing.

A bigger part of the work in the network is done unsalaried. Furthermore the
Energy Watch Group is financed by donations, which go to the Ludwig-
Boelkow-Foundation for this purpose.

More details you can find on our website and here:

Energy Watch Group
Zinnowitzer Straße 1
10115 Berlin Germany
Phone +49 (0)30 3988 9664
office@energywatchgroup.org
www.energywatchgroup.org

                                   Page 2 of 57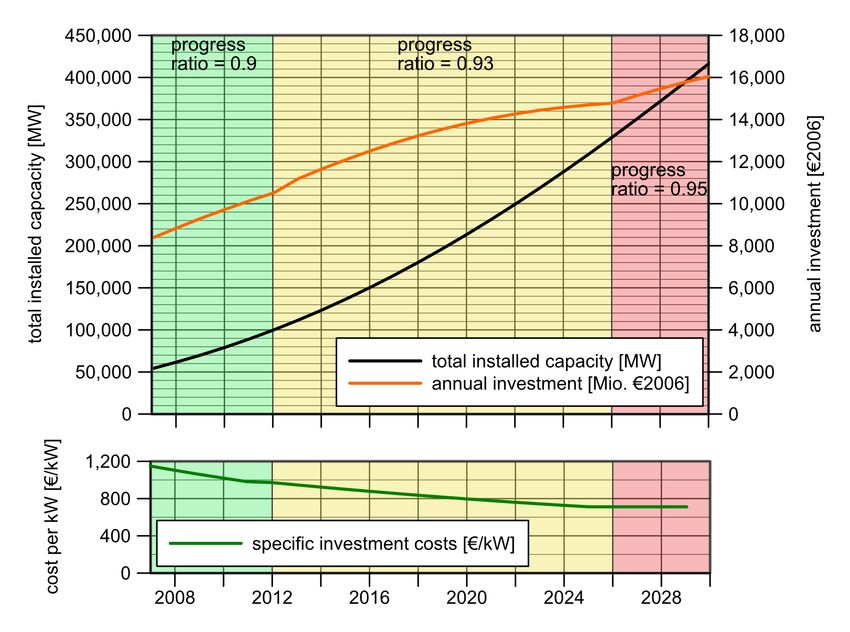
REO 2030                                                                                                                              V0810

Content
  Zusammenfassung.......................................................................................................................4
  Introduction...............................................................................................................................16
  Methodology.............................................................................................................................18
     General calculation approach...............................................................................................19
     Interaction of investment budget and technologies' cost decrease.......................................21
     General growth assumption..................................................................................................22
  Investment budgets for renewable Energy technologies...........................................................25
     Investment budgets in the REO 2030 Scenarios..................................................................26
     Distribution of investments to technologies.........................................................................28
  Development of technology costs.............................................................................................31
     Development of investment budgets in the Scenarios..........................................................35
  Development of electricity generating capacities and electricity production...........................39
     High Variant Scenario: General development in the global context....................................39
     Low Variant Scenario: General development in the global context.....................................43
     Electricity production in the “High Variant” scenario..........................................................45
     Electricity production in the “Low Variant” scenario..........................................................46
  Development of Final Energy Supply.......................................................................................47
     Final Energy Demand in the WEO 2006 Alternative Scenario............................................47
     Shares at Final Energy Supply in the “High Variant” scenario............................................48
     Shares of Final Energy Supply in the “Low Variant” scenario............................................50
     Why this study does not show primary energy figures........................................................53
  Reality check.............................................................................................................................55

                                                             Page 3 of 57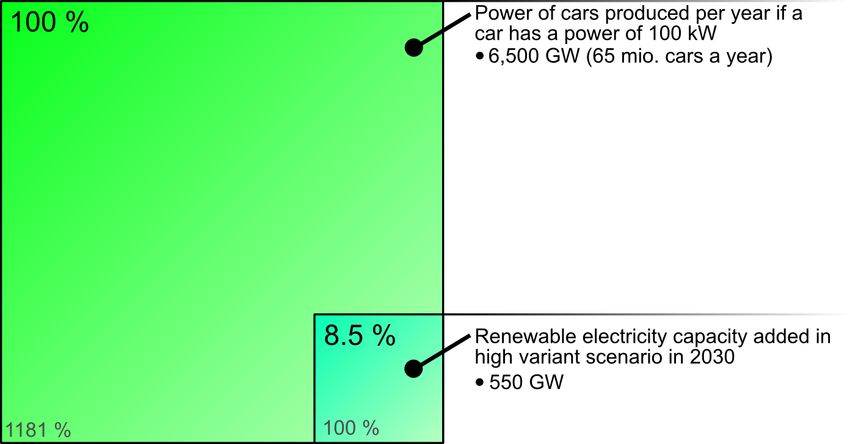
REO 2030                                                                                      V0810

                                      Zusammenfassung

Ziel dieser Studie ist es, eine alternative und – aus unserer Sicht – realistischere Perspektive der
zukünftigen Rolle Erneuerbarer Energien in der globalen Energieversorgung zu präsentieren. Die
dargestellten Szenarien basieren auf der in den letzten Jahrzehnten zu beobachtenden
Entwicklung und Markteinführung Erneuerbarer Energien in den unterschiedlichen
Weltregionen. Das Hauptaugenmerk der Szenarien liegt darauf, wie schnell eine
Markteinführung Erneuerbarer Energien in den unterschiedlichen Regionen stattfinden könnte
und welche finanziellen Belastungen sich durch diese Investitionen für die Gesellschaft ergeben
würde. Um dieser Aufgabe gerecht zu werden, wurden viele Faktoren, wie Technologiekosten &
Lernkurven für Herstellungskosten, Investitionen, die unterschiedliche wirtschaftliche
Leistungsfähigkeit der Weltregionen, verfügbare Potenziale und der Verlauf des Wachstums,
berücksichtigt.

Natürlich stellen die hier vorgestellten Szenarien lediglich zwei Möglichkeiten der zukünftigen
Entwicklung dar – unter vielen anderen Möglichkeiten, aber sie repräsentieren realistische
Möglichkeiten für die Zukunft der Erneuerbaren, die Anlass zu Optimismus geben. Die
Ergebnisse der Szenarien zeigen, dass die Erzeugungskapazitäten– bis 2030 – in weit größerem
Umfang ausgebaut werden können und das dies wesentlich kostengünstiger ist, als vielfach –
auch von wissenschaftlicher Seite – gedacht und oftmals befürchtet.

Eine starke Unterstützung von politischer Seite her und ein hindernisfreier Zugang zum Markt
vorausgesetzt, bestimmen letztlich die Investitionssummen über den weiteren Ausbau
erneuerbarer Energietechnologien. Für die „REO 2030“ Szenarien wurde eine über die Zeit
wachsende Bereitschaft für Investitionen eine saubere, sichere und nachhaltige
Energieversorgung angenommen. Beginnend mit kleineren Summen, setzen die Szenarien
voraus, dass bis zum Jahr 2030 ein bestimmter Investitionsbetrag pro Kopf der Bevölkerung
erreicht werden kann. Dieses Investitionsziel unterscheidet sich für jede der zehn Regionen
innerhalb der Szenarien (siehe Table 1). Die zwei Szenarien. „Low Variant“ (untere Variante)
und „High Variant“ (obere Variante) genannt unterscheiden sich hinsichtlich der gesetzten
Investitionsziele dergestalt, dass in der oberen Variante („High Variant) im Jahr 2030 im globalen
Durchschnitt eine Investitionssumme von 124 € pro Kopf der Weltbevölkerung erreicht werden
kann, in der unteren Variante („Low Variant“) jedoch nur die Hälfte dieses Betrags (62 € pro
Kopf und Jahr).

Dieser Szenarienansatz bedingt, dass auch die Verringerung der spezifischen Technologiekosten,
welche mit der Ausweitung der Produktion einhergeht, berücksichtigt wird. Um diesem Umstand
Rechnung zu tragen, wurde die Kostenverringerung jeder Technologie, berechnet auf Basis der
Investitionen in die jeweilige Technologie und dem daraus resultierenden Anwachsen der
Produktionsmengen, in den Szenarien berücksichtigt.

                                            Page 4 of 57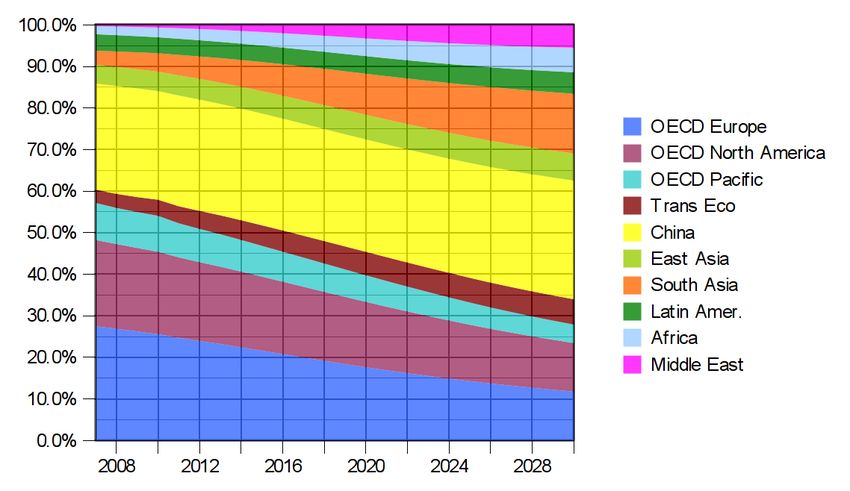
REO 2030                                                                                                  V0810

In der Hauptsache befassen sich die Szenarien mit dem Aspekt der Elektrizitätsversorgung, die
Wärmeseite der Energieversorgung wird teilweise behandelt, Treibstoffe hingegen gar nicht
betrachtet.

Die Entwicklung des globalen Endenergiebedarfs, auf welchen in den Szenarien Bezug
genommen wird, wurde aus dem „World Energy Outlook 2006“ (WEO 2006) der Internationalen
Energieagentur (IEA) übernommen.1

Bezogen auf den globalen Maßstab, zeigen die Ergebnisse des “High Variant”Szenarios eine
Deckung von 29% des Endenergiebedarfs aus Erneuerbaren Energien in 2030. In der unteren
Variante („Low Variant“), welche mit halb so großen Investitionen auskommt, kann eine 17%ige
Deckung erreicht werden.

1 Obwohl zwischenzeitlich der neuere „World Energy Outlook 2007“ veröffentlicht wurde, ist die Referenz auf die
  Daten des WEO 2006 beibehalten worden. Dies liegt darin begründet, dass sich beide Publikationen hinsichtlich
  der angenommenen zukünftigen Entwicklung des Energieverbrauchs nur geringfügig unterscheiden. So
  unterscheidet sich beispielsweise der Primärenergiebedarf im „Alternative Policy Szenario“ beider Publikationen
  lediglich um 1,6%.

                                                 Page 5 of 57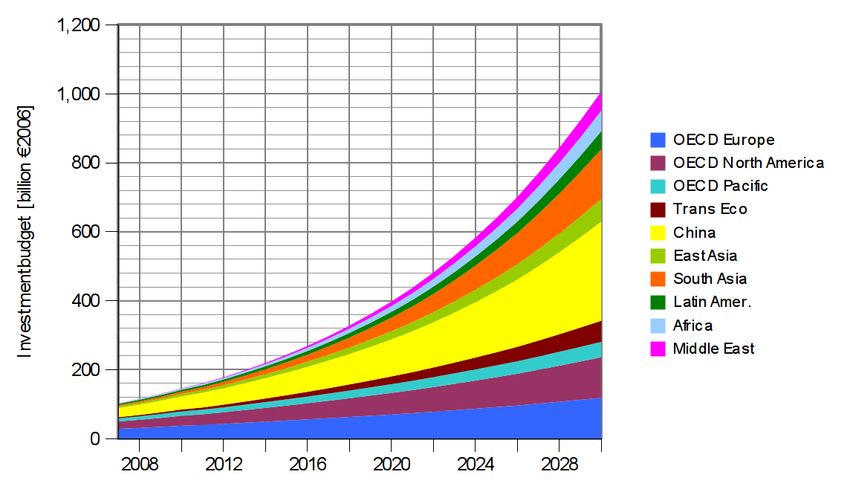
REO 2030                                                                                                                             V0810

    Der erste Balken (grau, ohne Schraffur) zeigt den globalen Endenergiebedarf (nur Strom und Wärme) für das Jahr 2005, ohne
    Unterscheidung zwischen erneuerbaren und nicht-erneuerbaren Energien. Die Balken 2 und 3 zeigen die weitere Entwicklung des
    Endenergiebedarfs bis 2030, den aus den Szenarien resultierenden Anteil Erneuerbarer Energien (grün) und den verbleibenden
    fossilen und nuklearen Anteil. Der vierte Balken zeigt die Werte für die OECD Länder (senkrecht schraffiert, grün für Erneuerbare,
    schwarz für fossil und nuklear) und entsprechend die nicht-OECD Länder (waagerecht schraffiert). Die Balken 5 und 6 zeigen
    jeweils detailliertere Ergebnisse für die OCED Länder (Balken 5) und die nicht_OECD Länder (Balken 6). Hierbei sind jeweils
    Strom nach Rechts ansteigend und Wärme nach Rechts abfallend schraffiert. Wieder sind die Erneuerbaren grün abgebildet, die
    fossilen und nuklearen diesmal jedoch grau)

Figure 1: Final electricity and heat demand and renewable shares in 2030 in the High Variant (upper
figure) and the Low Variant scenario (lower figure) [EWG; 2008]. Final Energy Demand: [IEA; 2006]

Die Ergebnisse der oberen Variante der Szenarien laufen darauf hinaus, dass im Jahr 2030 in der
Gesamtheit der OECD Länder 54 % des Stroms und mehr als 13% der Wärme (jeweils
Endverbrauch) aus erneuerbaren Quellen gedeckt werden kann. Insgesamt beläuft sich damit der

                                                             Page 6 of 57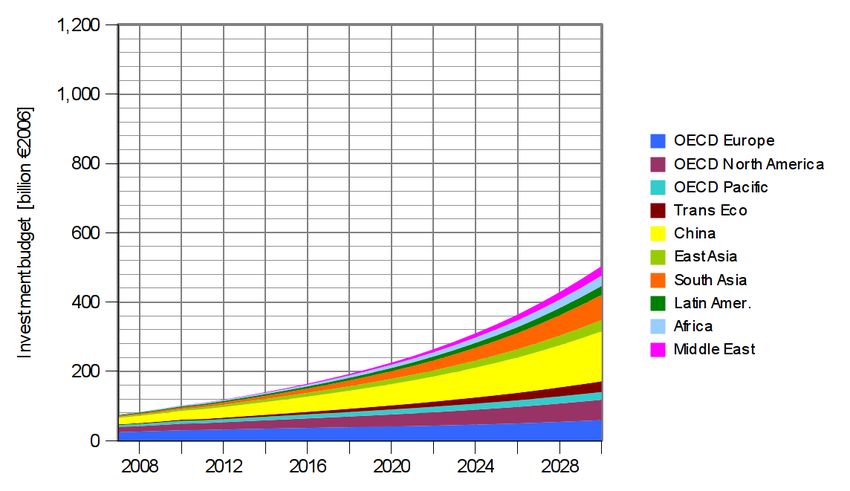
REO 2030                                                                                     V0810

Anteil der Erneuerbaren auf 27% (17% in der unteren Variante, dabei etwa ein Drittel des Stroms
und 8% der Wärme). Die Gesamtheit der nicht-OECD Länder steigt der Anteil erneuerbarer in
der oberen Variante insgesamt auf 30% (18% in der unteren Variante) Dabei können die
Erneuerbaren im Jahr 2030 beinahe 68% des Stroms und 17% der Wärme decken; in der unteren
Variante sind die 36% beim Strom und 11% bei der Wärme.

Die Szenarien zeigen, dass die Erneuerbaren Energien das Potenzial besitzen einen bedeuten
Beitrag im Kampf gegen den Klimawandel, zur Verringerung der Abhängigkeit von fossilen
Energieträgern und zur Beendigung der Nutzung der Atomkraft zu leisten. Zwar steigt die
Energieerzeugung aus fossilen und nuklearen Energieträgern in den Szenarien bis 2020 so weiter
an, dass zu diesem Zeitpunkt mehr Energie aus ihnen gewonnen wird als der gesamte Strom und
Wärmebedarf des Jahres 2005. Doch selbst in der unteren Variante der Szenarien fällt dieser
Beitrag zum Jahr 2030 hin wieder leicht ab. In der oberen Variante findet zwischen 2020 und
2030 ein bemerkenswerter Rückgang der Energieerzeugung der Fossilen und Nuklearen statt, so
dass deren Energieerzeugung wieder unter das Maß des des gesamten Strom- und Wärmebedarfs
des Jahres 2005 fällt.

                                    Investment per capita and Total investment budgets
                                           year in 2030                in 2030
                 World Region             [€2006/cap*a]            [billion €2006]
                                   Low Variant High Variant       Low          High
                                                                Variant       Variant
            OECD Europe                111             223         60           121
            OECD North America         110             220         59           118
            OECD Pacific               112             224         22            44
            Transition Economies        91             180         31            60
            China                      102             204        149           299
            East Asia                   41              81         33            66
            South Asia                  35              71         73           147
            Latin America               46              91         26            52
            Africa                      20              41         30            59
            Middle East                101             202         28            55
            All regions                 62             124        510          1021
Table 1: Target investment 2030 per capita and year in different regions considered in the
scenarios. All regions start with a low amount in 2010. [EWG; 2008]

In absoluten Zahlen ausgedrückt belaufen sich die Investitionen in erneuerbare
Erzeugungskapazitäten im Jahr 2030 auf etwa 510 Milliarden € in der unteren Variante und auf
etwa 1.021 Milliarden € in der oberen Variante der Szenarien. Der größte Einzelinvestor zu
dieser Zeit ist China, gefolgt von Südasien – beide Regionen stellen beträchtliche Anteile der, bis
dahin auf über acht Milliarden Menschen angestiegenen Weltbevölkerung – und OECD Europa
das zwar über wesentlich weniger Einwohner verfügt, aber deutlich höhere pro Kopf
Investitionen in 2030 erreicht. Die geringsten Investitionen werden in Lateinamerika (Latin
America), dem Mittleren Osten (Middle East), Afrika (Africa) und schließlich den pazifischen
OECD Ländern (OECD Pacific) erreicht.

                                           Page 7 of 57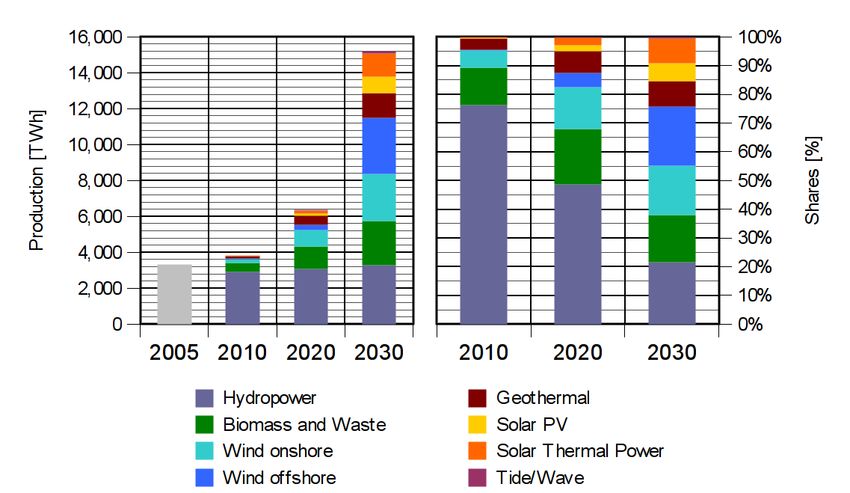
REO 2030                                                                                  V0810

Investitionen in der hier aufgezeigten Größenordnung sind oftmals etwas abstrakt oder
erscheinen als unüberwindbares Hindernis. Um ein besseres Gefühl dafür zu vermitteln, was
solche Summen in unserer heutigen Welt bedeuten, werden in der Darstellung 2 (Figure 2),
neben den Investitionen in Erneuerbare Energien in den Szenarien, auch die globalen
Militärausgaben des Jahres 2005 dargestellt [SIPRI; 2006]. Ausschließlich in der oberen Variante
werden im Jahr 2030 Investitionen erreicht, die in ihrer Höhe mit den Militärausgaben des Jahres
2005 vergleichbar sind. Ein weiterer konkretisierender Vergleich ergibt sich aus den jährlichen
Ausgaben für Kultur, die 2005 auf jeden Einwohner Deutschlands entfielen: diese beliefen sich
auf etwa 100€ pro Kopf [DESTATIS; 2008].

Laut eines von United International Press im Februar 2008 veröffentlichten Artikels, beliefen
sich die weltweiten Ausgaben für Erneuerbare Energien im Jahr 2007 auf etwa 117 Milliarden
US Dollar oder etwa 84 Milliarden Euro (grüner Punkt in Figure 2), also zwischen den
angenommen Investitionen beider „REO 2030“ Szenarien

                                          Page 8 of 57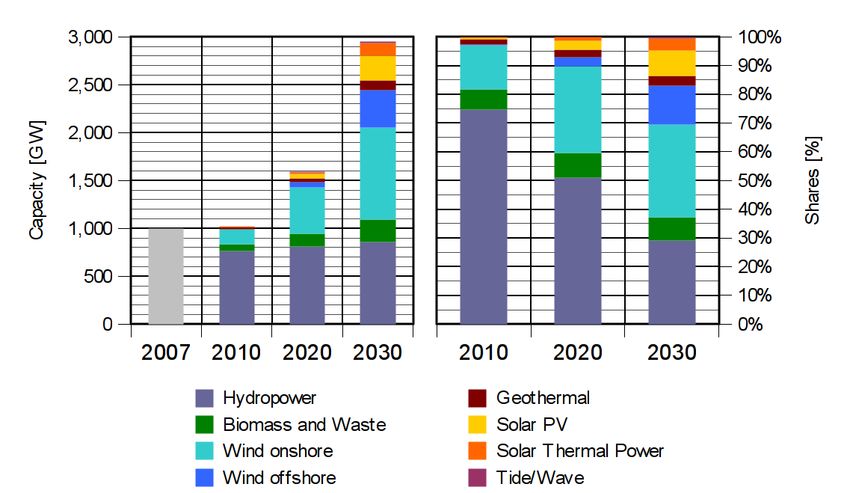
REO 2030                                                                                                                        V0810

    Die farbigen Flächen und Markierungen auf der linken Y_Achse zeigen absolute Investitionssummen, während die gestrichelte
    Linie und Markierungen auf der rechten Y_Achse Investitionen pro Kopf in globalen Durchschnitt anzeigen.

Figure 2: Development of investment budgets in the world regions in the ”High Variant” (upper figure)
and ”Low Variant Scenario” (lower figure) [EWG; 2008]. Data on military expenditures: [SIPRI; 2006].
Data on REN investment 2007 [UPI; 2008].

Bei der Entwicklung – und schließlich den erreichten – Erzeugungskapazitäten der Erneuerbaren
ist der Unterschied zwischen der unteren und oberen Variante größer, als dies bei den
Investitionsvolumina der Fall ist.Werden in der oberen Variante im Jahr 2030 insgesamt 4.450
GW Erzeugungskapazität der „neuen“ Erneuerbaren (EE ohne Wasserkraft) erreicht, ist dies in
der unteren Variante – mit 1.840 GW – weniger als die Hälfte.

                                                           Page 9 of 57
REO 2030                                                                                          V0810

Figure 3: Development of “new” renewable electricity generating capacities in the world regions in the
”High Variant” (upper figure) and ”Low Variant Scenario” (lower figure) [EWG; 2008].Data on
renewable capacity 2007: [REN 21; 2007].

Der bei weitem größte Teil der in 2030 erreichten Kapazität wird durch die onshore und offshore
Windenergie gestellt. Generell zeigen alle Technologien in der oberen Variante ein deutlich
höheres Wachstum, aber im Vergleich beider Szenarien kann die Photovoltaik als der große
Gewinner gesehen werden. Stellt diese in der unteren Szenarienvariante in 2030 das viertgrößte
Erzeugungskontingent, erreicht sie in der oberen Variante Platz zwei. Biomasse & Reststoffe
(Biomass & Waste) folgen auf dem dritten Platz (zweiter Platz in der unteren Variante).

                                             Page 10 of 57
REO 2030 V0810
Geringere Beiträge zur gesamten Erzeugungskapazität entfallen auf die Geothermie und
Gezeiten, Wellen & Meeresenergie (Tidal, Wave and other Maritimes; siehe Figure 3).
Die Szenarien beschäftigen sich mit dem Ausbau der sog. „neuen“ Erneuerbaren, was
Wasserkraft als Bestandteil der Ausbauszenarien und somit auch aus den aufgezeigten
Investitionen ausschließt. Nichtsdestotrotz wurde der geplante Ausbau der Wasserkraft in den
verschiedenen Regionen berücksichtigt (von heute etwa 762 GW auf etwa 856 GW in 2030), da
Wasserkraft heute der bedeutendste erneuerbare Stromerzeuger ist und auch im Jahr 2030 noch
eine wichtige – wenn auch geringere – Rolle für die regenerative Stromerzeugung spielen wird.
Die erneuerbare Stromerzeugung steigt mit den Ausbau der Kapazitäten an. Lag deren
Erzeugung 2005 bei etwa 3.300 TWh (Terrawattstunden), steigt diese in den Szenarien bis 2030
auf etwa 8.600 TWh in der unteren und etwa 15.200 TWh in der oberen Variante (Balken in
Figure 4).
Windenergie erreicht den größten Anteil an der erneuerbaren Stromerzeugung, aber der Anteil an
der Erzeugung fällt geringer aus, als deren Anteil an den Erzeugungskapazitäten 2. Trotzdem
kommt die Windenergie in Bezug auf die Stromerzeugung in 2030 selbst in der unteren
Szenarienvariante nahe an die Erzeugung aus Wasserkraft heran, in der oberen Variante
übersteigt sie deren Erzeugung deutlich, um etwa 2.000 TWh. Biomasse & Reststoffe,
Geothermie und solarthermische Stromerzeugung folgen auf den weiteren Plätzen.
Zum besseren Vergleich der hier dargestellten Szenarien mit dem „Alternative Policy Scenario“
des WEO 2006 ist in der Grafik (Figure 4) auch die Entwicklung dieses Szenarios, durch
marlierte Linien und transparente Flächen, dargestellt. Es ist leicht ersichtlich, dass im WEO
2006 Szenario von einem deutlich höheren Beitrag der Wasserkraft ausgegangen wird
(Markierung und Fläche in Lila), der Beitrag der „neuen“ Erneuerbaren hingegen (grüne
Markierungen und Fläche, über der Wasserkraft aufgetragen), selbst hinter der unteren Variante
der „REO 2030“ Szenarien, deutlich zurückbleibt.
2 Dieses Ergebnis war so zu erwarten, da Windenergie (und auch die Photovoltaik) wetterabhängige Technologien
sind, deren Produktivität nicht auf einem Niveau von z.B. Biomasse oder Geothermie erwartet werden kann.
Page 11 of 57REO 2030 V0810
Figure 4: Development of electricity production from renewables in the ”High Variant” (upper figure)
and the ”Low Variant Scenario” (lower figure), 2010 to 2030 [EWG; 2007]. Data 2005: [IEA; 2007b]
Bislagn wurde lediglich die elektrische Seite betrachtet, aber – wie Eingangs bereits erwähnt –
wurde auch Wärmeerzeugung aus Erneuerbaren in den Szenarien betrachtet. Wärmeerzeugung
findet sowohl in Kraft-Wärme-Kopplung (KWK) statt – die Hälfte der Biomasse E Reststoffe
verwendenden Anlagen und die Hälfte der geothermischen Anlagen in den Szenarien werden als
KWK-Anlagen angenommen – als auch durch solarthermische Kollektoren, denen beträchtliche
Anteile der Investitionen zufallen. Insgesamt wird in der unteren Variante ein größerer
Page 12 of 57REO 2030 V0810
Schwerpunkt auf solarthermische Kollektoren gelegt, als in der oberen Szenarienvariante. Diese
Entscheidung liegt darin begründet, dass solarthermische Kollektoren (Solarkollektoren)
vergleichsweise billig sind und die untere Variante mit erheblich geringeren Investitionen
auskommen muss als die obere Variante.
Die Kapazität der installierten Solarkollektoren steigt in der unteren Variante von 137 GW in
2006 auf beinahe 2.900 GW in 2030. Trotz der geringeren Gewichtung der Solarthermie in der
oberen Variante, werden dort in 2030 etwa 3.800 GW thermische Leistung erreicht. Da die
Entwicklung der Wärmeleistung aus KWK proportional zur Entwicklung der Stromerzeugung
aus Biomasse & Reststoffen und der Geothermie verläuft, schlägt sich dies auch genau so in der
Wärmeleistung beider Szenarien nieder: in der unteren Variante werden deutlich geringere
Wärmeleistungen aus KWK erreicht, als dies in der oberen Variante der Fall ist.
Bezug nehmend auf den Endenergiebedarf, erreicht die obere Variante der Szenarien in 2030
eine erneuerbaren Deckungsgrad von knapp 30% und, aufgrund der deutlich geringeren
Investitionen, etwas mehr als 17% in der unteren Variante.
Der erneuerbare Anteil im Stromsektor fällt in beiden Szenarien deutlich höher aus, als der
Anteil der Erneuerbaren an der Deckung des Endenergiebedarf für Wärme. In der oberen
Variante werden 2030 etwa 62% des Stroms und 16% der Wärme aus erneuerbaren Technologien
gewonnen. In der unteren Variante sind dies 35% (Strom) bzw. 10% (Wärme).
In der abschließenden Bewertung zeigen beide Szenarien, dass die Möglichkeit zum Ausbau
Erneuerbarer Energien bis 2030 wesentlich größer ausfällt, als im „Alternative Policy Scenario“
des „World Energy Outlook 2006“ dargestellt wird. Die dafür notwendigen Investitionen –
oftmals als ein großes Problem für den Ausbau der Erneuerbaren angesehen – sind relativ gering,
nicht nur in Bezug auf den laufenden und sich stetig beschleunigenden Klimawandel, sondern
auch in Bezug auf heutige Investitionen in anderen Sektoren. Um eine Entwicklung zu erreichen,
wie sie in der oberen Variante aufgezeigt wird, würde es ausreichen die Investitionen in
erneuerbare Erzeugungstechnologien bis zum Jahr 2030 auf ein Niveau von durchschnittlich 124
€ pro Kopf der Weltbevölkerung zu steigern; eine durchschnittliche pro Kopf Investition, wie sie
im Bereich der Militärausgaben bereits im Jahr 2005 stattgefunden hat.
Es hat einen langen Zeitraum erfordert, die Erneuerbaren Energien in den Fokus
wissenschaftlicher Forschung zu bringen und weitere Zeit war und ist für deren Markteinführung
nötig. Die erfolgreiche Markteinführung, dies kann am Beispiel des Deutschen EEG gut gezeigt
werden, erfordert effektive Förderkonzepte und kann zu einem dynamischen Wachstum führen.
Das Wachstum der Windenergie in Deutschland, zum Beispiel, übertraf regelmäßig die gestellten
Prognosen. Insgesamt betrachtet verlief der Ausbau der Erneuerbaren im globalen Kontext
bislang zu zögerlich – und keineswegs in einem Ausmaß, dass geeignet wäre dem Klimawandel
zu begegnen -, aber es muss auch als Erfolg betrachtet werden, dass die Erneuerbaren Energien
heute zum normalen Bestandteil des Nachdenkens und Planens einer zukünftigen
Energieversorgung gehören.
Page 13 of 57REO 2030 V0810
Trotz ermutigender Ansätze, wurde zu viel Zeit mit dem Streit über die Gründe der globalen
Klimaveränderung sowie die Endlichkeit und Reichweite der fossilen Energieträger vergeudet,
bevor man zu der Erkenntnis gelangte, dass Heute die Zeit dafür ist die Art und Weise, in der wir
unseren Energiebedarf befriedigen – aber auch Art und Ausmaß der Energieverwendung –
energisch und nachhaltig zu verändern. Dies ist eine Aufgabe, die dieser Generation zu leisten
hat. Ein früheres Angehen dieser Aufgabe wäre sicherlich vorteilhafter gewesen. Aber die
Aussicht, mit relativ geringen Investitionen, binnen zweier Jahrzehnte den Anteil Erneuerbarer
Energien auf 62% des benötigten Stroms und insgesamt 30% des Bedarfs an Strom und Wärme
steigern zu können, gibt Anlass zu Optimismus. Wir können die Probleme des Klimawandels und
schwindender fossiler Energieträger bewältigen, wenn dies nur wirklich wollen und bereit sind
diese Probleme energisch anzugehen.
Eine Entwicklung, wie in der oberen Variante dieser Szenarien dargestellt, birgt die Möglichkeit
zur Reduzierung fossiler und nuklearer Erzeugungskapazitäten in der globalen
Energieversorgung. Auch wenn die Energieversorgung, zumindest bis 2030, noch auf große
Anteile fossiler Energieträger angewiesen sein wird, bietet ein massives Wachstum der
Erneuerbaren einen, und unserem Kenntnisstand nach den einzigen, Weg aus der Abhängigkeit
von Öl und anderen fossilen Energiequellen.
Es ist unsere feste Überzeugung, dass die Atomkraft nicht gebraucht wird, wenn wir jetzt eine
Entwicklung in Gang setzen, wie sie hier vorgeschlagen wird. Es besteht keinerlei
Notwendigkeit dafür, neue Atomkraftwerke zu bauen oder die Laufzeiten bereits bestehender
über das geplante Maß hinaus zu verlängern. Die Nutzung der Atomkraft, mit allen damit
verbundenen Problemen (z.B. Erzeugung und Verbreitung atomwaffenfähigen Materials, die
ungelöste Frage der Endlagerung radioaktiver Abfälle oder die Gefahr schwerer
Kraftwerksunfälle), kann beendet werden und muss so schnell wie möglich beendet werden.
Statt Gelder für den Bau neuer Atomkraftwerke bereitzustellen, die definitiv keine nachhaltige
Lösung unserer Energieprobleme erbringen können, sollte dieses Geld in die wirkliche Lösung
der Probleme fließen, in die Erneuerbaren Energie.
Auch wenn die „REO 2030“ Szenarien eine Weg zur massiven Steigerung des Anteils
regenerativer Energien in der Energieversorgung zeigen, sollten die Szenarien unser Augenmerk
auch auf den Energieverbrauch und dessen zukünftiger Entwicklung lenken. In dieser Studie ist
der Bezugsrahmen für die Entwicklung des Energiebedarfs aus dem „Alternative Energy
Scenario“ des „World Energy Outlook 2006“ der Internationalen Energieagentur entnommen.
Dies bedingt, dass, selbst in der oberen Variante der „REO 2030“ Szenarien, der Beitrag der
nicht-erneuerbaren Energieerzeugung im Jahr 2030 beinahe so hoch ausfällt, wie der gesamte
Endenergiebedarf an Strom und Wärme des Jahres 2005. Dies zeigt deutlich, dass wir uns der
Frage des Energieverbrauchs mit derselben Anstrengung widmen müssen, wie der Frage der
Energieerzeugung. Es sollte durchaus hinterfragt werden, ob die von der IEA in Aussicht
gestellte Entwicklung des Energieverbrauchs ambitioniert und mutig genug ist, um darauf eine
Lösungsansatz aufzubauen. Es ist unbestritten, dass enorme Potenziale zur Energieeinsparung
Page 14 of 57REO 2030 V0810
vorhanden sind, insbesondere im Bereich der Wärme, und das wir diese Potenziale erschließen
müssen. Aber dies ist eine Frage, die durch weitere Arbeit zu klären ist.
Page 15 of 57REO 2030 V0810
Introduction
The objective of developing the scenarios of this study is to present an alternative and more
realistic view on the role renewable energies can play in a future global energy supply. Some of
the latest global or regional scenarios are not really showing the potentials renewable energy
technologies have in the near future. The scenarios in this study are based on the analysis of the
development and market penetration renewables showed in different regions within the last
decades. The scenarios will show that renewable energy technologies have a huge potential to
help to solve the climate change problem and to lower the dependence from fossil and nuclear
energies.
At the latest since the currently released IPCC climate study there cannot be any legitimate doubt
that the ongoing climate change is man-made. The possible magnitude of climate change is set to
reach levels that threaten our economies, the stability of ecosystems and, hence, a sustainable
development. Lately Nicholas Stern, former chief economist of the World Bank, draw the focus
on the (previously unnoticed but already often published) economic aspects of climate change.
According to Stern’s analysis climate change could cause a decrease of the global GDP by at
least 10%, and - in the worst case - even by 20%.
To avoid an increase in average global temperature that exceeds a tolerable limit of 1,5 to 2° C ,
the atmospheric concentration of greenhouse gases (GHG) must be stabilised at a level of about
420 ppm (parts per million) of CO2 equivalents in this century.
This stabilisation can only be achieved if global greenhouse gas (GHG) emissions are reduced to
less than the half by the middle of this century. As today’s developed countries are the
predominant contributors to global GHG emissions, it must be their commitment to make first
moves towards a clean energy supply and to reduce their GHG emission by 80% within this
time. Developed countries, among them the Member States of the European Union, must provide
intermediate targets to keep this process revisable, transparent and convincing to others and will
have to assist less developed countries in establishing a clean and secure energy supply.
The serious consequences of using fossil fuels, the risks of nuclear energy and the foreseeable
end of cheap fossil and nuclear fuels3 show us that the use of these technologies must be
discontinued. With regard to nuclear fusion, this technology has so far not functioned and would
also involve the production of radioactive waste if it did.
Over the medium- and long term a sustainable energy system can only be supplied by renewable
sources. Although the amount of energy offered by renewable sources exceeds the global energy
demand by far, the expense to install the technical equipment in order to utilise those renewable
3 Additional EWG Publications on these issue can be found at:
www.energywatchgroup.org/Studien.24+M5d637b1e38d.0.html
Page 16 of 57REO 2030 V0810
sources should be kept on a minimum. This entails that energy has to be used as efficient as
possible, i.e. renewable supply and energy efficient technologies must be combined.
One of the most common question regarding establishing a renewable energy supply is the time
which is necessary to realise such a system. Some scenarios already addressed this question on a
regional level4. The scenarios in this study deal with the question how fast renewable
technologies might be implemented on a world wide scale and with the costs such a development
would result in.
Addressing these questions cannot be separated from the question how, how fast and to which
extend greenhouse gas emissions can be reduced. Although it is quite clear that renewable
technologies and energy efficiency will be the major keys in reducing greenhouse gas emissions,
clarifying time and costs makes the effort humanity has to take more apparent and more
transparent. Last but no least the outcome of the scenarios will also help in defining goals for the
reduction of greenhouse gas emissions.
4 e.g. [Enquete-Kommission; 2002], [SolCat; 2007] oder [Peter et al.; 2006], [Peter/Lehmann; 2005]
(Kraftwerksersatz), [LTI; 1998], XXX Quellenhinweis auf DLR WI, UBA für D, , und ??? weitere ???
Page 17 of 57REO 2030 V0810
Methodology
We were asked to calculate the possible increase in renewable energy capacities assuming a
hindrance free development. This means, the “Renewable Energy Outlook 2030” (REO 2030)
scenarios presume a strong support framework for renewables (political, financial and
administrative) to avoid further delays in market introduction and market penetration.
The REO scenarios consider ten world regions, which are the same as in IEA's “World Energy
Outlook 2006” (WEO 2006). This is not done randomly, it helps to compare the results of this
scenarios with the “World Energy Outlook” scenarios and other scenarios.
Presuming strong political support and a barrier-free market entrance, the dominating stimulus
for extending the generation capacities of renewable technologies is the amount of money
invested. Within the REO scenarios we assume a willingness to pay for clean, secure and
sustainable energy supply. The assumed willingness to pay is expressed as a target level for
annual payments per capita that - after a period of continuous growing investments into
renewable energies - will be reached by the year 2030. As incorporating estimations regarding
inflation are considered as uncertain, all amounts get expressed on a 2006 price basis.
Because all investments into energy supply will have to be paid by the energy consumers in the
end, the extension of renewable energies will impose a financial burden to societies5. Although a
growing acceptance of and support for clean energy supply by societies is assumed within this
work, the Energy Watch Group respected that overstressing financial burdens might change
society’s attitude towards renewable energy support to the worse; with negative effects on the
investors trust into the continuity of political support for renewable energy with unchanged
conditions.
The annual payments, starting in 2010 with a low amount of capital and reaching a defined
amount of investment in 2030, are divided into two fractions called “basic investment” and
“advancement investment”, one (basic) to ensure the necessary technological diversification of
renewable energy technologies and the other (advancement) to adapt development to existing
potentials within the regions.
In this study we calculate two “REO 2030” scenarios which differ in terms of the assumed
acceptance, thus reflecting a low societal acceptance on one side and a high one on the other
side. Consequently there is a “Low Variant” scenario, assuming lower investment budgets, and a
“High Variant” scenario with substantially higher expected investments into renewable
technologies.
5 This is also true for conventional power supply, e.g. costs for erecting conventional power plants, maintenance
or the renewal of the power plant pool.
Page 18 of 57REO 2030 V0810
General calculation approach
In both scenarios the total quantity of installed renewable energy technologies depends on the
development of specific technology costs and total investment budgets (increasing towards
2030). There is a close relation between specific technology costs and the development of
installed capacities. While specific technology costs determine the capacity that can be
purchased for a specific amount of money, there is a strong interrelation between market
development and specific costs, as product prices decrease with increasing production rates. To
solve this problem we selected an iterative process to calculate the interacting curves of future
cost development and installed generating capacities.
Figure 5: Flow chart of the scenario development process with iteration of technology costs and added
capacities in 2030. [S. Peter, H. Lehmann; 2007]
Within the scenarios both, investment budgets and specific technology costs determine the
generating capacities that can be added each year up to 2030, thus providing a target mark for the
development of installed capacities until 2030. This is, in a first run, done using today’s
technology costs for the the whole period up to 2030. The resulting development of the total
capacities installed world wide afterwards gets used to generate technology specific “learning-
curves” for cost degression. The next run uses this decreased technology costs to recalculate
installed generating capacities – with this corrected capacities technology costs get recalculated
again and so forth. The execution of this calculation loop stops if technology costs for 2030
converge. The picture above (Figure 5) gives an overview of the scenario development process.6
6 For more details see “Details on mapping technological and cost development” in the Annex
Page 19 of 57REO 2030 V0810
In the strict sense this makes the scenario development a mixture of financial and technologically
driven, as the fixed investment budgets in 2030 determine the preceding development in terms of
installed capacities and thus the decrease of specific technology costs.
Page 20 of 57REO 2030 V0810
Interaction of investment budget and technologies' cost decrease
The Renewable Energy Budget decides about the renewable generating capacity that can be
added in the course of 2030. For this purpose the purchasable generating capacity in 2030 is
calculated by dividing the investment budget by specific technology costs in 2030, which are
calculated within an iteration loop (see also Figure 5 and Figure 6). On this note investment
budget in 2030 and added capacity in 2030 are equivalent by the factor of specific technology
costs in 2030. The decrease in specific technology cost is calculated using so called “learning
curves”. Learning curves consist of a progress ratio which determines by how much costs will
decrease if production doubles. For example: With a progress ratio of 0.9 costs will decrease by
10 percent for any doubling of production.
To calculate the cost decrease for each of the technologies the following progress ratios are used:
Technology Progress ratio
Wind Energy, onshore 0.85 up to 200 GW and 0.9 up to 2,000 GW
Wind Energy, offshore same as onshore, but calculated as difference costs
compared to onshore Wind Energy
Biomass & Waste 0.9 up to 2010, 0.93 up to 2020 and 0.95 up to 2030
Geothermal 0.95
Photovoltaic 0.8 up to 200 GW and 0.9 up to 2,000 GW
Solar Concentrating Power 0.93 up to 2020, and 0.95 up to 2030
Tidal, Wave & other Maritimes prototype phase up to 2010, then 0.9
Solar Thermal Collectors 0.9
Table 2: Progress ratios for the technologies considered in the scenarios. [EWG; 2007]
Although there is a fixed target for the amounts that will be spent in 2030, the investment
budgets in the REO scenarios are explicitly not static over the considered period of time. Annual
renewable energy investments for the preceding years are a result of a technological
development up to 2030 which has to fulfil the prerequisite that the overall costs of new
capacities added in 2030 meet the 2030 investment target.
Page 21 of 57REO 2030 V0810
Figure 6: Example of translating the 2030 investment budget into new added capacities in 2030 with
regard to degression of specific technology costs (see also Figure 5 on page 19 for more information on
iterative technology cost calculation). [S. Peter, H. Lehmann; 2007]
General growth assumption
The general approach of mapping the development of single renewable technologies to the time
line within the different regions uses so called “logistic growth functions”, showing a typically s-
curved shape for growth with saturation effects in the later stage of development. This reflects
the underlying assumption that growth cannot be unlimited if any of the resources growth
depends on is limited. In general the logistic growth starts with an exponential development that,
in the course of time, gets more and more dampened by saturation effects. The last phase of
development shows a slow (asymptotic) approach towards a maximum value . The curve of a
logistic growth function does not show the development of growth itself, but it shows the
development of stock (growth rates follow a bell-shaped curve).
Translated to e.g. growth of a technology logistic growth consists of a phase of market
introduction, followed by a dynamic market growth which later declines due to market
constraints, such as a high market penetration that makes it harder and harder to find new
customers (e.g. in case of a product) or an increasing scarceness of available or suitable sites for
installation (e.g. for Wind Energy or PV).
Page 22 of 57REO 2030 V0810
Generally logistic growth (or so to say logistic stock development) is an idealised process of
limited growth. In reality growth might be influenced by various factors, e.g. by changes in
legislation and/or financial support in case of renewable energies.
Another issue that can be well explained by means of a logistic growth function is the advantage
of starting a development sooner. In the example below the strong red curve shows the
development from the start, the lighter curves started 10 respectively 20 years earlier. After 20
years of development the curve called “logistic growth” shows a value of 10%, the curve starting
10 years earlier a value of almost 30% and the curve starting 20 years sooner a value of more
than 50 %. This 20% per decade advantage in the example is still present one decade later for
both other curves (the 30th year of development for the “logistic growth” curve). Afterwards the
gap begins to close, but this happens quicker for the development starting 20 years earlier than
for those that starts 10 years earlier (still almost 20% advantage for the “10 years sooner” curve
but “only” 35% for the “20 years sooner” curve if compared to the “logistic growth” curve).
Figure 7: Example for logistic growth and the advantage of starting sooner [EWG; 2008].
One important question is, if a logistic growth function can reflect the growth characteristics of
renewable energies in a way that can be seen as a valid approximation to reality (this does not
mean that the logistic growth function will deliver “the right” projection for future development
but that historical development and logistic growth match each other sufficiently). Therefore the
logistic growth function used in the “REO 2030” scenarios was applied to the German Wind
Energy development (Figure 8). The result shows a good approximation of the logistic growth to
historical development, which means that growth of Wind Energy in Germany has been a logistic
growth so far.
Page 23 of 57REO 2030 V0810
Figure 8: Example for fitting the logistic growth function used in the “REO 2030” scenarios to historical
data of Wind Energy development in Germany.
Page 24 of 57REO 2030 V0810
Investment budgets for renewable Energy technologies
Presuming strong political support and a barrier-free market entrance, the dominating stimulus
for extending the generation capacities of renewable technologies is the amount of money
invested. Within the “REO 2030” scenarios we assume a growing "willingness to pay" for clean,
secure and sustainable energy supply starting with a low amount in 2010. This willingness to pay
gets expressed as a target level for annual investments per inhabitant (capita) that will be reached
by the year 2030, after a period of continuous growing investments in to renewable energies. As
incorporating estimations regarding inflation are considered as uncertain, all amounts are
expressed on a 2006 price basis.
The annual payments are divided into two fractions called “basic investment” and “advancement
investment” with one proportion (basic investment) being equally distributed to all the renewable
energy technologies considered7 to ensure the necessary technological diversification. The
remaining budget (advancement investment) is distributed in relation to the regional potentials of
the different technologies. This is done to adapt the introduction of renewable energy
technologies to the existing potentials in the related regions.
The “Renewable Energy Investment Budget”, i.e. the amount of money invested into renewable
generating capacities, respects expectations regarding the future economic development of the
different regions. Therfore investment budgets are adapted to the economic situation of any of
the regions. Thus stronger Economies have higher investment targets for 2030 than weaker
economies, rapidly developing economies are assumed to spend more money, as they will have
to improve energy supply anyway and so forth.
But this is not the only criterion for the set-up of the investment budgets. From beginning on
there was some discussion about reasonable amounts per capita for the different regions. On the
first try investment budgets have been decisively higher and with less differentiation between the
regions. As this resulted in renewable electricity shares the working team judged as unreasonable
high, investment targets were lowered region by region in order to get a more moderate scenario
approach. The working team is aware that even higher installed capacities could have been
justified from the perspective of possible technological growth, but it was decided to favour
relatively low investments.
Some regions, in particular nowadays less developed regions, will have to take stronger efforts in
terms of the Gross Domestic Product's share they will have to spend to achieve the goals
described in the scenarios. In the long term it must be considered that many of the non-OECD
countries will foreseeable have a substantially higher economic growth than most OECD
countries. Some of them will even be confronted with the task to develop a sufficient and reliable
energy supply to keep up the pace of economic growth. This comprises that many of the less
7 Exceptions were made to tidal, wave and other maritime energies and solar thermal collectors.
Page 25 of 57REO 2030 V0810
developed non-OECD countries will have to take massive investments into infrastructure and
energy supply as well, if they want to have the chance to participate in global economic
development. This does not necessarily mean that these countries will have to bear all the related
costs by themselves, as richer countries should contribute to this development, e.g. via the Clean
Development Mechanism (CDM) or Joint Implementation (JI).
Investment budgets in the REO 2030 Scenarios
In the “High Variant Scenario” per capita investments in 2030 grow to 220 € per capita and year
(€/cap*a) in the OECD regions, 200 €/cap*a in China and the Middle East, decreasing further for
the Transition Economies (180 €/cap*a) and the remaining Regions (all with less than 100
€/cap*a). As the scenario is based on an iterative calculation, the achieved values does not
exactly match these target values. The regions are very different in terms of population, therefore
total investment sums do not show the same distribution as the investments per capita. China and
South Asia for example, both regions with far more than one billion inhabitants, have the biggest
total investments by 2030.
The “Low Variant” of the “REO 2030" scenarios assumes half the investment budget of the
"High Variant" but in both scenarios the relation of investments in the different regions is the
same; with the highest per capita spendings in the OECD countries and lowest investment
figures for Africa (see Table 3 on page 27 for details).
Looking at the figures for 2010, the OCED region starts with investments of about 60 € (OECD
Pacific) to 70 € (OECD Europe) per inhabitant and year, while this figure is about 3½ € per
capita in Africa. By 2020 the OECD countries already spend about 125 € to 131 € per capita for
new renewable generating capacities. In China this is more than the half of this figure, while it is
about the half in the Transition Economies and Middle East. The per capita investments in East
Asia and Latin America are about the same (approx. 33 €). Smallest amounts are spent in South
Asia (22 €/cap*a) and Africa, with 14 € per capita.
Due to the different number of inhabitants in the regions, China already is en par with OECD
Europe in terms of total investments by 2010 and surpasses all other regions during the further
development. By 2030 China's total investments into renewable capacities (299 bill € 2006) is more
the double the amount spent in South Asia (147 bill €2006, second place). OECD Europe and
OECD North America are on third and fourth place, both spending about 30 billion € less than
South Asia. In all other regions total investment is lower than 70 billion Euros (see Table 3 for
more details).
Page 26 of 57REO 2030 V0810
Investment budgets (€2006)
Region Per Capita Total [bill. €2006]
2010 2020 2030 2010 2020 2030
“High variant” scenario
OECD Europe 69.2 130.9 222.8 37.0 71.1 120.9
OECD North America 62.7 126.2 220.0 28.6 62.8 118.4
OECD Pacific 59.1 124.7 223.9 11.9 25.0 43.6
Transition Economies 16.2 65.5 180.0 5.6 22.3 60.3
China 28.2 76.3 203.8 38.3 109.7 299.3
East Asia 10.3 32.2 81.3 6.8 23.9 65.6
South Asia 4.1 21.8 71.1 6.5 39.8 146.7
Latin America 12.0 32.7 91.4 5.6 17.1 51.5
Africa 3.5 14.2 40.8 3.5 17.3 59.4
Middle East 4.8 56.2 202.2 1.0 13.3 55.1
WORLD 21.3 53.2 123.9 144.8 402.4 1020.8
“Low variant” scenario
OECD Europe 55.7 76.1 111.3 29.8 41.4 60.4
OECD North America 40.8 70.4 110.0 18.6 35.0 59.2
OECD Pacific 38.2 70.2 111.8 7.7 14.1 21.8
Transition Economies 8.9 35.0 91.1 3.0 11.9 30.5
China 18.8 43.4 101.7 25.5 62.3 149.4
East Asia 7.4 20.5 40.5 5.0 15.2 32.7
South Asia 3.0 12.2 35.4 4.7 22.2 73.1
Latin America 7.4 18.2 45.6 3.5 9.5 25.7
Africa 2.1 7.7 20.3 2.1 9.3 29.5
Middle East 2.9 26.5 101.1 0.6 6.3 27.5
WORLD 14.8 30.1 61.9 100.4 227.3 509.8
“Low variant” as percentage of “High variant”
OECD Europe 80% 58% 50%
OECD North America 65% 56% 50%
OECD Pacific 65% 56% 50%
Transition Economies 55% 53% 51%
China 67% 57% 50%
East Asia 72% 64% 50%
South Asia 73% 56% 50%
Latin America 62% 56% 50%
Africa 60% 54% 50%
Middle East 60% 47% 50%
WORLD 69% 57% 50%
Table 3: Development of investment per capita and total investments from 2010 to 2030 [EWG;
2008].
The development of investment budgets does not show that big difference between "High
Variant" and "Low Variant" by 2010. In global average the 2010 budget in the "Low Variant"
scenario is about 70% of the “High Variant's” budget. This difference grows during the further
development, to 57 % of the “High Variant's” budget by 2020 and the half by 2030 (see Table 4
for details).
Page 27 of 57REO 2030 V0810
Distribution of investments to technologies
The distribution of investments is divided into a basic investment, which is equally distributed to
all technologies considered (making up the half of the investment budget). The second fraction,
named “advancement”, is generally oriented at the technologies' different potentials, with some
additional adjustments to add further support to specific technologies; e.g. Solar Concentrating
Power in sunny regions and OECD Europe and a general stronger support for Solar Collectors.
There is not “extra” investment into heat generation from Biomass & Waste or Geothermal
Energy, which does not mean that these technologies aren't used for heat supply. The scenarios
assume a certain fraction of Biomass & Waste and Geothermal plants to be cogeneration plant,
producing electricity and heat simultaneously.
Page 28 of 57REO 2030 V0810
Distribution of investments to technologies
Solar
Region / Wind Wind Wind Tide & Solar
Biomass Geothermal PV Concentrating
Technology onshore offshore total Wave Collectors
Power
“High variant” scenario
OECD Europe 10.5% 24.3% 34.8% 10.6% 9.2% 14.5% 11.0% 3.7% 16.2%
OECD North
15.6% 20.1% 35.7% 13.3% 8.6% 11.0% 11.7% 3.4% 16.4%
America
OECD Pacific 16.7% 19.8% 36.4% 10.5% 8.6% 8.6% 16.5% 3.2% 16.1%
Transition
21.3% 13.5% 34.8% 17.4% 11.4% 10.7% 0.0% 1.7% 23.9%
Economies
China 11.8% 16.3% 28.1%11.0% 7.9% 17.1% 13.9% 2.8% 19.2%
East Asia 8.6% 21.4% 30.0% 9.8% 7.1% 13.6% 13.2% 1.4% 24.9%
South Asia 6.7% 9.4% 16.1% 8.0% 6.1% 24.1% 10.6% 1.3% 33.8%
Latin America 14.5% 20.5% 35.0%12.4% 9.9% 10.0% 13.2% 1.6% 18.0%
Africa 12.2% 11.7% 23.9%11.2% 6.6% 10.6% 16.0% 1.3% 30.4%
Middle East 14.3% 20.1% 34.4% 0.0% 9.5% 13.7% 21.0% 1.8% 19.6%
WORLD 12.2% 17.2% 29.4%
10.6% 8.2% 15.2% 12.5% 2.4% 21.7%
“Low variant” scenario
OECD Europe 9.5% 21.9% 31.3% 9.5% 8.3% 13.1% 10.0% 3.3% 24.5%
OECD North
14.1% 18.1% 32.1% 11.9% 7.8% 9.9% 10.5% 3.0% 24.8%
America
OECD Pacific 15.0% 17.8% 32.8% 9.4% 7.8% 7.7% 15.0% 2.9% 24.4%
Transition
17.0% 10.8% 27.8% 14.0% 9.3% 8.7% 0.0% 1.4% 38.9%
Economies
China 10.1% 14.0% 24.1% 9.4% 6.8% 14.7% 12.0% 2.4% 30.5%
East Asia 6.6% 16.5% 23.2% 7.6% 5.5% 10.5% 10.2% 1.1% 42.0%
South Asia 5.4% 7.6% 12.9% 6.4% 4.9% 19.4% 8.5% 1.0% 46.9%
Latin America 12.7% 17.9% 30.7% 10.9% 8.6% 8.8% 11.6% 1.4% 28.1%
Africa 8.2% 7.8% 16.1% 7.5% 4.4% 7.1% 10.7% 0.9% 53.3%
Middle East 12.2% 17.2% 29.5% 0.0% 8.2% 11.7% 18.2% 1.5% 30.9%
WORLD 10.3% 14.6% 25.0% 8.9% 6.9% 12.8% 10.6% 2.1% 33.7%
Changes in Distribution, “Low variant” compared to “High variant”
OECD Europe -1,0% -2,4% -3,5% -1,1% -0,9% -1,4% -1,0% -0,4% 8,3%
OECD North
-1,5% -2,0% -3,6% -1,4% -0,8% -1,1% -1,2% -0,4% 8,4%
America
OECD Pacific -1,7% -2,0% -3,6% -1,1% -0,8% -0,9% -1,5% -0,3% 8,3%
Transition
-4,3% -2,7% -7,0% -3,4% -2,1% -2,0% 0,0% -0,3% 15,0%
Economies
China -1,7% -2,3% -4,0% -1,6% -1,1% -2,4% -1,9% -0,4% 11,3%
East Asia -2,0% -4,9% -6,8% -2,2% -1,6% -3,1% -3,0% -0,3% 17,1%
South Asia -1,3% -1,8% -3,2% -1,6% -1,2% -4,7% -2,1% -0,3% 13,1%
Latin America -1,8% -2,6% -4,3% -1,5% -1,3% -1,2% -1,6% -0,2% 10,1%
Africa -4,0% -3,9% -7,8% -3,7% -2,2% -3,5% -5,3% -0,4% 22,9%
Middle East -2,1% -2,9% -4,9% 0,0% -1,3% -2,0% -2,8% -0,3% 11,3%
WORLD -1,9% -2,6% -4,4% -1,7% -1,3% -2,4% -1,9% -0,3% 12,0%
Table 4: Distribution of investments to the different technologies and differences between “Low
variant” and “High variant” [EWG; 2008]
Page 29 of 57REO 2030 V0810
The resulting distribution favours Wind Energy, which receives about one third of all
investments in all regions but South Asia and Africa. In case of Wind Energy it has to be
considered that this is the only technology which can be utilized on land and on sea, resulting in
massive potentials all over the world. Almost 22% (High Variant) or 34% (Low Variant) of the
total investments on the global level go to solar collectors, as this technology is considered a
must for heat supply and should be applied at every building possible (not only for heat, but also
for cold). Photovoltaic holds the third place in investment ranking (15% on average), followed
by biomass (11%) and geothermal energy (8%). Tidal & Wave and other maritime sources get
least support, as those technologies are considered to evolve from prototype stage over field
testing to mature technologies within the next years or the next decades for some of those
technologies.
Compared to the “High Variant” scenario, there are differences in the distribution of investment
budgets among the technologies in the “Low Variant”. In general all electricity generating
technologies show lower budget shares than in the “High variant”, while solar thermal collectors
show a remarkable plus in investment shares. As investments in the “Low Variant” are
substantially lower than in the “High Variant”, the working team decided to provide more
support to the cheap Solar Thermal Collector technology.
Page 30 of 57REO 2030 V0810
Development of technology costs
Technology costs in the scenarios are calculated using progress ratios for the cost decrease.
These progress ratios describe the relation between cost reduction and production capacity in that
way, that the progress ratio represents the cost reduction if production capacity doubles; e.g. a
progress ratio of 0.9 expresses a cost reduction of 10 % for any doubling of production capacity.
Figure 9 shows an example for this relation (see also used progress ratios in Table 6 on page 32).
Figure 9: Example for calculating technology cost decrease by progress ratio. [EWG; 2008]
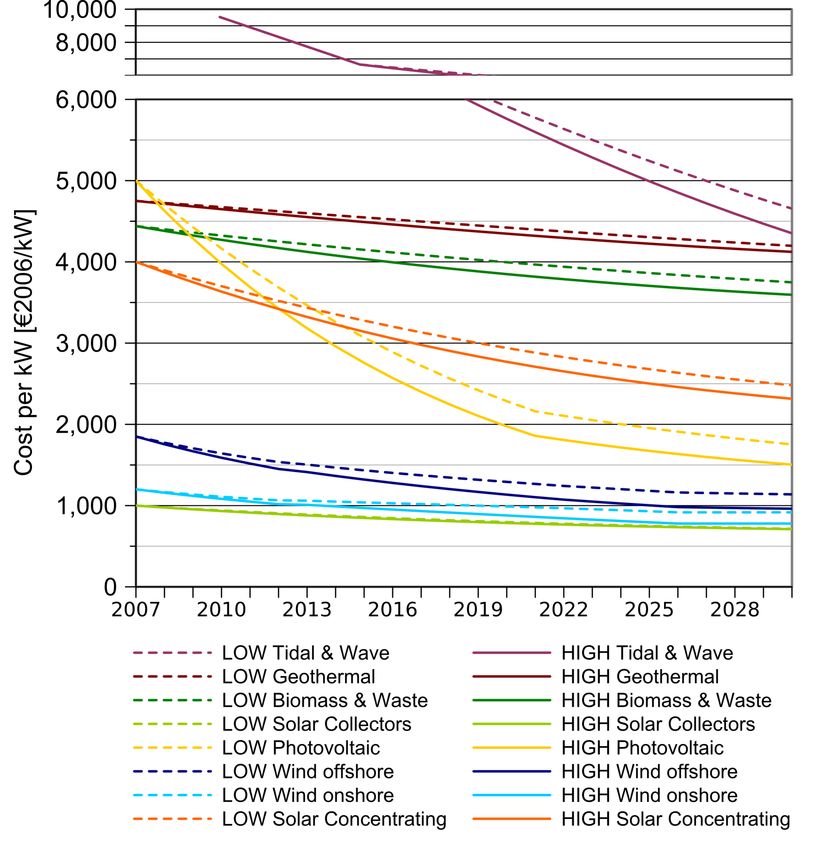
Starting point for technology costs is the same within both scenarios. Most expensive among the
established technologies (which are all but Tidal, Wave & other Maritimes) in the beginning is
Photovoltaic, followed by Geothermal, Biomass & Waste, Solar Concentrating Power and – with
a substantial gap to those technologies – offshore and onshore Wind. Finally Solar Thermal
Collectors are the cheapest technology (see Table 5 below for initial technology costs).
Page 31 of 57Sie können auch lesen