SITUATION ANALYSIS OF THE VIETNAMESE ELECTRICITY SECTOR - Arepo ...
←
→
Transkription von Seiteninhalten
Wenn Ihr Browser die Seite nicht korrekt rendert, bitte, lesen Sie den Inhalt der Seite unten
SITUATION ANALYSIS OF THE VIETNAMESE
ELECTRICITY SECTOR

Berlin, March 30th 2016

Author:
Arepo Consult
Dr. Christine Wörlen
Albrechtstr. 22
D-10117 Berlin
Telefon +49 30 526 892 16
Sarah Rieseberg
rieseberg@arepo-consult.com
Energy Transition Readiness of Viet Nam

SITUATION ANALYSIS OF THE VIETNAMESE
ELECTRICITY SECTOR- A PRE-STUDY

Table of Content
1     Deutsche Kurzfassung .......................................................................................................................... 5
    1.1      Dimension I: Klimapolitik............................................................................................................ 5
    1.2      Dimension II: Energiepolitik ........................................................................................................ 6
    1.3      Dimension III: Zustand des Stromsektors .................................................................................... 7
    1.4      Dimension IV: Rahmenbedingungen für erneuerbare Energien .................................................. 8
    1.5      Dimension V: Stakeholder Integration ......................................................................................... 8
    1.6      Zusammenfassung ........................................................................................................................ 8
2     Situation Analysis of the Vietnamese Electricity Sector .................................................................... 10
    2.1      Research question and methodology .......................................................................................... 10
    2.2      Results of dimension I: Climate change policy .......................................................................... 14
    2.3      Results of dimension II: Energy policy ...................................................................................... 17
    2.4      Results of dimension III: Electricity sector ................................................................................ 21
    2.5      Results of dimension IV: Renewable energy framework ........................................................... 24
    2.6      Results of dimension V: Stakeholder inclusion.......................................................................... 30
4     References .......................................................................................................................................... 32
5     Annex: Data Annex of the Situation Analysis of the Vietnamese Electricity Sector ......................... 33

2
Situation Analysis of the Vietnamese Electricity Sector

Abbreviations

Abbreviations   Term

ACT             Avoided-Cost-Tariff

BAU             Business As-Usual

bn              Billion

BUR 1           Initial Biennial Updated Report

CDM             Clean Development Mechanism

EDI             Environmental Democracy Index

EPI             Environmental Performance Index

EVN             Electricity of Viet Nam

FiT             Feed-in tariff

GDP             Gross domestic product

GHG             Greenhouse gas

GW              Gigawatts

INDC            Intended Determined National Contribution

kWh             Kilowatt hours

kWp             Kilowatt-peak

LCOE            Levelized cost of electricity

LULUCF          Land use, land-use change and forestry

MAIFI           Momentary Average Interruption Frequency Index

MW              Megawatts

MWp             Megawatt-peak

MWh             Megawatt hours

NAMAs           National Appropriate Mitigation Actions

NGO             Non-governmental organisation

NCCS            National Climate Change Strategy

OECD            Organisation for Economic Co-operation and Development

                                                                                                               3
Energy Transition Readiness of Viet Nam

PDP                  Power Development Plan

PVN                  Petro Viet Nam/ Viet Nam Oil and Gas Group

RE                   Renewable energies

RE-DS                Renewable Energy Development Strategy

RISE                 Readiness for Investment in Sustainable Energy

RPS                  Renewable energy portfolio standard

SAIDI                System average interruption duration index

SAIFI                System Average Interruption Frequency Index

tCO2                 Tonnes carbon dioxide

TWh                  Terawatt hours

UNFCCC               United Nations Framework Convention on Climate Change

VGGS                 Vietnamese Green Growth Strategy

VNEEP                Viet Nam Energy Efficiency Program

WRI                  World Resources Institute

4
Situation Analysis of the Vietnamese Electricity Sector

1 Deutsche Kurzfassung
Im Pariser Klimavertrag 2015 wurde beschlossen, dass die globale Klimaneutralität in der zweiten Hälfte des 21.
Jhd. erreicht werden soll. Ein Eckpfeiler davon ist die weltweite Dekarbonisierung des Stromsektors. Die Studie
“Situation Analysis of the Vietnamese Electricity Sector” gibt einen Überblick über die notwendigen
Rahmenbedingungen für die Umsetzung Erneuerbare Energien in sogenannten Entwicklungs- und
Schwellenländern.
 Dafür bewertet die vorliegende Studie mit Hilfe einer Reihe von Indikatoren, inwieweit Vietnam für eine solche
Transformation bereit ist. Die Analyse konzentriert sich dabei auf den Stromsektor. Sie basiert auf 31 Indikatoren
bestehend aus 59 Fragen und Unterfragen. Die Indikatoren untersuchen die Rahmenbedingungen in fünf
Dimensionen: (1) Klimapolitik, (2) Energiepolitik, (3) Zustand des Stromsektors, (4) Rahmenbedingungen für
erneuerbare Energien und (5) Stakeholder Integration.

Abbildung 1: Analytische Dimensionen einer nachhaltigen Transformation des Energiesektors

                                               Dimension I
                                               Klimapolitik
                                                                            Dimension II
            Dimension V                                                     Energiepolitik
                                          Wende zu einem sozial-
       Stakeholder Integration                 integrativen,
                                            klimafreundlichen
                                               Stromsektor

                                  Dimesion IV
                                                                    Dimension III
                             Rahmenbedingungen für
                                                              Zustand des Stromsektors
                              erneuerbare Energien

Quelle: Eigene Darstellung

Als Datengrundlage dienten Studien zum vietnamesischen Stromsektor, THG-Emissionsinventare, Szenarien,
Gesetze und politische Grundsatzpapiere, Jahresberichte und Forschungspapiere. Prinzipiell ist die auf Englisch
verfügbare Datenlage zum vietnamesischen Energiesektor begrenzt. Quellen, Berechnungen sowie Grafiken und
Datentabellen sind in der Langfassung des Berichts aufgeführt.
Die im Rahmen der Studie entwickelten Indikatoren wurden als einfache Ja / Nein-Fragen formuliert, wobei "nein"
einer negativen Bewertung und "ja" einer positiven Bewertung des Übergangs zu einem nachhaltigen Stromsektor
entspricht. Für eine Reihe von Indikatoren wurden internationale Indizes und andere global-vergleichbare
Datenquellen als Benchmark verwendet. Die Langfassung Enthält die Bewertungen im Detail und dokumentiert die
verwendeten Quellen.

1.1     Dimension I: Klimapolitik
Dimension I analysiert die Vietnamesische Klimapolitik. Die Betrachtung dieser Dimension ist von Bedeutung, da
Klimaschutz häufig einen Haupttreiber für Politikmaßnahmen im Bereich erneuerbare Energien (EE) darstellt. Die
Dimension wird von fünf Indikatoren beschrieben: (1) THG-Emissionsentwicklung, (2) Nutzung von CDM- und
NAMA Mechanismen, (3) Existenz von Emissionsreduktionszielen, (4) Stärke der Emissionsreduktionsziele,
(5) Aktionsplan zur Umsetzung der Ziele, auf die im Folgenden eingegangen wird.
Vietnam befindet sich auf einem emissionsintensiven Entwicklungspfad bei dem im Business-as-usual (BAU) die
durchschnittlichen Pro-Kopf-Emissionen über den heutigen globalen Durchschnitt steigen. Emissionsdaten und
BAU-Szenarien für Vietnam wurden im Rahmen der Berichte an die UNFCCC (NC 1, NC 2, BUR 1, INDC)
erstellt. Vietnams THG-Emissionen betrugen im Jahr 2010 246 MtCO2e (einschließlich LULUCF) und die Pro-
Kopf-Emission beliefen sich auf 2,8 t CO2e. Die tatsächliche Emissionsentwicklung in 2010 übertraf die Annahmen
früherer BAU-Szenarien. Die verschiedenen offiziellen BAU-Szenarien korrigierten die zukünftigen
Emissionsannahmen jeweils nach oben. Alle BAU-Szenarien haben gemein, dass sie von weiter stark steigenden
Emissionen insbesondere aus dem Energiesektor ausgehen. Eine nachhaltige Entwicklung im Sinne eines
frühzeitigen Emissionspeaks würde Gegenmaßnahmen erfordern.

                                                                                                                     5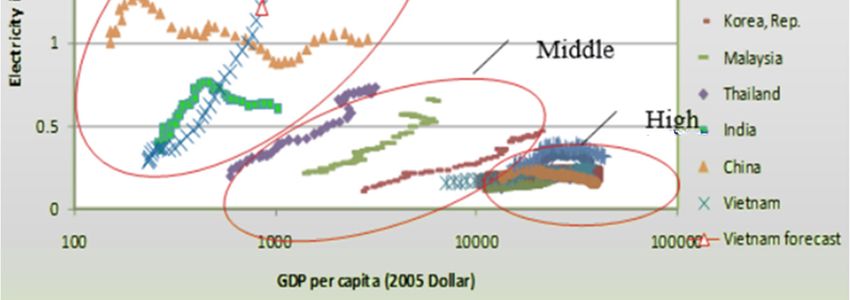
Energy Transition Readiness of Viet Nam

Die vietnamesische Regierung zeigt sich in den National Communications an die UNFCCC besorgt über den
Klimawandel und hat die Bereitschaft zum Ausdruck gebracht Emissionen zu reduzieren und
Emissionsreduktionsziele formuliert. Der Vietnamesischen grünen Wachstumsstrategie (Vietnamese Green Growth
Strategy-VGGS) aus dem Jahr 2012 zufolge können die Emissionen jedoch auch unterhalb des heutigen globalen
Durchschnitts gehalten werden. Dieser Strategie zufolge sollen die Emissionen zwischen 2020 bis 2050 um 1,5-2 %
/ a im Vergleich zum BAU gesenkt werden, was den Anstieg der Emissionen Vietnams auf 391 MtCO2e 2030
reduzieren würde. Der vietnamesische Klimaschutzbeitrag – die Intended Nationally Determined Contribution
(INDC) - der 2015 der UNFCCC kommuniziert wurde, ist demgegenüber konservativer. Er stellt n Aussicht die
BAU-Emissionen als eigenständige nationale Anstrengung bis 2030 von 787,4 MtCO2e, um 8 % auf 724 MtCO2e zu
reduzieren.
Die VGGS nennt zwar eine beträchtliche Anzahl an Maßnahmen zur Erreichung der Klimaziele, u.a. die Nutzung
von Atomenergie und erneuerbarer Energien, es fehlt hingegen eine konkrete Strategie sowie ein Zeitplan zur
Umsetzung.
Vietnam hat überaus erfolgreich den CDM-Mechanismus genutzt, was darauf hinweist, dass prinzipiell die
Fähigkeit und Bereitschaft besteht internationale Hilfe für sich in Anspruch zu nehmen.
Zusammenfassend lässt sich für die Dimension I sagen, dass die Diskussionen zu Klimawandel und Green Growth
bisher die Energiepolitik noch nicht verbindlich beeinflussen. Ob der revidierte Power Development Plan (PDP)
VII, der für das Jahr 2016 erwartet wird den Trend ändert, bleibt abzuwarten.

1.2    Dimension II: Energiepolitik
Dimension II betrachtet die Energiepolitik und wird von folgenden acht Indikatoren beschrieben: (1) politischer
Fokus der Energiepolitik, (2) Entwicklung der Stromnachfrage, (3) Ausbau der Erneuerbaren im Vergleich zur
Entwicklung der Stromnachfrage , (4) Flexibilisierung der Last, ( 5) Energieeffizienzziele, (6) Ziele zum Ausbau der
erneuerbaren Energien nach Quelle, (7) Netzausbau und (8) der Investitionsbedarf im Stromsektor. Hierzu ergeben
sich folgende Ergebnisse:
Im aktuell geltenden PDP VII (2011) waren Klimabedenken noch nicht berücksichtigt. Hier war geplant, den
Stromverbrauch im Jahr 2030, zu 56 % aus Kohle, zu 11 % aus Gas und zu 10 % atomar zu decken. Oberste
Priorität im PDP VII ist die Deckung der Stromnachfrage, gefolgt von der Versorgungsicherheit und der Qualität der
Versorgung. Demgegenüber spielt der Schutz der natürlichen Ressourcen lediglich eine untergeordnete Rolle. Die
Auswirkungen des Plans auf die THG-Emissionen bleiben unerwähnt.
Energieexpert_innen gehen davon aus, dass die Pläne des PDP VII bis 2030 mit einer Verzehnfachung der
Emissionen einhergehen würden. Es besteht augenscheinlich keine politische Kohärenz zwischen der VGGS, der
INDC und dem PDP VII.
Der Ausbau der Erneuerbaren Energieträger im Vergleich zur Entwicklung der Stromnachfrage, stellt sich so dar,
dass der Zubau zur Befriedigung der steigenden Nachfrage hauptsächlich fossil und nuklear erfolgen soll, während
der Anteil erneuerbarer Energien und großer Wasserkraft langfristig kaum ansteigen soll. Der EE-Anteil - fast
ausschließlich aus großer Wasserkraft - lag im Jahr 2015 bei 38 %, bis 2030 soll sich dieser Anteil zunächst bis auf
32 % verringern und sich bis 2050 auf 43 % erhöhen.
In 2016 erfolgt die Revision des PDP VII. Die in 2015 veröffentlichte Erneuerbare-Energien-Entwicklungsstrategie
plant für Vietnam einen massiven Anstieg des Stromverbrauchs von 146 TWh in 2014 bis auf 1051 TWh bis 2050.
Da die RE-DS lediglich 43 % der Stromerzeugung 2050 abdeckt, müssen 57 % durch fossile und/oder nukleare
Ressourcen gedeckt werden. Es wird erwartet, dass der revidierte PDP VII die genaue Zusammensetzung darlegt.
Bisher hat die Regierung keine Maßnahmen erlassen, um die Flexibilität der Energienachfrageseite zu erhöhen. Der
Ausbau von Pumpspeicherkapazitäten wurde in der RE-DS im Vergleich zum PDP VII weiter in die Zukunft
verschoben: Nach der RE-DS sollen bis 2030 2,400 MW statt wie im PDP VII 5,700 MW installiert sein.
Vietnam hat sich Erneuerbare-Energien-Ziele (einschließlich großer Wasserkraft) gesetzt. In 2050 soll demnach
Solarenergie mit 210 TWh die wichtigste EE-Erzeugungsform sein. Biomasse soll 85 TWh bereitstellen, während
die Windenergieziele mit 53 TWh bescheiden bleiben.
Die EE-Ziele nach Technologie sind wie folgt:
- Groß- und Kleinwasserkraft: 2015: 56 TWh (34 %), 2020: 90 TWh (34 %), 2030: 96 TWh (17 %),
- Biomasse: 2020: 7,8 TWh (3 %), 2030: 37 TWh (6,3 %) und 2050: 85 TWh (8,1 %),

6
Situation Analysis of the Vietnamese Electricity Sector

- Wind: 2020: 2,5 TWh (1 %), 2030: 16 TWh (2,7 %) und 2050: 53 TWh (5 %),
- Solar: 2020: 1,4 TWh (0,5 %), 2030: 35,4 TWh (6 %) und 2050: 210 TWh (20 %).
Den offiziellen Ausbauplänen des PDP VII liegen keine Kostenschätzungen bei. Nach Ansicht von Experten wäre
der Plan mit Investitionen in Höhe von USD 50 Mrd. verbunden. Besonders erstaunlich ist das Fehlen einer
Kostendiskussion in Bezug auf den Einstieg in die Atomenergie, der für 2024 geplant ist.
Auf Basis dieser Erkenntnisse bleiben die Bedingungen für erneuerbare Energien zweideutig, während EE-Ziele
vorhanden sind, die eine grundsätzliche Bereitschaft widerspiegeln, den Sektor zu entwickeln, wird den
erneuerbaren Energien nicht zugetraut langfristig die Hauptquelle der Stromlieferung darzustellen. Aktuell sind die
Rahmenbedingungen für den Ausbau erneuerbarer Energien in Vietnam nicht ausreichend, die zuletzt vorgelegte
Erneuerbare-Energien-Entwicklungsstrategie der Regierung (RE-DS) ist aber ein Anzeichen, dass sich das
Investitionsklima in einigen Jahren z.B. durch die Einführung von PV-Einspeisetarifen oder Portfoliostandards
verbessern könnte.

1.3    Dimension III: Zustand des Stromsektors
Dimension III untersucht die Situation des Stromsektors mit Hilfe von fünf Indikatoren: (1) Stromemissionsfaktor,
(2) Übertragungsnetzverluste, (3) Bewertung nach dem “Getting electricity” Indikator, (4) Strommarktstruktur und
(5) Energiesubventionen.
Im Jahr 2014 betrug Vietnams Stromerzeugungskapazität 34 GW. Die einsetzbaren Kapazitäten werden aber mit
23 GW als deutlich niedriger eingeschätzt.
Die Elektrizitätsproduktion im Jahr 2014 betrug 146 TWh dominiert von Wasserkraft (38 %), Erdgas (31 %) und
Kohle (26 %). Der Netzstromemissionsfaktor hat durch den hohen Anteil an Wasserkraft aktuell noch eine
vergleichsweise niedrige CO2-Intensität von 0,636 t CO2 / MWh, diese steigt aber mit zunehmendem fossilen
Kraftwerksanteil. Obwohl sich die Stromproduktion zwischen 2005 und um das 3,6-fache erhöht hat, bleibt die
Versorgung unzureichend. Insbesondere während Dürreperioden wie etwa im Jahr 2011 kam es in Spitzenlastzeiten
zu Ausfällen und Zwangsabschaltungen.
In der Kategorie “getting electricity” des Welt Bank Doing Business Index wird die Qualität des Stromversorger
Electricity of Viet Nam (EVN) als moderat bewertet. Vietnam rangiert in der oberen Hälfte des Indikators, wenn
auch nur an Position 108 von 189.
Die Übertragungsnetzverluste sind mit 9 % im internationalen Vergleich des Weltbank Development Index
durchschnittlich, liegen aber noch weit höher als in Länder mit hohem Einkommen (Weltbank-Katetegorie: High-
Income Countries).
Nur bei der Energieerzeugung sind andere Marktakteure zugelassen. In 2014 produzierte EVN nur noch 43 % des
Stroms. Petro Vietnam (PVN) ist mit 13 % Marktanteil das zweitgrößte Energieunternehmen, bereits 22 % der
Stromerzeugungskapazität sind in Besitz von unabhängigen Energieunternehmen. Es gibt keinen Endkundenmarkt,
hier erfolgt die Versorgung ausschließlich durch EVN. Es gibt keine gesetzliche Regelung zur Stromeigenerzeugung
auf Verbraucherseite und folglich auch keine Regelung zur Abnahme von Überschussstrom von Eigenerzeugern.
Öffentlich verfügbare Informationen zur finanziellen Situation von EVN geben kein klares Bild der tatsächlichen
Situation. Der durchschnittliche Haushaltstarif beträgt 1622 VND / kWh (~ 0,07 Euro / kWh). Damit liegt er unter
den Erzeugungskosten, was kontinuierliche Subventionen an EVN notwendig macht. Die IEA schätzt die Höhe der
Energiesubventionen für das Jahr 2010 auf 2,69 Mrd. US-Dollar, das entsprach 2,83 % des BIP. UNDP geht davon
aus, dass der durchschnittliche Strompreis auf 8 - 9 USD ct / kWh steigen müsste, um den Sektor nachhaltig zu
betreiben. Subventionen erzeugen Fehlanreize für Energieeinsparungen. Stromeigenverbrauchsmodelle bzw. die
Direktbelieferung von Endkunden konnten sich bislang auf Grund stark subventionierter Endverbraucherpreise nicht
etablieren.
Im PDP VII heißt es, dass die Strompreise durch Marktmechanismen gebildet werden sollen. Die VGGS (2012)
kündigte einen Fahrplan zum Ausstieg aus der Subventionierung fossiler Brennstoffe an. Die politischen
Entscheidungsträger haben die Problematik von Energiesubventionen erfasst, entsprechende Maßnahmen sind
bislang aber ausgeblieben.
Zusammenfassend erschweren das Energiesubventionsniveau und die Monopolstellung von EVN den Eintritt der
erneuerbaren Energien in den Vietnamesischen Energiemarkt.

                                                                                                                      7
Energy Transition Readiness of Viet Nam

1.4    Dimension IV: Rahmenbedingungen für erneuerbare Energien
Dimension IV nutzt folgende 10 Indikatoren, um die Rahmenbedingungen für erneuerbare Energien zu beschreiben:
(1) EE-Potenzialkarten , (2) politische und rechtliche EE-Rahmenbedingungen, (3) EE-Einspeisevorrang,
(4) Existenz von Netzcodes, (5) EE-Fördermechanismen (6) Energiepolitik-Monitoring, (7) Zugang zum
Endkundenmarkt, (8) EE-Marktgröße und -reife, (9) EE-Finanzierung und (10) EE-Lieferketten. Für diese
Indikatoren ergeben sich folgende Ergebnisse:
Die Regierung hat Annahmen zu Wind- und Solarpotenzialen veröffentlicht. Die grundsätzliche Verfügbarkeit von
Daten und die Qualität der Karten werden aber von Experten als begrenzt und unzureichend beschrieben.
Kleine Wasserkraft bis 30 MW enthält einen Avoided-Cost-Tarif (ACT), der eine Wirkung entfaltet hat. Die
Konstruktion von Staudämmen hat jedoch Auswirkungen auf die lokale Bevölkerung und die Wasserverfügbarkeit
für die Landwirtschaft. Vietnam hat Einspeisetarife für Windenergie eingeführt, die allerdings auf Grund ihrer Höhe
keine Wirkung entfaltet haben. Die Wirkung des Einspeisetarifs für Biomasse kann noch nicht bewertet werden. Ein
Einspeisetarif für Solar ist geplant, aber noch nicht veröffentlicht. Die RE-DS erwähnt zukünftig die Einführung
spezifischer Maßnahmen wie die Entwicklung eines Renewable Portfolio Standards, um den EE-Ausbau anzuregen.
Die Datenlage zu erneuerbarer Energieerzeugung, installierten Anlagen und sogar der Ressourcenverfügbarkeit ist
nicht gut. Vietnam verfügt nicht über ein öffentliches EE-Anlagenregister. Die Datenlage insbesondere zu
Wasserkraftanlagen ist schlecht. Die von EVN veröffentlichten Projektlisten zu Biomasse, Wind und Solar zeigen
hingegen, dass in Vietnam bis auf einige Windparks bislang kaum nennenswert Projekte realisiert wurden.
Ansätze für eine EE-Lieferkette, wie bspw. die Produktion von Turbinentürmen, existieren bereits, diese Ansätze
könnten sich bei einer nationalen Marktentwicklung zu einem nationalen erneuerbaren-Energien-Sektor ausweiten.
Die Zinssätze von 8.7 % sowie die Kapitalkosten realisierter Windenergieprojekte liegen unterhalb der der
Nachbarländer, demensprechend wurden Finanzierungskosten von uns nicht als primärer Hinderungsgrund für eine
EE-Entwicklung eingeschätzt.
In den letzten Jahren wurden einige Wasserkraftprojekte realisiert. Eine nennenswerte Entwicklung bei der
Installation von Solar- und Wind hat jedoch nicht stattgefunden. Diese Entwicklung ist in Übereinstimmung mit den
wenig ambitionierten 2020-EE-Zielen, bei derzeitigem Tempo könnten jedoch selbst diese Ziele verfehlt werden.

1.5    Dimension V: Stakeholder Integration
Dimension V untersucht die Integration verschiedener Stakeholder in den Stromsektor sowie in die Energiepolitik
auf Basis von drei Indikatoren: (1) zivilgesellschaftliche Aktivitäten im Energiesektor, (2) Offenheit des
Energiesektors für neue Akteure und (3) Bewertung im Environmental Democracy Index.
In Vietnam ist ein allgemeines Umweltbewusstsein innerhalb der Zivilgesellschaft vorhanden, aber nur eine
begrenzte Anzahl von Organisationen ist speziell im Energiesektor aktiv. Zivilgesellschaftliches Engagement im
Energiesektor konzentrierte sich bislang auf die negativen Folgen von Staudammprojekten, es kam auch zu ersten
Protesten gegen Kohlekraftwerke durch benachbarte Gemeinden. Projektbeispiele für an das Netz angeschlossene
Bürgerenergie, z.B. in Form von Landwirten, die eigene Biomasse-Anlagen betreiben, konnten nicht gefunden
werden. Vietnam schneidet beim Environment Democracy Index unterdurchschnittlich ab.

1.6    Zusammenfassung
Unsere Analyse hat gezeigt, dass Vietnam sich Klimaschutzziele gesetzt hat. Die neusten Ziele, die in der INDC
vorgelegt wurden, können aber als sehr zurückhaltend beschrieben werden, insbesondere im Vergleich mit dem
nationalen Ziel der VGGS. Die Beziehung zwischen der INDC und der VGGS bleibt unklar. Unabhängig davon,
welche Ziele anzulegen sind, spiegeln sie sich aktuell nicht in der vietnamesischen Energiepolitik wider. Bis zum
Jahr 2050 ist zwar ein erheblicher Ausbau "neuer" erneuerbarer Energien - Sonne, Biomasse und Wind – geplant,
tatsächlich sollen diese aber langfristig lediglich ein Drittel zur Stromversorgung beitragen. Das Nachfrageszenario
geht von einer extremen Entwicklung aus, was auf eine wenig ambitionierte Effizienzpolitik hindeutet. Die
Regierung hat erste vorsichtige Schritte für die Markteinführung erneuerbarer Energien unternommen, aber die
aktuellen Bedingungen waren bislang für den Ausbau von neuen EE-Formen unzureichend.

8
Situation Analysis of the Vietnamese Electricity Sector

Abbildung 2 fasst die Ergebnisse der Indikatoren in den fünf Dimensionen zusammen.1 Die Mehrheit der
formulierten Indikatoren erhielt eine wenig vorteihafte Bewertung, nur etwa ein Drittel konnte positiv bewertet
werden. Die Aussichten auf eine baldige Energiewende in Vietnam sind tendenziell und kurzfristig nicht sehr gut.
Langfristig ist ein Ausbau der erneuerbaren Energien geplant, aber kurzfristig sind dafür weder die rechtlichen noch
die planerischen Rahmenbedingungen gegeben. An den anderen möglichen Ansatzpunkten nachhaltiger
Energiepolitik – z.B. nachfrageseitige Energiepolitik, Einbindung der Zivilgesellschaft und von Community
Organizations – wird auf nationaler Ebene nicht gearbeitet.

Abbildung 2: Zusammenfassung der Indikatorenbewertungen

    100%
     90%                      13%                                                     15%
                                                           27%           33%
     80%      40%
                              23%             53%
     70%                                                                              30%
     60%
                                                           36%
     50%
     40%
     30%      60%             65%                                        67%
                                                                                      55%
     20%                                      47%
                                                           37%
     10%
      0%
               DI              DII            DIII         DIV           DV
             Klima-          Energie-        Strom-      Rahmen-   Stakeholder       Gesamt
             politik          politik        sektor    bedingungen Integration
                                                            EE

                                        Ja    Nein    Keine Daten

Quelle: Eigene Darstellung

1Für die Summe wurde jede Dimension gleichwertig additiert, unabhängig von der Anzahl an Einzelindikatoren in jeder
Dimension.

                                                                                                                         9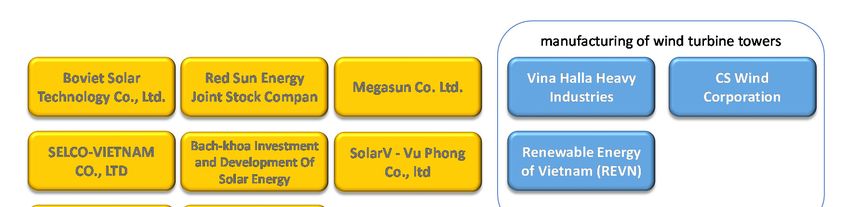
Energy Transition Readiness of Viet Nam

2 Situation Analysis of the Vietnamese Electricity Sector

2.1    Research question and methodology
The study at hand gives an overview of the framework conditions for a transition towards a socially inclusive
renewable energy based electricity sector in Viet Nam. The Paris Agreement 2015 states that peaking of global
emissions has to occur as soon as possible, and that climate neutrality has to be achieved in the second half of the
21st century.
The decarbonisation of the electricity sector is a corner stone for climate neutrality and since key technologies are
available already, decarbonisation is much easier than for other emission sources. While allowing economic
development and increasing electricity supply - this study considers renewable energy to be the adequate tool to
sustainably decarbonize the power sector.
Using a series of indicators, this study assesses the readiness for an energy transition and a low carbon pathway in
Viet Nam. Even though the transport and heat sections of the energy sector are relevant for greenhouse gas (GHG)
emissions, our analysis concentrates on the enabling environment of the electricity sector.
The study evaluates to what degree Viet Nam is prepared to move towards sustainable energy, and identifies barriers
that exist for a start towards an energy transition. The analysis is based on 31 indicators formed by 59 questions and
sub questions. The indicators asses the national enabling framework in five dimensions: (1) climate change policy,
(2) energy policy, (3) electricity sector set-up, (4) renewable energy framework and (5) stakeholder inclusion (see
Figure 1). Indicators track characteristics of the enabling environment of sustainable renewable energy deployment
as well as the degree of civil society involvement in energy planning and investment.
Figure 1: Dimensions of the enabling environment of a renewable energy transition

                                            Dimension I
                                        Climate change policy
                                                                             Dimension II
           Dimension V                                                       Energy policy
                                           Transition to a
       Stakeholder inclusion
                                         socially inclusive
                                     low carbon energy system

                             Dimesion IV
                                                                     Dimension III
                           Renewable energy
                                                                Electricity sector set-up
                              framework

Source: own illustration
Data was collected from a variety of studies on the Vietnamese electricity sector, GHG-inventories, scenarios,
legislation on energy and climate change, annual reports and research papers. Sources, calculations as well as graphs
and data tables are listed in the annex.
Data for the Vietnamese power sector is scattered over a multitude of sources and a considerable amount of
information is only available in the form of ministerial presentations. We could not find analysis of the emission
developments related to the power development plans and cost scenarios related to these trajectories. In respect to
the costs, the resulting electricity price would be additional useful information. The government does not provide a
data base to track its renewable energy expansion. Overall information about installed capacities and their
characteristics remain insufficient.
The indicators used in the study at hand where framed as simple yes/no questions where “no” is a negative rating
and “yes” a positive one. Table 1 shows the indicators used for each dimension.

10
Situation Analysis of the Vietnamese Electricity Sector
Table 1: List of indicators and lead questions
Indicator Lead question
Dimension I - Climate change policy
1) GHG-emission trajectory Will Viet Nam’s per capita emissions in the BAU scenario for 2030 stay below the
2012 global average GHG emissions of 6.76 tCO2 per capita?
2) Existence of GHG-emission Does Viet Nam have binding emission reduction targets?
reduction targets
3) Strength of GHG-emission Does Viet Nam plan to stay below emission levels equivalent to current global
reduction targets average?
4) Number of CDM projects and Is Viet Nam experienced with the use of international emission market and climate
NAMAs financing instruments?
5) Action plan for GHG-mitigation Does Viet Nam have an action plan to implement climate mitigation targets?
Dimension II - Energy policy
1) Political focus of energy policy Does the government consider decarbonisation a main political priority in its energy
policy?
2) Future electricity demand Is per capita electricity production expected stay below 2012 high-income countries
average of 9,066 kWh/capita?
3) Trajectory for RE Is electricity demand expected to be increasingly covered by RE?
4) Load management Does the government have several policies in place to shift electricity demand?
5) Energy efficiency targets (by Has the government set energy efficiency targets?
sector)
Are there sectoral targets?
6) Renewable energy targets by Has the government set targets for RE technologies ( hydropower/
source biomass/wind/solar/geothermal)?
7) Grid expansion Does the current transmission planning consider renewable energy scale-up?
8) Investment needs in the Has the government estimated power sector investment needs?
electricity sector
Dimension III - Electricity sector set-up
1) Grid electricity emission factor Is the grid electricity emission factor below Asia’s average grid electricity factor of
990 tCO2/MWh?
2) Transmission losses in % Are transmission losses below the global average of 8.1 % (2011)?
3) “Getting electricity” rank Is Viet Nam’s “getting electricity rank” in the upper half of all countries?
4) Electricity market structure Is the electricity market open to new market actors in the power production sector? In
the final consumer sector? In the distribution sector?
11Energy Transition Readiness of Viet Nam
Indicator Lead question
5) Electricity subsidies Do electricity prices reflect full costs of power generation?
Is there a commitment to reduce electricity price subsidies?
Is there an action plan to reduce electricity price subsidies?
Dimension IV - Renewable energy framework
1) Official atlas on RE potentials Does the Government publish a high quality and high resolution set of national maps
on renewable energy resources for small hydropower, solar, wind, biomass,
geothermal?
2) Political and legal framework Does the country have a renewable energy action plan to implement the targets?
conditions for RE
3) Prioritized grid access Can renewable energy easily access the grid? Is there a prioritized access to the grid
for renewable energy?
4) Grid code Is there a grid code – or specific operational rules – for managing small hydropower,
solar, wind, biomass, geothermal?
5) RE-support mechanisms Do price subsidies or premiums exist to support small hydropower, solar, wind,
biomass, geothermal?
Are price incentives differentiated by size of the installation for small hydropower,
solar, wind, biomass, geothermal?
Do the legal or regulatory frameworks include a formula for price change/adjustment
or require regular reviews?
6) Monitoring Is the government on track regarding installed capacity in accordance with its
targets?
7) Final consumer market Are grid electricity tariffs for final consumers higher than RE-LCOEs? For which
opportunities REs?
8) Market maturity Is the number of projects realized per year > 20 by technology?
9) RE-financing Can financing be accessed at affordable rates?
10) RE-supply chain Does Viet Nam produce RE equipment locally?
12Situation Analysis of the Vietnamese Electricity Sector
Indicator Lead question
Dimension V - Stakeholder inclusion
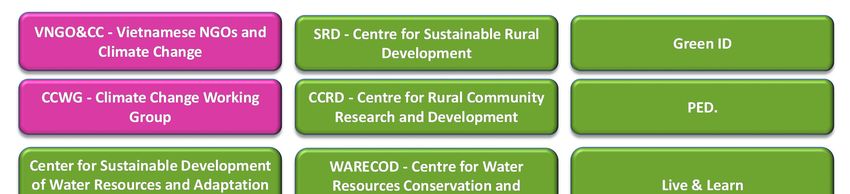
1) Civil society activity in the Are more than five NGOs predominantly engaged with energy issues?
energy sector
2) Openness of the energy market Are natural persons, citizen groups or small farmers active in on-grid new renewable
energy?
3) Environmental democracy Is Viet Nam’s Environmental Democracy rank above global average?
BAU: business as-usual, CDM: Clean development mechanism, LCOE: Levelized cost of electricity, NAMAs: National
Appropriate Mitigation Actions, NGO: Non-governmental organisation, RE: renewable energy.
Source: own table
The indicators are resulting in “red lights” or “green lights” for energy system sustainability transitions. Several of
these indicators require a benchmark to be meaningful. International indices and data basis were used as a means of
comparison. Table 2 lists the benchmark data sources used.
Table 2: List of benchmarks for the indicators used
Dimension No. indicator Benchmark Data sources
D I 1. GHG-emission Global average per capita GHG emissions WRI CAIT Climate Data Explorer
trajectory including Land-Use Change and Forestry in
2012: 6.76 tCO2e per capita
D I 4. Strength of GHG-
emission reduction
targets
D II 2. Electricity demand Is per capita electricity production expected stay Own calculation based on World
below 2012 high-income countries average of Bank Development Index Data
9,066 kWh/capita?
D III 1. Grid electricity Asia’s average grid electricity factor of average IGES grid electricity emission
emission factor operating margin: 990 tCO2/MWh factors (2015)
D III 2. Transmission losses Global average transmission losses 2011: 8.1 % World Bank Development Index
D III 3. Getting electricity rank “Getting electricity rank” in the upper half of World Bank Doing Business Index
189 ranks
D IV 11. RE-financing Lending interest rates in 2014 below 10 % World Bank Development Index
D V 3. Environmental Global average in the Environmental Democracy: Environmental Democracy Index
democracy 1.42
Source: own table
The following section presents the results for the individual dimensions: (1) climate change policy, (2) energy policy
framework, (3) electricity sector set-up, (4) renewable energy framework and (5) stakeholder inclusion.
13Energy Transition Readiness of Viet Nam 2.2 Results of dimension I: Climate change policy Dimension I covers climate policy and is described by five indicators. Climate mitigation is a main driver for renewable energy (RE) policy and for policies improving the RE-business environment such as a reduction of fossil fuel subsidies. Emission data and business as-usual (BAU) -scenarios were published by the Vietnamese government in the 1st National Communication (NC 1) to the UNFCCC in 2003, the 2nd National Communication (NC 2) in 2010 the Initial Biennial Updated Report (BUR 1) in 2014 and the Intended Determined National Contribution (INDC) in 2015.Viet Nam’s GHG-emissions in 2010 were 246 MtCO2e (including LULUCF) and per capita emission were 2,8 t CO2e. Past BAU-scenarios for 2010 proved to be overly optimistic and were surpassed by emission increases. Official BAU-scenarios for 2020 and 2030 give a wide range of possible developments. In all of these scenarios most emissions result from the energy sector, in the BUR 1 scenario this is even 85 % of future emissions. The analysis of dimension I highlights that with respect to the GHG-emission trajectory, current scenarios show a significant increase of carbon emissions. Resulting levels will be well above today’s global average per capita. A sustainable path would require counteractions. The Vietnamese government is concerned about climate change and has expressed the willingness to tackle emissions nationally in its National Climate Change Strategy (NCCS, 2011), in the Vietnamese Green Growth Strategy (VGGS, 2012) and in its INDC (2015), and has formulated emission reduction targets. According to the VGGS overall emissions are supposed to be cut without international assistance by 1.5-2 %/a from 2020 until 2050 compared to BAU, which would lead to an increase of Viet Nam’s emissions to 391 MtCO2e by 2030. The internationally communicated pathway by the INDC (2015) is more conservative and states that by 2030 Viet Nam will reduce its BAU-GHG-emissions of 787.4 MtCO2e by 8 %, which would result in 724 MtCO2e. The VGGS domestic target would keep emissions below current global averages. Unfortunately, the target was not included in the INDC. Viet Nam has been successfully applying the tools offered internationally to finance clean development, indicating Viet Nam’s capability and willingness of making use of international assistance if offered. A significant number of planned measures are proposed in the VGGS including nuclear power and RE, but the strategy is lacking precision, concrete time frames and expected results. Overall climate change has not yet emerged as a key driver of policy making in Viet Nam. The revised PDP VII, awaited for 2016, might change this since the prime minister has announced to stop additional constructions of coal power plants. Table 3 summarizes the results of the indicators for dimension I. Table 3: Dimension I: Summary of indicator ratings for climate change policy Indicators of dimension I –climate change policy Rating 1. GHG-emission trajectory No 2. Existence of GHG-emission reduction targets Yes 3. Strength of GHG-emission reduction targets No 4. CDM projects and NAMAs Yes 5. Action plan for GHG-mitigation No Source: own table Table 4 lists the indicators, questions and results for dimension I. Figures, sources and calculations are listed in the annex. 14
Situation Analysis of the Vietnamese Electricity Sector

  Table 4: Results of dimension I: Climate change policy

Indicator           Lead question                     Rating   Explanatory note

1) GHG-emission     Will Viet Nam’s rank in           No       GHG-emissions in 2010 were 246 MtCO2e (including LULUCF) resulting to about 2,8 tCO2e per capita. In respect to CO2
    trajectory      average per capita emissions in            only, per capita emissions of Viet Nam were 1.97 MtCO2 in 2011 compared to a global average of 6.76 tCO2e/capita. The
                    the BAU by 2030 stay below                 government has presented four official BAU-scenarios. The two available 2010 scenarios where both inaccurate and
                    the 2012 global average of                 Viet Nam’s emissions were much higher than the expected 141 MtCO2e to 169 MtCO2e. Actual emissions in 2010 were
                    6.76 tCO2e?                                246 MtCO2e (including LULUCF). 2020 scenarios range between 233 MtCO2e and 447 MtCO2e and 2030 scenarios offer a
                                                               range between 516 MtCO2e and 787 MtCO2e. The 2030 BAU-scenarios of BUR 1 and INDC suggest that Viet Nam reaches
                                                               per capita emissions levels of 7.43 tCO2e comparable to todays developed countries.

2) Existence of     Does Viet Nam have binding        Yes      The government formulated targets in the VGGS, the INDC and the RE-DS.
    GHG-emission    emission reduction target?
                                                               The VGGS targets state that emissions in energy activities shall be reduced by 10 % below BAU by 2020 (20 % with
    reduction
                                                               international assistance) and by 20 % below BAU by 2030 (30 % conditional on assistance). The RE-DS changed these
    targets
                                                               targets: GHG-emissions in „various energy activities“ shall be reduced by 5 % below BAU until 2020, 25 % below BAU
                                                               until 2025 and 45 % below BAU for 2050.
                                                               According to the VGGS overall emissions were supposed to be reduced to 391 MtCO2e unconditionally and by 1.5-2 %/ a
                                                               compared to BAU until 2050. The INDC states that by 2030 Viet Nam will reduce its BAU- GHG-emissions of
                                                               787.4 MtCO2e by 8 % which would result in 724 MtCO2e.

3) Strength of      Does Viet Nam plan to stay        No       In the VGGS trajectory emissions would increase but remain below the 2012 global average of 6.76 tCO2e/capita. The
    GHG-emission    below emission levels                      INDC commitment would increase emission levels to around 7 tCO2e/capita. For the purpose of the rating the INDC
    reduction       equivalent to current global               communication will be used.
    targets         average?

4) CDM projects     Is Viet Nam experienced with      Yes      In 2015 Viet Nam was ranked 4th in the world for the number of registered CDM projects, hosting 254 projects of which
    and NAMAs       the use of emission market                 almost 90 % were energy projects. Viet Nam is preparing the implementation of NAMAs in the waste, steel, cement,
                    instruments?                               chemical fertilizer, wind power and biogas sectors.

                                                                                                                                                                                       15
Energy Transition Readiness of Viet Nam
Indicator Lead question Rating Explanatory note
5) Action plan for Does Viet Nam have an action No The VGGS states as possible instruments the establishment of a management system and trading of certified GHG-
GHG- plan to implement the targets? emissions, carbon taxes, fees and levies, certification and eco-labelling system for green products, and energy efficient
mitigation equipment and green taxes. Further on it announces a roadmap to phase out subsidies for fossil fuels and a roadmap to
initiate green procurement. The mitigation policy instruments are not specified by dates or expected mitigation results,
therefore the VGGS is not considered to constitute an action plan.
BAU: Business As-usual, GHG: Greenhouse gas INDC: Intended Determined National Contribution, NAMAs: National Appropriate Mitigation Actions, RE-DS: Renewable Energy Development
Strategy, VGGS: Vietnamese Green Growth Strategy
Source: own table
16Situation Analysis of the Vietnamese Electricity Sector
2.3 Results of dimension II: Energy policy
Dimension II covers the energy policy and is described by eight indicators with respective questions.
For dimension II the present conditions for renewable energy are mediocre while the future looks more bright.
Climate change concerns were not yet reflected in the 2011 Power Development Plan (PDP) VII. The electricity
consumption in 2030 was planned to be covered by coal (56 %), gas (11 %) and nuclear (10 %). The main concern
of the PDP VII is to cover the electricity demand, followed by concerns of fuel security and quality of the electricity
provided. Protection of natural resources is listed as a 4th objective while emissions are not mentioned in the
PDP VII.
Official emission scenarios of the PDP VII are not available but experts claim that if the expansion goes ahead as
planned in PDP VII, CO2-emissions are likely to increase tenfold by 2030 in that case the PDP VII would not
correspond to the VGGS. There is no policy coherence between the VGGS, the INDC and the PDP VII. In the
government’s Renewable Energy Development Strategy (RE-DS, 2015) fossil-fuel and nuclear have a share of 57 %
(15-20 % nuclear share) by 2050, the emission consequences remain unclear. The revised PDP VII is expected to
clarify how the remaining fossil and nuclear fuel parts will be covered.
In a statement in January 2016 the government announced that future energy plans will follow “international
commitments on cutting emissions“and that all plans of coal-fired power plants will be reviewed. Since the INDC
includes per capita emissions of 7 tCO2e, the effect of this commitment on energy policy would need further
analysis.
The latest electricity demand scenarios presented in the RE-DS 2015 show consumption levels comparable to the
very top of today’s national per capita electricity consumers. Viet Nam is expecting a massive increase in electricity
consumption from 146 TWh in 2014 to 266 TWh by 2030, 581 TWh by 2040 and 1,051 TWh by 2050.
The basis for these assumptions are not clarified, so it remains unclear whether they are a result of electricity using
industrial sectors like aluminium or electric steel or based on innovative models like the electrification of the
transport sector.
The power capacity additions are planned to be covered to a large extent by fossil fuels and nuclear. RE will not be
expanded disproportionally and the RE-share (including large hydropower) will first decrease from 38 % in 2015 to
32 % in 2030 and then increase again to 43 % in 2050.
The government has put in place an energy efficiency strategy. The Viet Nam energy efficiency program (VNEEP)
sets targets for savings of 5-8 % of total national energy consumption compared to BAU levels. The relationship
with the power development planning is not clear.
So far the government has not enacted measures to increase the flexibility of the energy demand side. Storage
additions - in the form of pump storage - have been postponed.
Viet Nam has set renewable energy targets (including large hydro) with solar power being the most important RE in
2050. These targets are based on the assumption of stalk electricity demand increases. Viet Nam has ambitious 2050
solar (210 TWh) and biomass targets (85 TWh) while its wind power targets remain modest (53 TWh). With respect
to the energy demand scenario the share of renewables remains nevertheless mediocre. The targets are as follows:
- Total hydro: 2015: 56 TWh (34 %), 2020: 90 TWh (34 %), 2030: 96 TWh (17 %),
- Biomass: 2020: 7.8 TWh (3 %), 2030: 37 TWh, (6.3 %), and 2050: 85 TWh (8.1 %),
- Wind: 2020: 2.5 TWh (1 % of total electricity production), 2030: 16 TWh (2.7 %), and 2050:
53 TWh (5 %),
- Solar: 2020: 1.4 TWh (0.5 %), 2030: 35.4 TWh (6 %), and 2050: 210 TWh (20 %).
The costs associated with fossil, nuclear or renewable energy expansion plans have not been published. According
to experts the PDP VII would require investments of USD 50 bn by 2020. Official cost calculations for the PDP VII
are not included in the plan but might be available as an internal document. Particularly astonishing is the lack of a
cost discussion regarding the nuclear expansion plans. The first nuclear power plant is expected to go on grid in
2024.
Based on these findings the conditions for renewable energy remain ambiguous, while RE-targets are in place which
shows the overall willingness to develop the sector, renewables are not entrusted to be the main form of electricity
delivery. A sustainable transformation of the energy sector is currently not planned neither does the government
17Energy Transition Readiness of Viet Nam
make a clear connection between its energy development plans and it’s climate change targets particularly those
listed in the VGGS.
Table 5 shows the result of the indicator rating for dimension II.
Table 5: Dimension II: Summary of indicator ratings for energy policy
Indicators of dimension II - energy policy Rating(1)
1) Political focus of energy policy No
2) Electricity demand scenarios No
3) Trajectory for RE No
4) Load management No
5) Energy efficiency targets (by sector) Yes
No
6) Renewable energy targets by source Yes , Yes , Yes , Yes , No
7) Grid expansion [nd]
8) Investment needs in the electricity sector No
(1)multiple rating occur if the indicator includes multiple questions [nd] no data obtained or available
Source: own table
Table 6 lists the indicators, questions and results for dimension I. Figures, sources and calculations are listed in the
annex.
18Situation Analysis of the Vietnamese Electricity Sector
Table 6: Questions and results for dimension II – energy policy framework
Indicator Lead Question Answer Explanatory note
1) Political focus of Does the government state No The PDP VII states as its first objective the supply of electricity „in conjunction with the national
energy policy decarbonisation as a main political socio-economic development strategies“. As its 4th objective the PDP VII also includes the
priority in its energy policy? „development of power along with protection of natural resources, ecological environment and
ensuring sustainable development of the country.“
2) Electricity demand Is per capita electricity production No The government has published demand scenarios in the PDP VII and the RE-DS. The latest scenario
scenarios expected stay below 2012 high-income from the RE-DS reduces near time energy demand scenarios for 2020 from 329 TWh to 266 TWh, and
countries average of 9,066 kWh/capita? from 695 TWh to 581 TWh in 2030. The assumption for 2050 in the RE-DS - based on own
calculations - is a demand of 1,051 TWh. Per capita electricity consumption in this scenario would
increase to 9,668 kWh, comparable to today’s electricity consumption levels of Korea or Australia.
3) Trajectory for RE Is increased electricity demand expected No Electricity production in 2014 was dominated by large hydro (2014: 55 TWh/38 %), followed by
to be covered by renewable energy? natural gas (2014: 45 TWh/ 31 %) and coal (2014: 38 TWh/ 26 %).
The fossil fuel targets according to PDP VII for 2020 are a 54 % supply by coal, 20 % from hydro and
19 % from gas. 85 % of the emissions expected in the BAU of BUR 1 result from energy production
planned. The PDP VII and the Nuclear Power Development Plan state that nuclear shall provide for
10 % of electricity by 2020 and 15-20 % by 2050. According to the RE-DS the total RE-electricity-
share is planned to increase only slightly in the long run and to be 38 % by 2020, 32 % by 2030 and
43 % by 2050.
4) Load management Does the government have several No Peak demand varied between 20 GW in 2013 and 22 GW in 2014. Demand curve peaked in 2011 and
policies in place to shift electricity 2012 at 10:00 and in 2013 at 18:00. Peak demand is expected to increase to 110 GW by 2030. The
demand? government has put in place an off-peak-peak differentiated tariff for industrial consumers but no
explicit tools to shift demand.
5) Energy efficiency Has the government set energy efficiency Yes The VNEEP targets for savings of 5-8 % of total national energy consumption compared to BAU
targets (by sector) targets? levels. According to experts, the electricity efficiency targets do not correspond to the energy demand
No
scenarios.
Are there sectoral targets?
19Energy Transition Readiness of Viet Nam
Indicator Lead Question Answer Explanatory note
6) Renewable energy Has the government set targets for __________ The technologies listed in the RE-DS in order of importance are hydropower, solar, biomass and wind.
targets by source renewable energy technologies, for _________
• The share of hydropower (large and small) is decreasing with the increase of overall
Hydropower? Yes production from 34 % in 2020 to 17 % and – based on own calculation – to 10 % in 2050.
• The solar targets are: 0.5 % by 2020, 6 % by 2030, 20 % by 2050.
Solar? Yes
• Biomass shall provide for 3 % of electricity by 2020, 6.3 % by 2030 and 8.1 % by 2050.T
Biomass? Yes • The targets for wind are: 1 % by 2020, 2.7 % by 2030 and eventually 5 % by 2050.
• There are no targets for geothermal.
Wind? Yes
Geothermal? No
7) Grid expansion Does the current transmission planning [nd] Transmission grids in Viet Nam run on 220 and 500 kV. The investment focus for 2015 is on
consider renewable energy scale-up? improving transmission capacity from the north to the south. Wether plans consider RE electricity
scale up effects on the grid infrastructure could not be obtained.
8) Investment needs in Has the government developed an No The government plans are not delivered with a detailed cost analysis but according to experts the
the electricity sector investment cost estimation? PDP VII would require investments of USD 50 bn by2020.
VNEEP- Viet Nam Energy Efficiency Program, BAU-business as usual, BUR 1- Initial Biennial Updated Report, RE-DS- Renewable Energy Development Strategy, PDP VII- Power
Development Plan VII
Source: own table
20Situation Analysis of the Vietnamese Electricity Sector
2.4 Results of dimension III: Electricity sector
Dimension III covers the situation of the electricity sector and is described by five indicators, due to a series of sub-
questions there are nine ratings for this dimension.
Viet Nam’s electricity generation capacity in 2014 was 34 GW. Functional capacities are considered to be far lower
at about 23 GW, which would correspond to the 2014 peak demand of 22.2 GW. Electricity production in Viet Nam
has increased 3.6 times in the decade between 2005 and 2015. Electricity supply remains insufficient, during
drought periods such as 2011 peak demand had to be curtailed regularly.
Electricity production in 2014 was 146 TWh dominated by hydro (38 %), natural gas (31 %) and coal (26 %). The
electricity sector set-up from which Viet Nam would need to start transitioning is already comparatively low-carbon
due to a large share of hydropower. The grid electricity emission factor of Viet Nam of 0.636 tCO2/MWh in
2011/2012 is comparatively low, but will increase rather than decrease due to the expansion plans.
The quality and efficiency of the system in place is average by international standards: transmission and distribution
losses in 2014 were 9 %, which makes them comparable to global averages but far higher than in high-income
countries. Viet Nam therefore shows considerable room for improving the efficiency and thereby sustainability of
the energy sector, still a large share of electricity is wasted during transmission.
Service reliability indices in 2014 were a System Average Interruption Duration Index (SAIDI) with 3.134 minutes,
System Average Interruption Frequency Index (SAIFI) of 18.1/customer and a Momentary Average Interruption
Frequency Index (MAIFI) of 2.63/customer.
EVN provides moderate services to electricity customers as assessed by the “get electricity” indicator of the World
Bank. Viet Nam ranks in in the upper half, though only at position 108 of 189.
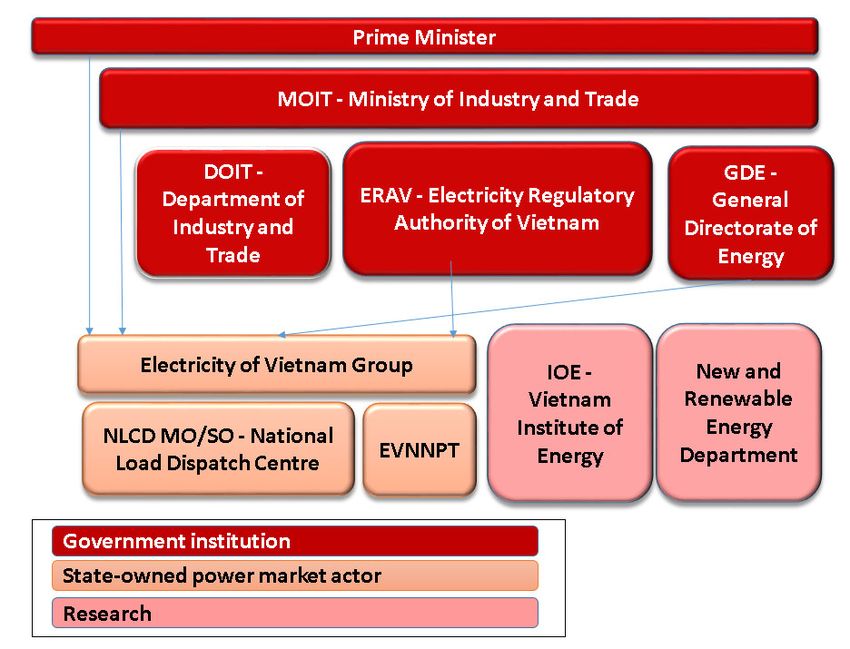
Regarding its institutional set-up Viet Nam has introduced a competitive generation power market with build–
operate–transfer projects and independent power producers. In 2014 Viet Nam was still dominated by Energy of
Viet Nam (EVN) producing 43 % of electricity itself. Petro Viet Nam (PVN) is the second largest power company
owning 13 % of production capacity. The power production market is opening up and in 2014 22 % of power
generation capacity was owned by independent power providers. So far only the public utility EVN is permitted to
deliver to consumers directly. There is no legislation in place clarifying how consumers themselves can easily
engage in energy provision, e.g. with self-consumption facilities, and how to feed access-energy into the grid.
Energy subsidies in Viet Nam reduce electricity prices under the level of generation costs.
Electricity prices are capped and mostly only increased in accordance with inflation. The IEA estimated overall
energy subsidies in 2010 at 2.69 bn USD, equivalent to 2.83 % of GDP in the same year. The average residential
tariff was set to be 1,622 VND/kWh (~ 0.07 USD/kWh or~0.07 Euro/kWh). UNDP (2012) considered average
electricity price to need to rise to 8-9 USD ct/kWh to allow the sector to operate on a sustainable financial basis.
Electricity subsidies are disincentives for energy savings by consumers and a barrier for possible business cases of
renewable energies because they cannot compete in the final consumer market.
The PDP VII 2011 states that it wished to implement electricity prices according to market mechanisms and the
VGGS 2012 announced a roadmap to phase out subsidies for fossil fuels. Policy makers have recognized the
problems related to energy subsidies but have not reacted accordingly.
The overall set-up of the electricity sector for a development of the renewable energy outside of EVN remains
difficult.
Table 7 shows the results of the indicator rating for dimension III.
21Energy Transition Readiness of Viet Nam Table 7: Dimension III: Summary of indicator ratings for electricity sector set-up Indicators of dimension III – electricity sector set-up –climate Rating(1) change policy 1) Grid electricity emission factor Yes 2) Transmission losses No 3) “Getting electricity” rank Yes 4) Electricity Market Structure No , No , Yes 5) Energy subsidies No , Yes , No (1)multiple rating occur if the indicator includes multiple questions Source: own table Table 8 presents the results to the questions formulated for dimension III including explanatory text. Figures, sources and calculations are listed in the annex. 22
Situation Analysis of the Vietnamese Electricity Sector

Table 8: Questions and results of dimension III – Electricity sector set-up

Indicator                Lead question                             Rating Explanatory note

1)   Grid electricity    Is the grid electricity emission factor   Yes      For 2011-2012 the grid electricity emission factor for average operating power plants in Viet Nam was 0.636
     emission factor     below Asia’s average gird electricity              tCO2/MWh.
                         factor of 990 tCO2/MWh?

2)   Transmission        Are transmission losses below global      No       Transmission and distribution losses in 2014 were 9 % which is slightly below other lower middle countries
     losses              average of 8.1 % (2011)?                           but still 3 % points above OECD levels

3)   “Getting            Is Viet Nam’s “getting electricity        Yes      “Getting electricity” tracks the procedures, time and cost required for a business to obtain a permanent
     electricity” rank   rank” in the upper half?                           electricity connection for a newly constructed warehouse and measures the reliability of power supply and
                                                                            transparency of tariffs and the price of electricity. Viet Nam is ranked 108 of 189 countries.

4)   Electricity         Is the electricity market open to new     ________Viet Nam has introduced a competitive generation power market with build–operate–transfer projects and
     market structure    market actors?                            _____ independent power producers. In 2014, Viet Nam was still dominated by EVN producing 43 % of electricity
                                                                           itself. PVN is the second largest power company, owning 13 % of production capacity. In 2014, independent
                         For distribution?                         No
                                                                           power producers owned 22 % of the power generation capacity (14 % owned by locals and 8 % by foreigners).
                         For final consumers?                      No
                         For power production?                     Yes

5)    Energy             Do electricity prices reflect             No       Electricity prices are capped and mostly only increased in accordance with inflation. Energy subsidies in 2010
     subsidies           production costs fully?                            was estimated at 2.69 bn USD, equivalent to 2.83 % of GDP in the same year. Average electricity price is
                                                                            considered to need to rise to 8-9 USD ct/kWh to allow the sector to operate on a sustainable financial basis.

                         Is there a commitment to reduce           Yes      The PDP VII 2011 states that it wished to implement electricity prices according to the market mechanism.
                         electricity subsidies                              Similarly, the 2011 NCCS announced the establishment of an appropriate energy pricing system that reflect
                                                                            marginal costs by 2015. The VGGS 2012 announces a roadmap to phase out subsidies for fossil fuels. Until
                                                                            2015 electricity price adjustment to market prices had not occurred.

                         Is there an action plan to reduce         No       So far the announced roadmap has not been passed.
                         electricity price subsidies?

NCCS-National Climate Change Strategy, PDP VII – Power Development Plan VII, VGGS- Vietnamese Green Growth Strategy
Source: own table

                                                                                                                                                                                             23
Sie können auch lesen