ALEXANDER VOGEL SIMULATION OF THE SKYCAB CONCEPT - ENERGY USAGE OF PERSONAL RAPID TRANSIT SYSTEMS - DIVA
←
→
Transkription von Seiteninhalten
Wenn Ihr Browser die Seite nicht korrekt rendert, bitte, lesen Sie den Inhalt der Seite unten
Energy Usage of Personal Rapid Transit Systems
      Annual Report 2011
                      Simulation of the SkyCab Concept
chool of Engineering Sciences
                     Master of Science Thesis
                                                        by
                                                                                                   Platzhalterfl
                                                    cand. ing.

                                           Alexander Vogel

                         Prof. Mats Berg                           Prof. Eckehard Schnieder
                                                                  Dipl. Ing. Tamás Kurczveil

                                              TRITA-AVE 2015:11
                                                ISSN 1651-7660
                                                 IVA Nr. 1433
                                                                     Bioingenieur
                                                                     Strukturierte
                                                 Matr. 4349156

                                                   March 2015

                                                                     Bachelor und Master of
                                                                     Workshop-Programm
           KTH Royal Institute of Technology                 Technische Universität Braunschweig
           Department of Aeronautical and
           Vehicle Engineering: Division of Rail Vehicles
                                                                     Wintersemester 2014/15
                                                             Institut für Verkehrssicherheit und
                                                             Automatisierungstechnik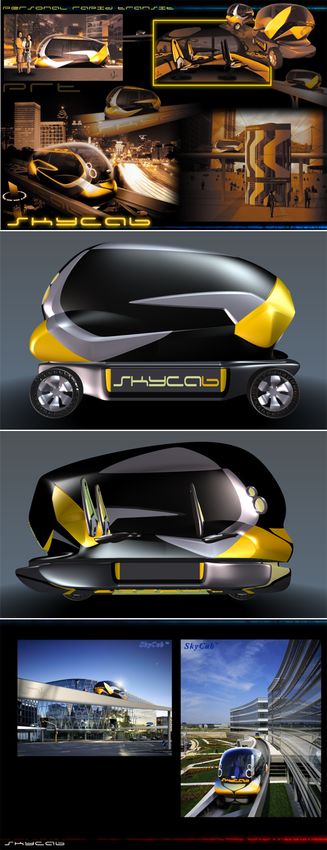
Sammanfattning

Den globala situationen för person- och godstransporter visar att energianvändningen
inom transportsektorn stadigt ökar och prognoser tyder på att den kommer att fördubblas
till 2050. Den största ökningen förväntas ske i Asien där, Kina kommer att stå för över
12 % av den globala energianvändningen år 2050. Inom EU, Europeiska Unionen, stod
personbilarna 2012 för över 81 % av passagerartransporterna räknat i antal passager-
arkilometrar. Nya energieffektiva och miljövänliga transportlösningar behöver utvecklas.
     En lösning med spårtaxi kombinerar fördelarna med konventionella vägtransportsys-
tem (flexibilitet, tillgänglighet och attraktivitet) och spårtransportsystem (säkerhet, ka-
pacitet och miljövänlighet). I detta examensarbete undersöks energianvändningen för
spårtaxi. Detta sker i form av en fallstudie. Spårtaxi är en automatiserad transporttjänst
för direktresor utan väntetider (likt taxiservice) i ett nätverk med banor som kompletterar
masstransportsystem. Fokus i studien ligger på att utvärdera fordonens energianvändning
i drift. Målet är att identifiera relevanta parametrar som avgör energianvändningen samt
deras bidrag till denna. Frågan om effektiv energianvändning besvaras med hjälp av en
simuleringsmodell. Denna baseras på konceptet SkyCab och en bedömning av fordonets
parametrar. En beräkning är utförd som utgör en referens för att sedan jämföras med
16 variationer av nyckelparametrar. Relationen till växhusgaser undersöks och utsläppen
beräknas för olika elektricitetsblandningar.
     Ett andragradspolynom är framtaget för att beskriva fordonets gångmotstånd som
inkluderar uppskattningar av vagnens rullmotstånd för små, pneumatiska däck på en
raksträcka samt i doserade kurvor. Hjälpkraftens energianvändning uppskattas säsom
motsvarande en liten elektrisk bil och är starkt beroende av passagerarnas komfortbehov
och yttre (väder)förhållanden.
     Ett resultat är att rullmotståndet står för cirka 44 % av energianvändningen och
hjälpkraften för 33 %. Båda är potentiella mål för effektivitetsförbättringar. Ändringar
av accelerationsnivåer har liten betydelse för energianvändningen då det är en mindre
del av energin som regenereras. En ökning av topphastigheten är ett effektivt sätt att
minska restiden med förhållanderis liten ökning av energianvändningen. Förslag lämnas
i studien hur man kan minska energianvändningen genom att förbättra fordonets och
banans nyckelegenskaper.

    Keywords: Energianvändning, spårtaxi, fordon, bana, simulering, parametervari-
ation, elektrisk framdrivning, förarlös, nätverk

                                             I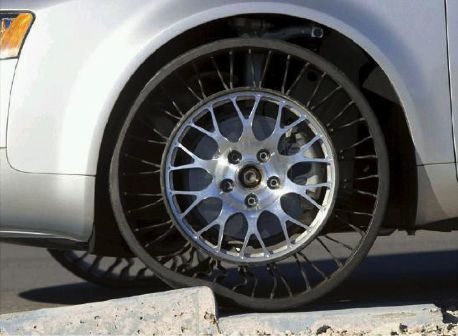
II
Abstract

The global situation of personal and freight transport shows that the energy demand for
transportation steadily increases, and prognoses indicate that the energy usage will double
until 2050. The largest growth rates are expected in Asia, and China in particular will
account for over 12 % of global transport energy usage in 2050. Over 81 % of passenger
transport in passenger kilometre was produced by passenger cars in 2012 in the European
Union, and new energy efficient and environmental friendly solutions have to be developed.
    PRT (Personal Rapid Transit) systems combine the benefits of traditional road systems
(flexibility, accessibility, attractiveness) and rail systems (safety, capacity, environmental
friendliness). This MSc thesis investigates a concept by SkyCab AB as a case study,
which offers an automated, non-stop and on-demand transportation service in a dedicated
network and is supposed to fill a gap between personal cars and public transport. The
focus is put on the energy usage of the vehicles in the operational phase.
    The objective is to identify the relevant parameters that determine the energy usage
and their contributions. This request is addressed by setting up a simulation model, based
on the SkyCab concept and estimations of vehicle parameters. A reference calculation and
16 variations of key parameters are conducted. The relation to greenhouse gas emissions
is investigated and emissions are calculated for different electricity mixes.
    A second-order polynomial of running resistance for the vehicle is determined, includ-
ing estimations of rolling resistance of small pneumatic tyres on straight track and in
superelevated curves. The auxiliary power is estimated for the SkyCab vehicle on basis
of a small electric passenger car.
    For the reference case the energy for rolling resistance is approx. 44 % of the energy
usage, and auxiliary energy contributes by 33 %. Both offer potential for efficiency im-
provement. The auxiliary power is strongly dependent on the passengers’ comfort needs
and the ambient conditions. Changes of acceleration rates have low impact on the energy
usage, since a smaller proportion of energy is regenerated. An increase in top speed is
a sufficient measure to reduce trip time with comparably low increase in energy usage.
Finally, suggestions are proposed to reduce the energy usage by improving key properties
of the vehicle and guideway.

Keywords: Energy usage, Personal Rapid Transit, tracked taxi, vehicle, guideway, sim-
ulation, parameter variation, electric propulsion, autonomous, network

                                             III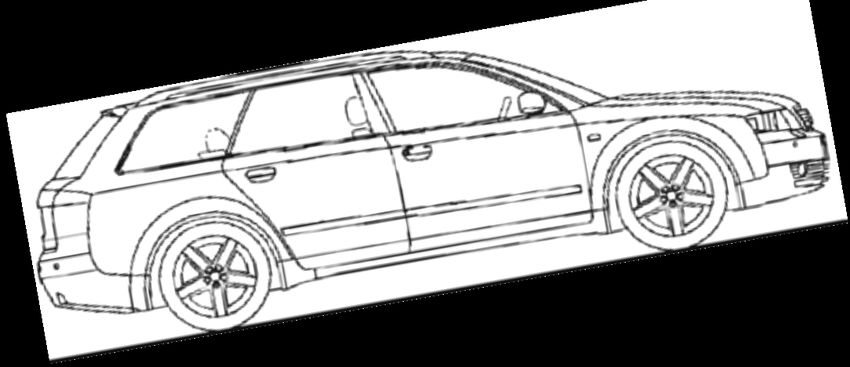
IV
Zusammenfassung

Der weltweite Energiebedarf des Personen- und Gütertransports zeigt einen kontinuier-
lichen Anstieg, und der Ausblick bis 2050 zeigt eine Verdopplung des gesamten Ener-
giebedarfs. Die größten Zuwachsraten werden in Asien erwartet, und insbesondere China
allein wird in 2050 über 12 % des weltweiten Energiebedarfs verzeichnen. Über 81 % aller
Personenkilometer in der Europäischen Union in 2012 wurden mit dem persönlichen Auto-
mobil durchgeführt, und ein Bedarf für energieeffiziente und umweltfreundliche Transport-
möglichkeiten wird deutlich.
PRT (Personal Rapid Transit) Systeme vereinen die Vorzüge von traditionellen straßenge-
bundenen Transportsystemen (Flexibilität, Zugänglichkeit, Attraktivität) und Schien-
ensystemen (Sicherheit, Kapazität, Umweltfreundlichkeit). Diese MSc Thesis untersucht
das Transportkonzept von SkyCab AB als Fallstudie. Es bietet einen automatisierten, un-
unterbrochenen und bedarfsgesteuerten Transportdienst auf einem exklusiven Netzwerk
und soll so die Lücke zwischen dem persönlichen Automobil und öffentlichen Transport-
mitteln schließen. Der Fokus wird dabei auf den Energieverbrauch des Fahrzeugs in der
operativen Phase gelegt.
Die Zielsetzung besteht in der Identifizierung und Quantifizierung der relevanten Para-
meter, die den Energieverbrauch bestimmen. Zu diesem Zweck wird ein Simulationsmodell
konfiguriert welches auf dem Konzept von SkyCab basiert und zusätzlich Abschätzungen
von Fahrzeugparametern enthält. Eine Referenzberechnung und 16 Parametervariationen
werden durchgeführt. Der Bezug zur Emission von Treibhausgasen wird für verschiedene
Energiemixe hergestellt.
Das Polynom zweiter Ordnung für den Fahrwiderstand wird aufgestellt, wobei Abschätzun-
gen bezüglich des Rollwiderstands kleiner pneumatischer Reifen auf gerader Strecke und
in überhöhten Kurven berücksichtigt werden. Die Zusatzleistung für das Konzeptfahrzeug
wird auf Basis eines kleinen rein elektrischen Fahrzeugs abgeschätzt.
Der Energieverbrauch in der Referenzsimulation für den Rollwiderstand beträgt ca. 44
% des Gesamtenergieverbrauchs, und die Zusatzenergie beläuft sich auf ca. 33 %. Beide
Anteile bieten Potential zur Optimierung, und die Zusatzenergie ist stark abhängig von
den Komfortbedürfnissen der Passagiere und den Umgebungsbedingungen. Variationen
der Beschleunigungs- und Bremsraten haben einen geringen Einfluss auf den Energiever-
brauch, da gleichzeitig ein kleinerer Anteil regeneriert wird. Eine Zunahme der Höchst-
geschwindigkeit wirkt sich durch mehr regenerierte Energie vergleichsweise gering auf den
bezogenen Energieverbrauch aus, reduziert jedoch die Fahrzeit merklich. Abschließend
werden Potentiale von Schlüsselparametern zur Reduktion des Energieverbrauchs des
Fahrzeugs und der Fahrbahn aufgedeckt.

Keywords: Energieverbrauch, Personal Rapid Transit, Fahrzeug, Simulation, Para-
meter, Variation, autonom, elektrischer Antrieb, Netzwerk

                                           V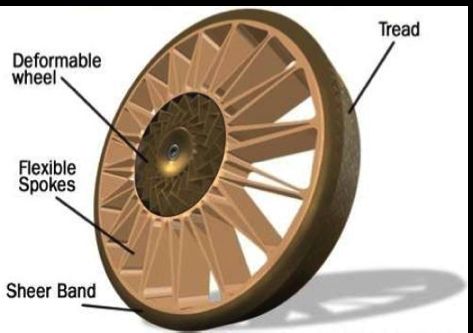
VI
Preface

This MSc thesis is the final part of my studies on Mechanical Engineering. It was carried
out at the Department of Aeronautical and Vehicle Engineering in the Division of Rail
Vehicles at KTH Royal Institute of Technology in Stockholm. The supervision in Germany
was provided by the Institute for Traffic Safety and Automation Engineering (IVA) at
Technische Universität Braunschweig.
I would like to thank my supervisor at KTH, Mats Berg, for giving me the opportunity
and for his support and constructive criticism throughout all phases of this thesis. In the
same way I would like to thank my supervisors Eckehard Schnieder and Tamás Kurczveil
at IVA for their guidance and their trust in me. I am thankful for the proposition of the
thesis by Åke Åredal from SkyCab AB and his encouragement and interest in my work.
I am very grateful for the help of Sebastian Stichel at KTH, who established the contact
to Mats Berg and was my first contact person in Stockholm. I would like to thank Jenny
Jerrelind from KTH Vehicle Dynamics for support in the first part of the thesis.
I would also like to thank Johan Öberg from MiW Rail Technology AB for his great
support during the simulation and his help when I needed it. Finally, I would like to
thank my family and friends, for their continuous support and encouragement throughout
my studies and this thesis.

March 2015

Alexander Vogel

                                           VII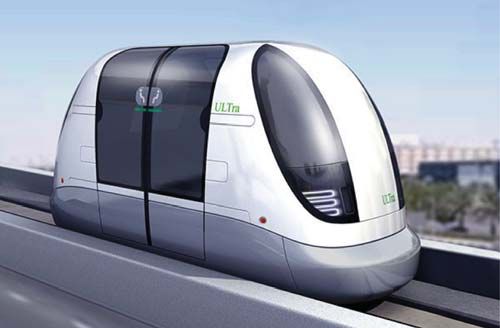
I declare that I have authored this thesis with the title "Energy Usage of Personal Rapid
Transit Systems" independently, that I have not used other than the declared resources,
and that I have explicitly marked all material which has been quoted either literally or
by content from the used sources.

    Alexander Vogel                                          Place, date

                                          VIII
Contents
List of Symbols XI
List of Figures XIII
List of Tables XV
Abbreviations XVII
1 Introduction 1
1.1 A new personal transport concept . . . . . . . . . . . . . . . . . . . . . . . 1
1.2 Definition of PRT systems . . . . . . . . . . . . . . . . . . . . . . . . . . . 3
1.3 Energy usage in PRT systems . . . . . . . . . . . . . . . . . . . . . . . . . 6
1.3.1 System energy architecture . . . . . . . . . . . . . . . . . . . . . . . 7
1.3.2 Life cycle phases . . . . . . . . . . . . . . . . . . . . . . . . . . . . 8
1.3.3 The vehicle in the operational phase . . . . . . . . . . . . . . . . . 8
1.4 Problem formulation . . . . . . . . . . . . . . . . . . . . . . . . . . . . . . 10
2 Energy usage of urban transport systems 11
2.1 Specific energy usage . . . . . . . . . . . . . . . . . . . . . . . . . . . . . . 11
2.2 Comparison of urban transport modes . . . . . . . . . . . . . . . . . . . . 13
2.3 Influence of occupancy rate . . . . . . . . . . . . . . . . . . . . . . . . . . 15
3 Background: Resistance forces 17
3.1 Rolling resistance . . . . . . . . . . . . . . . . . . . . . . . . . . . . . . . . 18
3.1.1 Straight track . . . . . . . . . . . . . . . . . . . . . . . . . . . . . . 18
3.1.2 Flat curves . . . . . . . . . . . . . . . . . . . . . . . . . . . . . . . 19
3.1.3 Superelevated curves . . . . . . . . . . . . . . . . . . . . . . . . . . 20
3.2 Aerodynamic resistance . . . . . . . . . . . . . . . . . . . . . . . . . . . . . 22
3.3 Acceleration resistance . . . . . . . . . . . . . . . . . . . . . . . . . . . . . 22
3.4 Gradient resistance . . . . . . . . . . . . . . . . . . . . . . . . . . . . . . . 23
4 System description 25
4.1 Technical description of the SkyCab system . . . . . . . . . . . . . . . . . 26
4.2 Track layout and speed profile . . . . . . . . . . . . . . . . . . . . . . . . . 28
4.3 Running resistance diagram . . . . . . . . . . . . . . . . . . . . . . . . . . 30
4.4 Operational conditions and auxiliary power . . . . . . . . . . . . . . . . . . 35
5 Simulation of energy usage 39
5.1 Simulation software . . . . . . . . . . . . . . . . . . . . . . . . . . . . . . . 39
5.2 Reference simulation and parameter study . . . . . . . . . . . . . . . . . . 42
IX5.3 Results of reference simulation and its variations . . . . . . . . . . . . . . . 43
5.4 Discussion of results . . . . . . . . . . . . . . . . . . . . . . . . . . . . . . 50
5.5 Greenhouse gas emissions for different electricity mixes . . . . . . . . . . . 53
6 Improving energy efficiency 55
6.1 Reduction of rolling resistance . . . . . . . . . . . . . . . . . . . . . . . . . 55
6.1.1 Pavement and guideway . . . . . . . . . . . . . . . . . . . . . . . . 55
6.1.2 Tyre . . . . . . . . . . . . . . . . . . . . . . . . . . . . . . . . . . . 56
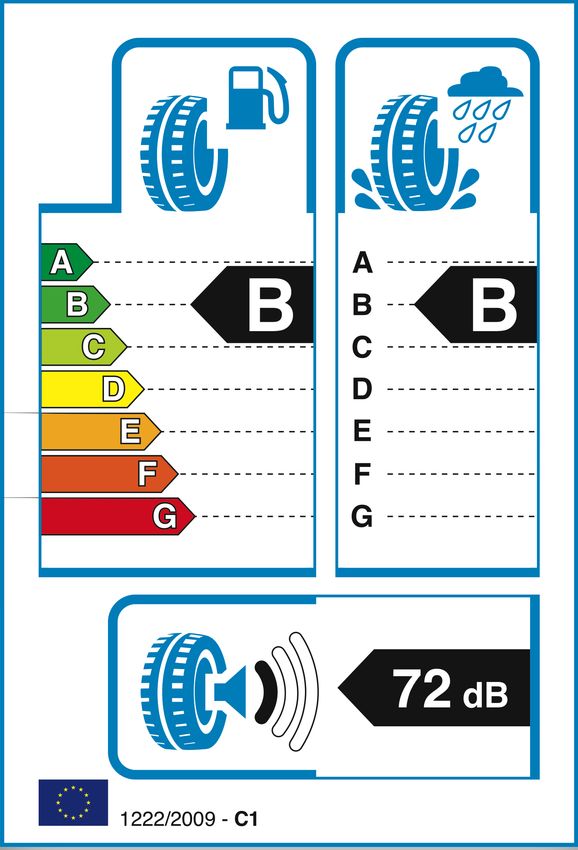
6.1.3 Examples of energy efficient tyres . . . . . . . . . . . . . . . . . . . 58
6.2 Reduction of auxiliary power . . . . . . . . . . . . . . . . . . . . . . . . . . 60
6.3 Reduction of aerodynamic resistance . . . . . . . . . . . . . . . . . . . . . 60
6.4 Drive train efficiencies and other factors . . . . . . . . . . . . . . . . . . . 61
7 Conclusions and future work 63
Bibliography 65
Appendices:
A Data for energy usage of urban transport modes 72
B Occupancy rate and energy usage per passenger kilometre 73
C Estimations of proportion of curves 74
D Vehicle validation with coefficients from coast down tests 75
E Auxiliary power as function of temperature 76
F Monthly temperatures for investigated cities 77
G Simulation parameters and results 78
XList of Symbols
Latin Letters
A [m2 ] Cross-sectional area of vehicle
a [m/s2 ] Acceleration
b [m] Width of vehicle
C [N/rad] Cornering stiffness
c [1] Coefficient
dx [m] Track segment
E [kWh] Energy
F [N] Force
f [1] Rolling resistance coefficient
g [m/s2 ] Gravitational acceleration constant
h [m] Height of vehicle
i [1] Gear ratio
J [kg m2 ] Mass moment of inertia
l [m] Vehicle wheelbase
m [1] Mass
n [1] Number of seats
P [W] Power
p [bar] Pressure
R [m] Curve radius
r [m] Wheel radius
s [km] Track length
T [◦ C] Temperature
t [t] Time
v [m/s] Speed
Greek Letters
α [deg] Superelevation angle of curve
γ [deg] Gradient
β [deg] Slip angle
η [%] Efficiency
XIκ [1] Relative mass factor
µ [1] Adhesion coefficient
ρ [kg/m3 ] Air density
Indices
0 Basic
1 First coefficient
2 Second coefficient
3 Third coefficient
acc Acceleration
aux Auxiliary
c Centrifugal
ct Curved track
D Air drag
e Equivalent
f Front
G Weight force
gr Gradient
gross Gross
l Lateral
max Maximum
N Normal to surface
net Net
occ Occupancy
R Rolling resistance
r Rear
regen Regeneration
rr Running resistance
s Speed dependency
st Straight track
sup Superelevated
t Tyre
total Sum over all
trac Traction
w (Head)wind
XIIList of Figures
1.1 Increase of transport energy demand . . . . . . . . . . . . . . . . . . . . . 2
1.2 Energy usage by sectors in the European Union in the operational phase . 2
1.3 A typical PRT network . . . . . . . . . . . . . . . . . . . . . . . . . . . . . 5
1.4 Off-track station design . . . . . . . . . . . . . . . . . . . . . . . . . . . . . 5
1.5 Various PRT vehicles . . . . . . . . . . . . . . . . . . . . . . . . . . . . . . 6
1.6 Energy flow for a PRT system . . . . . . . . . . . . . . . . . . . . . . . . . 6
1.7 Energy distribution for a PRT system . . . . . . . . . . . . . . . . . . . . . 7
1.8 Energy composition of a full life cycle for the Vectus PRT system in Suncheon,
South Korea . . . . . . . . . . . . . . . . . . . . . . . . . . . . . . . . . . . 7
1.9 Energy usage over the life cycle phases of the Vectus PRT system in
Suncheon, South Korea . . . . . . . . . . . . . . . . . . . . . . . . . . . . . 8
1.10 Energy architecture of the vehicle from grid to the wheels . . . . . . . . . . 9
2.1 Occupancy rates for metro and bus by daytime . . . . . . . . . . . . . . . 13
2.2 Energy usage in kWh/seat-km for for various urban transport modes . . . 15
2.3 Energy usage in kWh/pkm for various transport modes . . . . . . . . . . . 16
3.1 Resistance forces acting on a vehicle . . . . . . . . . . . . . . . . . . . . . . 17
3.2 Rolling resistance coefficients for the Stuttgart model . . . . . . . . . . . . 19
3.3 Forces and accelerations in superelevated curves . . . . . . . . . . . . . . . 21
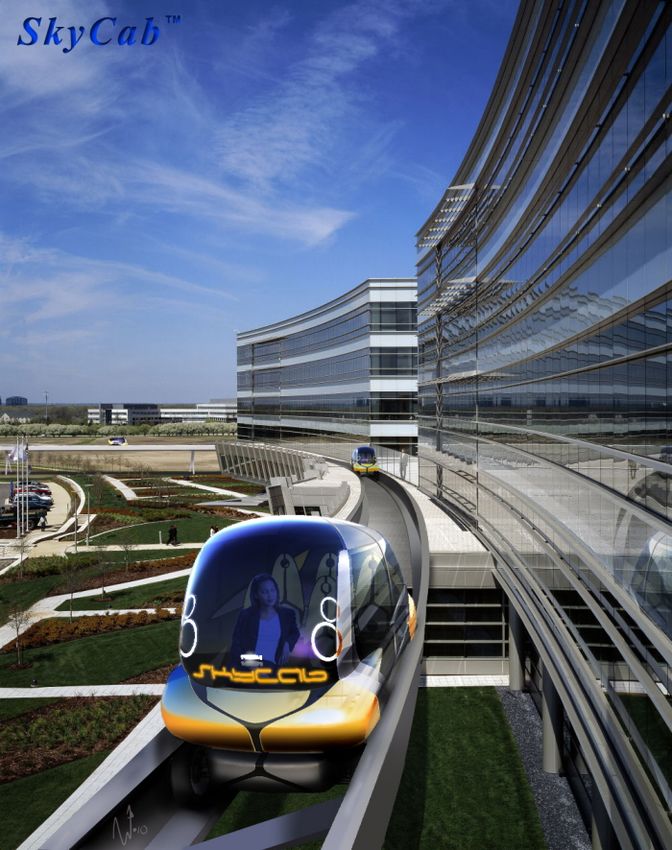
4.1 Concept pictures of the SkyCab vehicle . . . . . . . . . . . . . . . . . . . . 25
4.2 Vehicle layouts for the SkyCab concept . . . . . . . . . . . . . . . . . . . . 26
4.3 Tractive force at wheels as function of vehicle speed . . . . . . . . . . . . . 28
4.4 Track layout of the enlarged Arlanda region . . . . . . . . . . . . . . . . . 29
4.5 Methodology to determine average rolling resistance including curves and
superelevation for the SkyCab vehicle . . . . . . . . . . . . . . . . . . . . . 30
4.6 Air drag coefficients comparison . . . . . . . . . . . . . . . . . . . . . . . . 33
4.7 Running resistance curve for SkyCab . . . . . . . . . . . . . . . . . . . . . 34
4.8 Friction coefficient µ on different surfaces and conditions . . . . . . . . . . 35
4.9 Tyre temperature and related tyre resistance . . . . . . . . . . . . . . . . . 36
4.10 Auxiliary power over temperatures and monthly temperatures . . . . . . . 37
5.1 Calculation process of STEC . . . . . . . . . . . . . . . . . . . . . . . . . . 40
5.2 Sankey diagram of the energy split for the reference calculation . . . . . . 41
5.3 Speeds and acceleration of the reference calculation . . . . . . . . . . . . . 44
5.4 Forces of the reference calculation . . . . . . . . . . . . . . . . . . . . . . . 45
5.5 Resistance force modelling close to zero velocity . . . . . . . . . . . . . . . 45
5.6 Powers and energies for the reference calculation . . . . . . . . . . . . . . . 46
5.7 Results of the reference calculation . . . . . . . . . . . . . . . . . . . . . . 47
XIII5.8 Results of the parameter variation . . . . . . . . . . . . . . . . . . . . . . . 48
5.9 Relative impact on energy usage of the parameter variation of the reference
calculation . . . . . . . . . . . . . . . . . . . . . . . . . . . . . . . . . . . . 49
5.10 Relative impact on regenerated energy of the parameter variation of the
reference calculation . . . . . . . . . . . . . . . . . . . . . . . . . . . . . . 49
5.11 Comparison of SkyCab to competitive PRT systems on the basis of kWh/seat-
km . . . . . . . . . . . . . . . . . . . . . . . . . . . . . . . . . . . . . . . . 52
5.12 Comparison of SkyCab to competitive PRT systems on the basis of kWh/pkm 53
6.1 Pavement surfaces and their impact on rolling resistance . . . . . . . . . . 56
6.2 Conflicting goals during tyre development . . . . . . . . . . . . . . . . . . 57
6.3 Influence of tyre diameter and shoulder temperature on the rolling resist-
ance coefficient . . . . . . . . . . . . . . . . . . . . . . . . . . . . . . . . . 58
6.4 EU tyre labels for electric vehicle tyres . . . . . . . . . . . . . . . . . . . . 59
6.5 Airless tyre "Tweel" by Michelin . . . . . . . . . . . . . . . . . . . . . . . . 59
6.6 Aerodynamic drag coefficient in relation to various front and rear design
combinations . . . . . . . . . . . . . . . . . . . . . . . . . . . . . . . . . . 61
Appendices:
D.1 Comparison of calculations and coast down tests for two sedan cars . . . . 75
E.1 Auxiliary power as function of temperature . . . . . . . . . . . . . . . . . . 76
G.1 Input and results of the simulations (part 1) . . . . . . . . . . . . . . . . . 78
G.2 Input and results of the simulations (part 2) . . . . . . . . . . . . . . . . . 79
XIVList of Tables
1.1 Conflicting goals for the energy efficiency of a vehicle . . . . . . . . . . . . 6
2.1 Technical data for three PRT systems . . . . . . . . . . . . . . . . . . . . . 14
4.1 Component efficiencies with references and combined overall efficiency . . . 28
4.2 Curve definition: Curve radii, design speed and superelevation angles . . . 29
4.3 Tyre data for reference tyre . . . . . . . . . . . . . . . . . . . . . . . . . . 31
4.4 Resistance forces and total running resistance of SkyCab vehicle . . . . . . 33
4.5 Auxiliary power of the SkyCab vehicle for considered cities . . . . . . . . . 38
5.1 Summary of reference vehicle variables for simulation . . . . . . . . . . . . 42
5.2 Input values to the simulation software . . . . . . . . . . . . . . . . . . . . 43
5.3 Varied parameters and their values for the simulation . . . . . . . . . . . . 43
5.4 Greenhouse gases in relation to produced electric energy for the Nordic
market . . . . . . . . . . . . . . . . . . . . . . . . . . . . . . . . . . . . . . 54
5.5 Greenhouse gases in relation to produced electric energy for green energy
sources . . . . . . . . . . . . . . . . . . . . . . . . . . . . . . . . . . . . . . 54
6.1 Detailed variations of cD and the related change in % . . . . . . . . . . . . 61
Appendices:
A.1 Data for energy usage of urban transport modes . . . . . . . . . . . . . . . 72
B.1 Occupancy rate and energy usage per passenger kilometre . . . . . . . . . 73
C.1 Estimations for proportion of curves . . . . . . . . . . . . . . . . . . . . . . 74
F.1 Monthly temperatures and year averages for Stockholm, Delhi and Beijing 77
XVXVI
Abbreviations

AC     Alternating Current

DC     Direct Current

EU     European Union

GRT    Group Rapid Transit

HVAC   Heating, Ventilation and Air Conditioning

ICT    Information and Communication Technologies

LCA    Life Cycle Assessment

PRT    Personal Rapid Transit

                                  XVII
XVIII
Chapter 1

Introduction

The following chapter will give an overview on the global situation of personal transport
and an outlook until 2050. A possible approach by a new transportation concept is
presented, and the basic system with its key features is described. The system boundary
of the transport concept that is to be investigated in this thesis is defined with respect
to the energy usage in different life cycle phases and subsystems. As a conclusion, the
present problem is formulated in questions towards the end of the chapter.

1.1      A new personal transport concept
A major feature of modern life is personal flexibility and freedom, especially when it comes
to personal travelling. People need transportation services to increase their geographical
area of living and to use resources of all kinds that are not only geographically surrounding
them [91].
    Personal transportation is the basis of everyday life and economic development and
will increase as economies grow [61]. For economic development, reliable, safe, secure,
efficient, and affordable transport services need to be available [91]. It has to be noted
that transportation affects and reacts to economic growth in the same way [91]. Additional
aspects of enhanced mobility are better access to schools and health services and a larger
variety of goods [91].
    A look at the global situation of transport shows that the energy demand for transport-
ation steadily increases [25]. The forecast by the World Business Council for Sustainable
Development (WBCSD) for global transport energy usage until 2050 by region (Figure
1.1) shows annual growth rates of 1.8 % (2000-2030) and 1.0 % (2000-2050), respectively
[91], where the total energy demand roughly doubles until 2050. International marine
bunkers in Figure 1.1 refer to the energy used for transport in international waters that
can not be associated with specific countries. The largest growth rates are expected in
Asia and China in particular. China will account for over 12 % of total global trans-
port energy usage in 2050. This indicates not only a dramatical increase in total energy
demand, but also a significant regional shift in transport energy usage from OECD coun-
tries in 2000 to developing countries in South and East Asia in 2050, leading to new
potential markets for energy efficient technology. The lowest growth rates are predicted
to be in the OECD countries, which may be explained by the already high standard of
technological development. The growth of energy usage in OECD Europe (i.e. Western
Europe) is comparatively low due to a slower population growth, high fuel taxes and
higher improvements in efficiency [61].

                                             1
Chapter 1. Introduction
Average Annual Growth Rates
2000-2030 2000-2050
Exajoules
PWh Total 1.8% 1.0%
200
55.56 Eastern Europe 2.1% 1.3%
Middle East 2.1% 1.2%
Africa 3.2% 1.8%
41.67
150
Former Soviet Union 2.7% 1.6%
India 3.6% 2.1%
Other Asia 3.0% 1.8%
27.78
100
Latin America 2.9% 1.7%
China 4.2% 2.4%
OECD Pacific 0.6% 0.4%
13.8950
OECD Europe 0.9% 0.4%
OECD North America 1.2% 0.6%
International Marine Bunkers 0.9% 0.5%
00
2000 2010 2020 2030 2040 2050
Figure 1.1: Increase of transport energy demand for passengers and goods by region
between 2000 and 2050. Units were modified for conformity by the following conversion: 3.6 EJ
= 1 PWh (adapted from [91]).
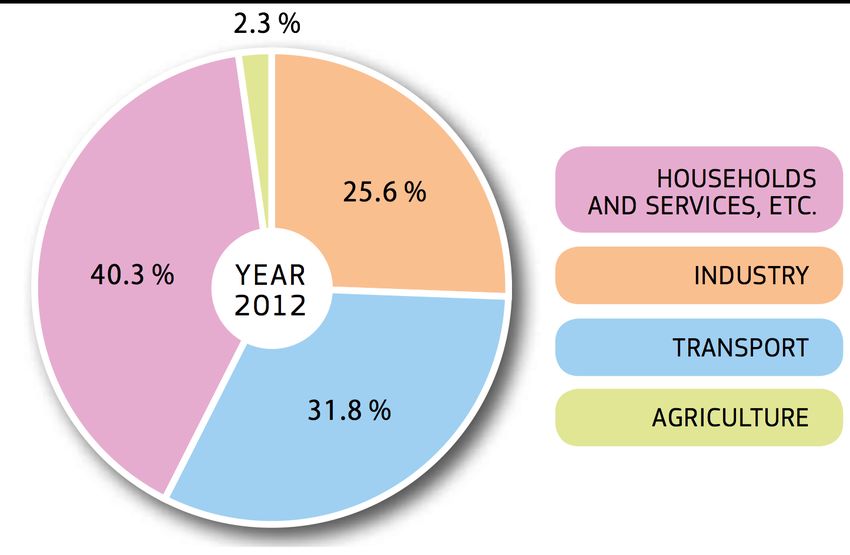
For the European Union (EU)1 , a split in sectors of energy usage can be made. The
final energy demand for passenger and goods transportation in the operational phase
makes up for 31.8 % of the total energy usage over all sectors in 2012 as can be seen in
Figure 1.2, which makes transportation the second largest consumer after households and
services and a sector being important to improve on.
PWh
13.956
12.793
11.630
10.467
9.304
8.141
6.978
5.815
4.652
3.489
2.326
1.163
0
1990
1991
1992
1993
1994
1995
1996
1997
1998
1999
2000
2001
2002
2003
2004
2005
2006
2007
2008
2009
2010
2011
2012
(a) Development of energy usage from 1990 (b) Detailed look at the year 2012
to the year 2012
Figure 1.2: Energy usage by sectors in the European Union in the operational phase (ad-
apted from [31]). Units have been modified for conformity from Mtoe (Mega tons oil equivalent)
to PWh by the following conversion factor: 100 Mtoe= 1.163 PWh
1
EU-28: This includes the 28 member states of the European Union since 1. July 2013, as referred to
in [31].
21.2. Definition of PRT systems
In addition to increasing demands for energy, costs will grow even more. Between 2005
and 2013, costs for fuel in the EU increased by 43.2 % [31]. This trend will continue,
as fossil fuels for worldwide transportation are limited and rely on petroleum by 95 %
[91, 61].
Most people do not use efficient public transport systems, but use their personal car
for everyday travelling. In the EU, 81.6 % of the passenger kilometres is produced by
passenger cars in 2012, whereas only 9.3 % of travelling people in the European Union
use public buses [31]. This large share of the personal car transport mode has led to
congestion, air pollution and slow flowing traffic [16].
This alarming picture drawn by the energy usage outlook requests a change in tech-
nology towards more efficient transport systems and new innovations for a sustainable
transportation concept. As mentioned before, personal cars contribute to the problem to
a large extent. A shift to public transport and the reduction of cars will not only lead to
less fuel usage and greenhouse gas emissions, but also to reduced noise, air pollution and
traffic congestion [40]. This mode shift is the first step to a reduction of energy usage,
but further measurements have to be taken to address the forecasted increase in energy
demand.
Improved efficiencies for vehicles and the overall transport systems, but also for the
travel itself are needed [12]. This is an important point, since significant amounts of energy
could be saved if vehicles need to stop fewer times and thus have less energy demanding
acceleration periods. Fossil fuels have to be saved, and transportation systems should
use less energy for the same or even increased transportation services. The European
Union is facing challenges from dependency on energy imports and the need for climate-
friendly energy sources. The directive 2012/27/EU by the European Union focuses on
the improvement on energy efficiency and addresses those challenges. The goal is to
reach a reduction of primary energy usage in total by 20 % until 2020 [30]. The United
States introduced a variety of policies to encourage developments towards higher energy
efficiency, including mandatory and voluntary standards [74].
One of the problems for new personal transit systems is the low acceptance of the
market for unknown systems that should complement existing and well proved modes
of transport. Companies tend to push their new technology to the market, but without
convinced customers this procedure is not very promising [55].
Another problem is the convenience, flexibility and value of a private car, to which
public transportation can hardly compete so far [16]. This means that in order to attract
people to travel with new public transport systems, they have to be offered the same
or even better comfort: short waiting times, on-demand travelling, non-stop travel and
travel with people of their choice [3].
1.2 Definition of PRT systems
To meet the requirements of a competitive transportation system, it has to combine
the benefits of existing modes of transport. A combination of traditional road systems
(flexibility, accessibility, attractiveness) and rail systems (safety, capacity, environmental
friendliness) should lead to a system that is accepted by the customer and environmental
friendly at the same time.
A Personal Rapid Transit (PRT) is only one of many intelligent mass transportation
concepts, among which are buses, vanpools, metros and trains [3]. The concept of PRT
was established in the 1960’s, when the first publication was made by Fichter [33]. Since
3Chapter 1. Introduction
then, more than 200 references on this topic were published as of 2005 [22]. There were
around 40 known PRT concepts until 2007, of which 19 were considered active [23]. The
typical attributes that determine a PRT system were defined by the Advanced Transit
Association (ATRA) and are listed in the following collection [75]:
• Fully automated vehicles (i.e., without human drivers)
• Vehicles captive to a guideway, which is reserved for the vehicle
• Small vehicles available for exclusive use by an individual or a small group travelling
together by choice. These vehicles can be available for service 24 hours a day, if
desired.
• Slender guideways that can be located above ground, at or near ground level, or
underground.
• Vehicles able to use all guideways and stations on a fully connected (a “coupled”)
PRT network.
• Direct origin to destination service, without a necessity to transfer or stop at inter-
mediate stations (i.e., “nonstop” service).
• Service available on demand rather than on fixed schedules.
A PRT system is predestined to act as a feeder system to public transport, for example at
airports, business parks and city centres [55]. Its aim is not to replace existing transport
systems, but to enhance their possibilities. It can be seen as a system in the niche between
rail and road transportation systems, which combines the benefits of flexibility similar to
a personal car and capacity and energy efficiency of trains.
A typical PRT system can be divided in three physical parts: guideway, stations and
vehicles. They are all necessary for the system’s functionality. The vehicles run autonom-
ously on their dedicated network and stop at stations to pick up and drop passengers.
Compared to a typical bus or metro corridor network, the PRT network is designed as
a mesh with a maximum walking distance for passengers of approximately 150 to 300 m
[83, 56]. A typical guideway network is shown in Figure 1.3, connecting city centres (red),
living areas (blue), work places (yellow) and leisure places (green).
Guideway The guideway provides the main infrastructure on which the vehicles oper-
ate. It can be on ground level, elevated or in tunnels and should have a low profile to
limit the visual impact in urban areas [27, 4]. Anderson [4] summarised the diverse design
criteria in his paper on "How to design a PRT guideway" in 2009. The main safety ad-
vantage of PRT systems comes from their dedicated guideways, which they do not share
with other modes of transport and therefore have no level crossing [78].
Stations The stations can be on ground level or elevated and can not be compared
to typical railway stations. They are much smaller and should be understood as on-off-
points [83]. There is no need for long stations as the vehicles are short and only carry 2-4
passengers. Due to high frequency of incoming and leaving vehicles the station times are
short compared to metro dwelling times.
The stations are designed to be off the main track to enable vehicles to bypass the
stations or wait in the queue [78]. Such a typical station design is shown in Figure 1.4,
41.2. Definition of PRT systems
Figure 1.3: A typical PRT network combining city centres (red), living areas (blue), work
places (yellow) and leisure places (green) in an urban environment
but many other station concepts are possible [36]. In addition, buffer places are provided
to reduce waiting times and secure vehicle availability [83].
buffer places
Buffertplatser På-
on-och
andavstigningsplatser
off-places
Figure 1.4: Off-track station design [83]
Vehicles The vehicles run fully automatic, usually either guided by sensors and markers
on the guideway or by a rail system. Although people may feel uncomfortable without
a driver, automatic personal transport is much safer than non-automated systems [16].
The overall traffic management is done by a control centre to optimize availability and
system performance. The vehicle size is usually similar to small personal cars. In the
case of SkyCab, which is the case study concept in this thesis, up to four passengers
can be carried in one vehicle [87], although this number differs significantly for different
concepts between 1 to 15 persons as found out by Cottrell and Mikosza [23]. The line
speeds differ in the same way, reaching from 20 km/h to 250 km/h [23]. It is obvious that
these concepts are very different in design and purpose and will suit different applications.
Figure 1.5 shows four vehicles that are currently operating, although the Vectus system
is special because it runs on rails as a guiding structure and can accommodate 6 instead
of 4 people. The Morgantown system by Boeing [11] offers even 8 seats, which denotes it
more to Group Rapid Transit (GRT) systems. It is one of the oldest systems and running
in Morgantown, West Virginia since 1975. All vehicles have an electric propulsion in
common and are running on special smooth guideways made of concrete or steel rails,
respectively.
5Chapter 1. Introduction
Figure 1.5: PRT vehicles from Ultra [23], Vectus [23], 2getthere [56] and Boeing [11]
PRT systems offer low top speeds in urban areas. However, they are able to operate at
high average speeds due to short dwelling times and skipped intermediate stops [3]. This
non-stop trip concept without transfers for the passengers enables high energy efficiency
compared to other means of transport [23].
The optimisation of a PRT system is a trade-off between conflicting goals. If one
attribute is modified to be more energy efficient, other properties of the system will likely
suffer. Some of the most challenging conflicting goals are listed in Table 1.1.
Table 1.1: Conflicting goals for the energy efficiency of a vehicle
Attributes Conflicting attributes
Rolling resistance Noise, traction, wet braking performance
Smaller tyres: rot. masses, visual impact Rolling resistance
Vehicle weight Travel distance per battery charge, crash safety
Air drag Space and capacity
Electric motor efficiency Heating/cooling for passenger cabin
1.3 Energy usage in PRT systems
During the operational phase, the PRT system can be divided in three parts. Those parts
are vehicles, infrastructure and Information and Communication Technologies (ICT).
They all use energy and have to work in combination in order to deliver the desired
transportation service (Figure 1.6). The energy flow is split between those three subsys-
tems and the share of energy usage may be significantly uneven. Due to the limited scope
of this thesis, it is necessary to find and focus on the most energy consuming subsystem.
Vehicle
Transportation
Energy input ICT
service
Infrastructure
Figure 1.6: Energy flow for a PRT system
61.3. Energy usage in PRT systems
1.3.1 System energy architecture
Most energy for operating a PRT system is used for propulsion of the vehicles [3]. In
addition to this, energy is necessary for heating or cooling the passenger cabin [40]. Both
needs can be assigned to the vehicle itself, and Figure 1.7 from a previous study shows the
distribution of energy usage for different purposes. The shares for propulsion and heating
are about 75 % of the total energy usage. To obtain a more detailed look on the energy
Figure 1.7: Energy distribution for a PRT system (adapted from [40])
composition of a PRT system, a full Life Cycle Assessment (LCA) has to be conducted.
There are LCAs on various transport modes available [50, 21, 24], but investigations
on PRT systems are rare. The most suitable reference is an LCA for the Vectus PRT
system that was built in Suncheon, South Korea in 2012. Although it is operating on
rail-like guiding structures in contrast to the SkyCab concept, it can be considered as a
comparative system if the battery powered variant is regarded. The result of this analysis
is shown in Figure 1.8, dividing the system in different subsystems. Most of the energy is
S. Korea, battery
0% 10% 20% 30% 40% 50% 60% 70% 80% 90% 100%
kWh
Track Stations Substations & power coll. Control & com. syst. Maintenance facility Vehicles
Figure 1.8: Energy composition of a full life cycle for the Vectus PRT system in Suncheon,
South Korea. In the displayed scenario, the vehicles run on batteries and therefore are most
similar to the SkyCab system (adapted from [27]).
used for the vehicles (approx. 60 %) and track (approx. 20 %), whereas the other parts
of the system share the last 20 %. Therefore this thesis focuses on the energy used by the
vehicle subsystem.
7Chapter 1. Introduction
1.3.2 Life cycle phases
The life cycle of a product can be divided in three phases of construction, operation and
end-life or recycling [46]. The LCA for the Vectus PRT system with respect to the life
cycle phases is summarized in Figure 1.9. The author set up a detailed model of all
energy consuming factors and calculated the composition [27]. To his advantage, he was
able to use some measurements as a basis for the calculations. Figure 1.9 indicates that
S. Korea, battery
0.00E+00 1.39E+08 2.77E+08 4.17E+08 5.56E+08
kWh
Construction Operation End-life
Figure 1.9: Energy usage over the life phases of the Vectus PRT system in Suncheon,
South Korea, with 20 years of assumed vehicle lifetime (adapted from [27])
most of the energy is used during the operational phase, roughly twice as much as for
construction, whereas the end-life phase uses very little energy in comparison. This leads
to the conclusion that the operational phase of the vehicle should be investigated in this
thesis.
Other references came to the same conclusion for PRT systems [3, 40]. For public
buses, personal cars and light rail, the use-phase is consuming most of the energy for the
product life time [21, 24].
1.3.3 The vehicle in the operational phase
The vehicle’s overall energy flow (Figure 1.10) can be described without specific knowledge
or assumption of the vehicle power train layout. Nevertheless, for different layouts, small
adoptions have to be made concerning the efficiency rates and the calculation of the
overall power train efficiency, respectively. The composition of system components will
find further consideration in Chapter 4, where the efficiencies and their references are
displayed as well.
The vehicle energy flow can be divided in two major groups, electrical and mechanical
components. The main layout is taken and extended from Fernández [32], who designed
the electrical drive system for a PRT system in his master thesis. For a better under-
standing, red arrows account for energy flow from the battery to the wheels and green
arrows for regeneration of energy while braking. Although the electrical grid is shown as
a component in the figure, it is not part of the present energy study. It has to be noted
that the charging process includes additional losses to those considered in the present
simulations.
Electrical components The electrical part of the vehicle consists of the battery, con-
troller/converter unit, motor, heating, ventilation and air conditioning systems and aux-
iliary systems with DC/DC converter. This DC/DC converter is necessary to step down
the battery voltage to 12 V or 24 V of the minor consumers.
81.3. Energy usage in PRT systems
HVAC systems
Propulsion Transmission
Controller Electric
Grid Battery /converter motor Gearbox Differential Wheels
DC/DC converter Auxiliary systems:
• Illumination
• Information/ communication
• Steering
System boundary
Electrical vehicle components Mechanical vehicle components
Figure 1.10: Energy architecture of the vehicle from the public electricity grid to the
wheels. The system can be divided in electrical and mechanical subsystems.
Controller/Converter The purpose of the controller unit is to convert the Direct Cur-
rent (DC) power of the battery to the desired Alternating Current (AC) voltage and
amplitude for the electrical motor for propulsion of the vehicle [32]. A converter is needed
to utilise regenerative braking at a maximum. This unit enables regenerative braking at
low speeds because it converts the voltage of the motor generated during braking to the
desired charging voltage of the battery [54].
Motor The vehicle is driven by one or more electrical motors, depending on the drive
train layout. For this purpose, a permanent magnet synchronous motor is used due to its
high degree of efficiency [32]. The input to the motor comes from the converter unit and
the motor converts this electrical energy to mechanical energy, which is then passed on
to the transmission.
Auxiliary systems These systems are not necessarily needed for propulsion, but in-
clude safety, steering and cooling systems of the vehicle which are needed for operation.
In addition, comfort systems for communication, information and illumination are sum-
marised in this group. The power demanding Heating, Ventilation and Air Condition-
ing (HVAC) components are wired to the high voltage side of the battery to reach a good
degree of efficiency without conversion losses [32]. It includes energy usage for ventila-
tion of the heated or cooled air in the passenger cabin and the overall energy usage will
significantly change with the climate conditions.
Mechanical components The mechanical part of the vehicle consists of the transmis-
sion and the wheels.
Transmission For an electrical vehicle, no clutch is needed between the motor and
the transmission as it can produce torque up from zero revolutions per minute [54]. Nev-
9Chapter 1. Introduction
ertheless, a single gear transmission is mandatory to convert the high rotating speed of
the motor (up to 10,000 rpm) to the desired wheel rotating speeds. This includes the
gears and the differential gearbox between the wheels (Figure 1.10).
Wheels The wheels are the final mechanical component of the drive train and transfer
traction, braking, vertical and steering forces to the vehicle [49]. The losses in the contact
area between tyre and guideway and due to tyre deflection are referred to as rolling losses
or rolling resistance (Section 3.1).
1.4 Problem formulation
The energy usage of individual vehicles, acting as taxis, has to be as low as possible to be
competitive to other means of transport and to reduce greenhouse gas (GHG) emissions.
The key questions concerning the energy usage of PRT systems are the following and will
be investigated in this thesis:
1. What parameters are relevant and which are affecting the energy usage of tracked
vehicles most?
2. How is the energy usage distributed among all factors (e.g. rolling resistance, air
resistance, propulsion efficiency, braking efficiency as well as auxiliary systems)?
3. How does the energy usage affect GHG emission?
4. How can the vehicle’s energy usage and GHG emissions be minimized so that the
energy and environmental benefits of the mobility aspect is clear? What can be
done to reduce the energy usage?
10Chapter 2
Energy usage of urban transport
systems
The energy demand for the transportation process of passengers and goods takes up
to 80 % of the total energy for transportation services, compared to energy usage for
infrastructure, vehicle production, fuel production and distribution [50]. Highest emissions
come from the operation phase [45, 8], and this is the phase that is presented in the
following figures and numbers [52]. Although it is important to improve transport service
efficiency and to attract passengers to a new transportation concept, it is important that
they are attracted from the less efficient transport modes such as cars and not from cycling
or walking [69]. For comparison of transport modes, the influencing parameters should
be held constant, but they are not always stated in detail in the available publications
on energy usage. This makes it necessary to be cautious while comparing numbers from
various papers, as numbers can differ significantly due to differences in estimations and
assumptions. The parameters on vehicle level that determine the energy usage of transport
systems will be examined in Chapter 5 when the energy simulation is conducted for the
SkyCab concept as a case study.
In this chapter, the units to measure specific energy usage are explained and the
influence of occupancy rate is made clear. Numbers for specific energy usage of various
urban transport modes are mainly taken from papers on transport energy usage by Potter
[69] and Blomberg [10], backed up with data from Kenworthy [52], Lowson [57] and
Anderson [3]. They refer to the use-phase and represent the energy that is actually
needed for operation of the vehicles.
2.1 Specific energy usage
Comparing various modes of transport with regard to their energy usage requires a com-
mon unit to express efficiency [57]. This is especially the case if energy is not only provided
as fossil fuels to cars and buses, but also in other forms such as electricity to rail systems
like trams and metros.
The efficiency of vehicles can be expressed in different ways. Most common for per-
sonal cars is the expression in litre per 100 km (l/100 km) in Europe or miles per gallon
(miles/gal) in the United States and United Kingdom1 . For a more general specification,
energy is measured in Watt hours, commonly in kWh. For comparison reasons, this energy
1
Please note the different conversion rates between litres and UK gallons and US gallons
11Chapter 2. Energy usage of urban transport systems
usage can be related to either the passenger kilometres travelled (kWh/pkm), to vehicle
kilometres travelled (kWh/vehicle-km or simply kWh/km) or to seat kilometres travelled
(kWh/seat-km).
The energy in kWh/vehicle-km is dependent on the operational conditions of the
vehicle, its size and the efficiency of its components. It is a result of internal and ex-
ternal factors and varies significantly by the type of vehicle. This measure is useful to
monitor the energy usage of a single vehicle over time or for judging the measures to
improve vehicle efficiency such as driver training or alternative fuels of personal cars [94].
Nevertheless, this number gives the same energy usage for a fully loaded or empty vehicle,
independent of the transportation service it delivers, which is not a number that can be
compared over various modes of transport.
The comparability can be assured by relating the energy usage to the offered seats per
vehicle kilometre (kWh/seat-km), giving a very general value with which the customer
can compare using his own numbers for occupancy rate.
When the specific energy usage is defined as kWh/pkm, it is depending on the oc-
cupancy rate cocc during transport services. This number indicates the ratio between
passengers travelling and offered seats in the vehicle, relation 2.1. The percentage can be
well over 100 %, especially for metros and trams, but also for buses due to standing pas-
sengers. Metro systems often have more people standing than sitting during peak times,
which can give an occupancy rate of more than 200 % [69].
#passengers
cocc = (2.1)
#seats
The following relation between kWh/pkm, kWh/seat-km and cocc can be defined.
kWh kWh
E · cocc = E (2.2)
pkm seat − km
The relation between kWh/pkm and kWh/seat-km by occupancy rate is linear, which
makes this value determinant for the energy usage. The difficulties in determining the
occupancy of public transport systems is obvious. Not only the people who enter a vehicle
have to be counted, but also those who leave the vehicle to calculate the actual occupancy
rate. In an urban environment, the occupancy rate is higher in central parts of the line
network compared to the outskirts. In addition, the occupancy rate changes with time of
the day and thus the energy efficiency changes in the same manor. For energy calculations,
an average value is usually used to represent a whole operational weekday (Figure 2.1).
The occupancy rates vary with respect to the used system, time, demography and even
culture [69] and can be seen as a value for vehicle capacity utilisation. The occupancy
rate has two peak times during the daytime of weekdays in public passenger transport
[10]. A higher utilisation in peak times reduces the specific energy demand, whereas it
increases in off peak times. The occupancy rate does not only change with daytime, but
also with purpose of travel [69]. This means that in typical off-peak times car occupancy
rates increase when people go for shopping or leisure trips, and public transportation
occupancy rates are declining in the same time slot. The high energy efficiencies of public
transport systems are mainly due to high occupancy rates and many offered seats, and
specific energy usage may increase dramatically in off-peak times [69].
Due to these uncertainties, a comparison of transport modes is made on the basis of
kWh/seat-km. When it comes to service measurements and energy for people transport-
ation itself, the numbers in kWh/pkm are most interesting from the energy point of view
122.2. Comparison of urban transport modes
45
06:00 to 09:00 35
45
09:00 to 15:00 30
55
15:00 to 18:00 35
35
18:00 to 21:00 25
20
21:00 to 06:00 15 Metro
40 Bus
Day average 28
0 10 20 30 40 50 60
Occupancy rate in %
Figure 2.1: Occupancy rate for metro and bus in Stockholm by daytime on an average
weekday [10].
for public transport systems [6] and enable a comparison of energy usage between various
transport modes. However, in this study, the focus is on vehicle energy efficiency, and
thus the energy usage is mainly compared in kWh/seat-km.
2.2 Comparison of urban transport modes
Relevant transport modes for comparison with PRT systems are buses, personal cars and
light rail systems like trams and metros. They operate in the same urban environment
and are direct competitors to personal rapid transit.
Numbers for the PRT systems are displayed in Appendix A including the references.
These systems were mentioned previously in Chapter 1 and include the Vectus PRT
system in Suncheon, South Korea, the Ultra PRT system running at Heathrow Airport
in the United Kingdom and the system of 2getthere running in Masdar city, United
Arab Emirates. Those three systems are fairly similar in size and have the same face
to face layout for passenger accommodation. Ultra and 2getthere have the guideway
and propulsion system with an electric motor in the vehicle in common, being driven with
power from an internal battery [1]. In contrast to this, Vectus uses linear induction motors
along the track and gets energy via current collectors, although battery powered vehicles
were considered in the design process [27]. A second difference in the guideway design is
the monorail for the Vectus system, which is different to the pavement layout of 2getthere
and Ultra. This includes a track that is captive of the vehicle, providing a secure and
safe ride. The vehicle tare weights are similar for 2getthere (1400 kg) and Vectus (1500
kg), but Ultra is significantly lighter with 850 kg. Vectus offers the maximum payload
of 1000 kg, which is nearly twice as much as the competitors [1]. Some of the technical
parameters are summarized in Table 2.1.
For comparison, data for buses, metros, trams and cars were taken on the basis of
kWh/seat-km. Figure 2.2 shows the chosen types of vehicles, and the data for this figure
is printed in the Appendix A together with the corresponding references. The data set
13Chapter 2. Energy usage of urban transport systems
Table 2.1: Technical data for three PRT systems [1]
Parameters 2getthere Ultra Vectus
Vehicle power principle battery battery current collector
Drive principle electric motor to electric motor to linear motor in
wheels wheels guideway
Vehicle support semi-solid rubber pneumatic tyres solid polymer tyres
tyres
Dimensions L×W×H 3920×1460×2010 3700×1470×1800 3736×2010×2500
mm mm mm
Passengers per vehicle 4 adults, 2 children 4 adults, 2 children 4 adults, 4 children/
6 adults
Weight (empty/full) 1400/2050 kg 850/1300 kg 1500/2500 kg
Max. speed 40 km/h 40 km/h 70 km/h
Acceleration/deceleration rates 0.8 m/s2 1.25 m/s2 1.2 m/s2
Emergency deceleration 4.7 m/s2 2.5 m/s2 5 m/s2
Max. range 60 km 20 km n.a.
Minimum track radius 5.5 m 5m 5m
Guideway design pavement pavement monorail
Energy usage for full vehicle 0.19 kWh/km 0.13 kWh/km 0.24 kWh/km
0.048 kWh/seat-km 0.033 kWh/seat-km 0.040 kWh/seat-km
Energy usage for empty vehicle 0.17 kWh/km 0.09 kWh/km 0.23 kWh/km
0.043 kWh/seat-km 0.023 kWh/seat-km 0.038 kWh/seat-km
for buses and metros comprises data from a survey by Blomberg [10] about public trans-
port systems in Stockholm and data from a survey by Potter [69] about UK transport
services. The numbers for cars are taken from the annual report of The Society of Motor
Manufacturers and Traders Limited in the United Kingdom, which refer to the energy
efficiency of new cars in the years 2003 and 2013 and had to be converted from imperial
miles per gallon to kWh/seat-km. As expected, the energy usage of light rail systems is
very low compared to other modes of transport. This is mainly due to high efficiencies
of electrical propulsion [52], low rolling resistance of steel wheels on rails and a scheduled
service on dedicated guideways without disturbances. Metro and tram systems offer many
seats compared to their energy usage, which improves the energy efficiency in terms of
kWh/seat-km.
When it comes to road traffic, the double-deck bus is one of the most efficient ways
to travel. It is as energy efficient as as the UK metro, although its numbers are from
2003. Unfortunately, no newer numbers were available. The development of personal cars
between 2003 and 2013 shows a 25 % decrease in specific energy usage. Nevertheless, the
world average car in 2011 uses twice the energy as the UK double-deck bus and the UK
metro. Compared to a single-deck bus, the double deck uses 25 % less energy per offered
seat kilometre, and the same energy as the UK metro.
The number for the Stockholm diesel bus is relatively high compared to the single-
deck bus in the UK. This can be explained with the fact that the bus was built in 1995,
although the data of energy usage was taken in 2005. Assuming the same development in
the bus sector as for private cars, the energy usage should be 25 % lower if the bus was
built 10 years later. The Stockholm metro is the most energy efficient rail system, but it
has to be noted that the data for the UK metro involves an older system than the other
vehicles that were investigated [69].
It can be seen that PRT vehicles are in the same low region in energy usage as rail
systems, having values between 0.033 and 0.048 kWh/seat-km and an average of 0.041
142.3. Influence of occupancy rate
0.131
0.127
0.122
0.14
0.093
0.12
0.081
kWh/seat-km
0.10
0.061
0.061
0.050
0.048
0.043
0.08
0.041
0.040
0.038
0.033
0.06 0.023
0.04
0.02
0.00
y)
em )
)
l)
T y)
)
(2 )
(2 )
es 11)
er (em o
do UK am
sin -de ro
ca dec us
W ca K us
ec T ( full
2g Sto PR pty
U full
3
3
ul
s
r
U 01
kh . c 00
tu PR pt
PR pt
bu
et RT et
t
ew gle k b
ew rs U k b
0
f
U ubl me
tr
(
(
(
V ltr (em
(2
m
el
PR T
T
c
K
K
ol ar
e lm
U T
di
-
th kho
e
PR
or rs
a
s
e
oc vg
m
2g P
tu
c
a
th
a
s
er
ltr
ld
V
K
ec
K
U
N
N
U
et
St
PRT Rail Bus Car
Figure 2.2: Energy usage in kWh/seat-km for various urban transport modes. The data is
displayed in Appendix A, including the references. The comparability of energy usage is limited
due to uncertainties in the related assumptions.
kWh/seat-km for full vehicles. The relation to the average car in the world in the year
2011 shows that PRT systems use less than 1/3 of the energy per seat-kilometre, and half
the energy of a single-deck bus.
2.3 Influence of occupancy rate
The relation introduced in Equation 2.2 indicates that the energy efficiency is strongly
dependent on the occupancy rate if it is measured in kWh/pkm. For the transport modes
that were introduced in Section 2.2, occupancy rates were determined from the same
surveys. They are averages for the specific transport modes and include peak and off-
peak times. The car occupancy rates, that were used for the PRT systems as well, are
based on estimates by Potter [69]. The energy usage per passenger-kilometre can be
obtained through Equation 2.2. The values are given in Appendix B together with the
corresponding references. The result is displayed in Figure 2.3, and values from full PRT
systems were taken as a basis.
The introduction of the occupancy rate and application to the various transport modes
can change the whole picture of transport efficiency. In general, it can be seen from
Figure 2.3 that the energy usage per passenger-kilometre decreases if the occupancy rate
is increased and vice versa.
Light rail transportation systems like metros and trams are considered to be envir-
onmental friendly and able to attract passengers from road traffic [16], providing high
capacity and safety for passengers. The specific energy usage in kWh/pkm is comparative
low due to high occupancy rates that can exceed 50 % in peak times (Figure 2.1). The
15Sie können auch lesen