Halbjahresbericht 2020 Interim Report 2020 - Cicor Group
←
→
Transkription von Seiteninhalten
Wenn Ihr Browser die Seite nicht korrekt rendert, bitte, lesen Sie den Inhalt der Seite unten
Halbjahresbericht 2020 Interim Report 2020
DIE PRODUKTIONSKAPAZITÄTEN STEHEN UNEIN-
GESCHRÄNKT ZUR VERFÜGUNG
Die Cicor Gruppe ist einer der führenden Elektronikhersteller in Europa.
Durch die herausragende technologische Kompetenz differenziert sich
das Unternehmen deutlich vom Wettbewerb. Das macht Cicor insbe-
sondere für Kunden aus den strategischen Zielmärkten Medizintechnik,
Industrieelektronik sowie Luft- und Raumfahrt zu einem gefragten Ent-
wicklungs- und Fertigungspartner.

Während der Coronavirus-Pandemie hat Cicor weitreichende Massnah-
men ergriffen, um die Gesundheit der Mitarbeitenden zu schützen, die
Risiken einer Betriebsunterbrechung zu minimieren und die Lieferfähig-
keit gegenüber den Kunden sicherzustellen. Die Massnahmen werden
laufend analysiert und der aktuellen Situation angepasst. Aktuell ste-
hen den Kunden die Produktionskapazitäten aller Cicor Werke uneinge-
schränkt zur Verfügung.

Mit ihren zehn Standorten in der Schweiz, Europa und Asien ist die
Cicor Gruppe im globalen Elektronikmarkt hervorragend positioniert.
So konnten während der Coronavirus-Pandemie namhafte Neukunden
gewonnen werden. Auch die Projektpipeline hat sich im ersten Halbjahr
2020 weiterhin erfreulich entwickelt. Das zeigt, dass Cicor auch in Zu-
kunft schneller als der Gesamtmarkt wachsen kann.

PRODUCTION CAPACITIES ARE AVAILABLE
WITHOUT ANY RESTRICTIONS
The Cicor Group is one of the leading electronics manufacturers in Eu-
rope. Its outstanding technological expertise differentiates the company
clearly from its competitors. This makes Cicor a highly valued develop-
ment and production partner, especially for customers in the strategic
target markets of medical technology, industrial electronics as well as
aerospace.

During the coronavirus pandemic, Cicor took comprehensive measures
to protect the health of its employees, to minimize the risk of business
interruption and to ensure its ability to deliver to customers. The meas-
ures are continuously analyzed and adapted to the current situation.
Currently, the production capacities of all Cicor sites are available to
customers without restrictions.

With its ten locations in Switzerland, Europe and Asia, the Cicor Group
is very well positioned in the global electronics market. During the coro-
navirus pandemic, Cicor was able to acquire well-known new customers.
The project pipeline also continued to develop well in the first half-year
of 2020. This shows that Cicor is able to continue to grow faster than
the market in the future.
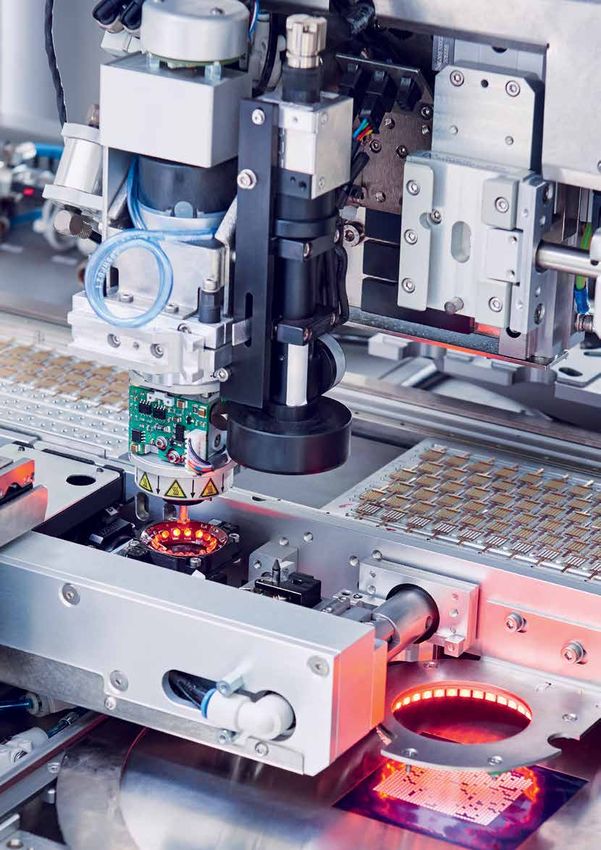
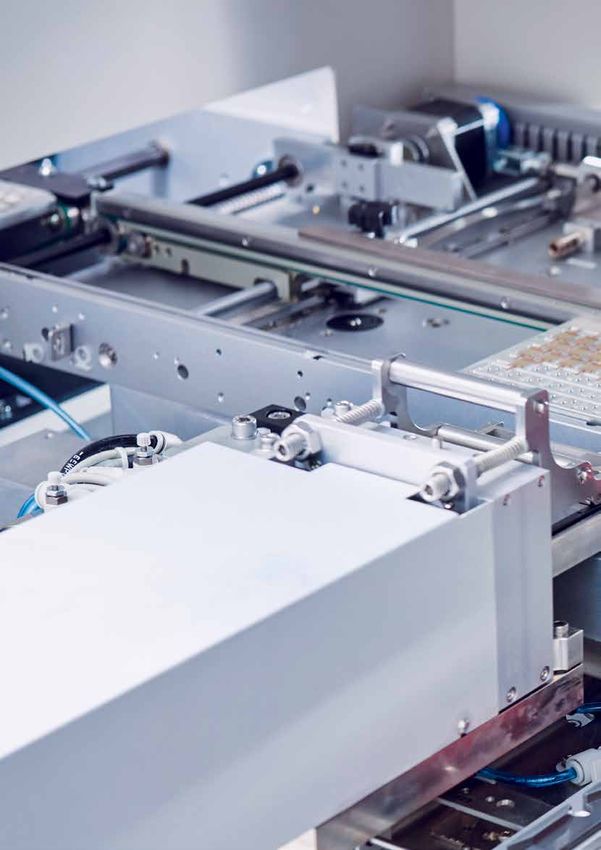
ÜBER UNS CICOR – IHR TECHNOLOGIEPARTNER Die Cicor Gruppe ist ein global tätiger Entwicklungs- und Fertigungspartner mit innovativen Technologielösungen in der Elektronikindustrie. Mit rund 1900 Mitarbeitenden an zehn Produktionsstandorten bietet Cicor hochkomplexe Lei- terplatten, Hybridschaltungen und gedruckte Elektronik sowie umfassende Electronic Manufacturing Services (EMS) inklusive Mikroelektronikbestückung und Kunststoff-Spritzguss. Cicor liefert massgeschneiderte Produkte und Dienstleistungen vom Design bis zum fertigen Produkt aus einer Hand. Die Aktien der Cicor Technologies Ltd. werden an der SIX Swiss E xchange gehandelt (CICN). Kontakt Cicor Management AG Gebenloostrasse 15 9552 Bronschhofen Schweiz info@cicor.com www.cicor.com ABOUT US CICOR – YOUR TECHNOLOGY PARTNER The Cicor Group is a globally active development and manufacturing partner with innovative technology solutions for the electronics industry. With about 1900 employees at ten production sites, Cicor offers highly complex printed circuit boards, hybrid circuits and printed electronics as well as comprehensive electronic manufacturing services (EMS) including microelectronic assembly and plastic injection molding. Cicor supplies customized products and services from design to the finished product from one source. The shares of Cicor Technologies Ltd. are listed on the SIX Swiss E xchange (CICN). Contact Cicor Management AG Gebenloostrasse 15 9552 Bronschhofen Switzerland info@cicor.com www.cicor.com
KENNZAHLEN
2020 / 2019
NETTOERLÖS
in CHF 1 000, falls nicht anders angegeben 1.1. - 30.6.2020 in % 1.1. - 30.6.2019 in % NACH BRANCHE
Nettoerlös aus Lieferungen und Leistungen 109 047 100,0 131 915 100,0
2% 1%
Veränderung gegenüber Vorjahr (%) –17,3 7,3 8% 0% 1%
10%
Ergebnis vor Abschreibungen und Amortisationen (EBITDA) 9 267 8,5 11 924 9,0 Industry
8%
Veränderung gegenüber Vorjahr (%) –22,3 3,1 11% HJB 202
Operatives Ergebnis (EBIT) 4 074 3,7 7 015 5,3
Ergebnis vor Steuern (EBT) 3 136 2,9 5 502 4,2 9% 46%
9% 47%
Gewinn 1 669 1,5 3 848 2,9
Ergebnis je Aktie (in CHF) 0,58 1,33
26%
Beschäftigte (Stichtag) 1 863 2 129 22%
Industrie
Investitionen in Sachanlagen 3 020 8 021 Medizin
Luft-/Raumfahrt und
in % des Nettoerlöses 2,8 6,1 Verteidigung
Uhren und Konsumgüter
Automobil und Transport
Kommunikation
Andere
NACH REGION
6% 1%
6% 0%
in CHF 1 000, falls nicht anders angegeben 30.6.2020 in % 31.12.2019 in % 16% 31%
Anlagevermögen 55 768 30,4 59 202 32,0
17% Export
29%
Umlaufvermögen 127 919 69,6 125 744 68,0 Region
Total Aktiven 183 687 100,0 184 946 100,0 HJB 202
Eigenkapital 74 183 40,4 78 805 42,6
Finanzielle Verbindlichkeiten 57 675 31,4 50 347 27,2 46%
48%
Zahlungsmittel und Zahlungsmitteläquivalente 37 402 20,4 33 660 18,2
Nettoverschuldung 20 273 11,0 16 687 9,0 Schweiz
Europa (ohne Schweiz)
Gearing ratio (Nettoverschuldung in % des Eigenkapitals) 27,3 21,2 Asien
Amerika
Andere
Vorräte 49 714 27,1 50 632 27,4
Forderungen aus Lieferungen und Leistungen 35 034 19,1 36 444 19,7
Verbindlichkeiten aus Lieferungen und Leistungen –26 256 –14,3 –28 065 –15,1
Nettoumlaufvermögen 58 492 31,9 59 011 32,0 NACH PRODUKTIONS-
REGION
20%
21%
41%
Product
Product
36%
HJB 202
39%
43%
Schweiz
Europa (ohne Schweiz)
Asien
2 Cicor | Halbjahresbericht 2020KEY FIGURES
2020 / 2019
NET SALES
in CHF 1 000 unless otherwise specified 1.1. - 30.6.2020 in % 1.1. - 30.6.2019 in % BY INDUSTRY
Net sales 109 047 100.0 131 915 100.0
2% 1%
Change compared to previous year (%) –17.3 7.3 8% 0% 1%
10%
Profit before depreciation and amortization (EBITDA) 9 267 8.5 11 924 9.0 Industry
8%
Change compared to previous year (%) –22.3 3.1 11% HJB 202
Operating profit (EBIT) 4 074 3.7 7 015 5.3
9% 46%
Profit before taxes (EBT) 3 136 2.9 5 502 4.2
9% 47%
Net profit 1 669 1.5 3 848 2.9
Earnings per share (in CHF) 0.58 1.33
26%
Number of employees (FTEs at end of period) 1 863 2 129 22%
Industrial
Capex for tangible assets 3 020 8 021 Medical
Aerospace & defence
in % of net sales 2.8 6.1 Watches & consumer
Automotive & transport
Communication
Other
BY EXPORT REGION
6% 1%
6% 0%
in CHF 1 000 unless otherwise specified 30.6.2020 in % 31.12.2019 in % 16% 31%
Non-current assets 55 768 30.4 59 202 32.0
17% 29% Export
Current assets 127 919 69.6 125 744 68.0 Region
Total assets 183 687 100.0 184 946 100.0 HJB 202
Equity 74 183 40.4 78 805 42.6
Financial liabilities 57 675 31.4 50 347 27.2 46%
48%
Cash and cash equivalents 37 402 20.4 33 660 18.2
Net debt 20 273 11.0 16 687 9.0 Switzerland
Europe (without Switzerland)
Gearing ratio (net debt in % of equity) 27.3 21.2 Asia
America
Other
Inventories 49 714 27.1 50 632 27.4
Trade receivables 35 034 19.1 36 444 19.7
Trade payables –26 256 –14.3 –28 065 –15.1
Net working capital 58 492 31.9 59 011 32.0 BY PRODUCTION
REGION
20%
21%
41%
Product
Product
36%
HJB 202
39%
43%
Switzerland
Europe (without Switzerland)
Asia
Cicor | Interim Report 2020 3PROFIL /PROFILE
GERMANY ROMANIA
RADEBERG ARAD
ULM
CHINA
SUZHOU
SWITZERLAND
BOUDRY VIETNAM
BRONSCHHOFEN
WANGS THUAN AN CITY
SINGAPORE
SINGAPORE
INDONESIA
BATAM
Cicor Verkaufsbüros
und Vertretungen «Cicor liefert massgeschneiderte
Produkte und Dienstleistungen
Cicor sales offices and representatives
Produktionsstandorte /Production sites
Leiterplatten
Printed circuit boards
vom Design bis zum fertigen
Hybridschaltungen
Hybrid circuits
Produkt aus e iner Hand.»
Gedruckte Elektronik
Printed electronics
Electronic Manufacturing Services
Electronic manufacturing services
«Cicor supplies customized
products and services from
design to the finished product
from one source.»
4 Cicor | Halbjahresbericht 2020 | Interim Report 2020INHALT
Kennzahlen 2
Brief an die Aktionärinnen und Aktionäre 6
Financial Report 2020 10
Adressen und Agenda 18
CONTENTS
Key figures 3
Letter to the shareholders 8
Financial Report 2020 10
Addresses and agenda 18
Cicor | Halbjahresbericht 2020 | Interim Report 2020 5SEHR GEEHRTE AKTIONÄRINNEN
SEHR GEEHRTE AKTIONÄRE
Nach dem stetigen Wachstum in den Vorjahren verzeichnete Cicor dustrietechnik. Daher erwartet Cicor, nach dem Ende der Corona-
im ersten Semester 2020, aufgrund der Auswirkungen der welt- Krise wieder auf den Wachstumspfad zurückzukehren.
weiten Coronavirus-Pandemie, einen Umsatzrückgang von 17,3 %
auf CHF 109,0 Mio. (1. Halbjahr 2019: CHF 131,9 Mio.). Dieser Um- Die Cicor Gruppe ist auch im aktuell schwierigen wirtschaftlichen
satzrückgang entspricht dem Ausblick vom 18. Mai 2020 und betraf Umfeld profitabel. Dank den schnell eingeleiteten Massnahmen
sowohl die Advanced Microelectronic and Substrates (AMS) und dem hohen Kostenbewusstsein im ganzen Unternehmen
Division mit einem Minus von 11,0 %, als auch die Electronic Solu- konnte im ersten Halbjahr 2020 ein positives operatives Ergebnis
tions (ES) Division, welche ein Minus von 18,9 % zu verzeichnen (EBIT) erwirtschaftet werden. Der EBIT betrug im ersten Halbjahr
hatte. Der Währungseffekt gegenüber dem ersten Semester des 2020 CHF 4,1 Mio. (1. Halbjahr 2019: CHF 7,0 Mio.). Damit lag die
Vorjahres betrug rund 4,5 %. Der währungsbereinigte Umsatz lag EBIT-Marge im ersten Semester 2020 bei 3,7 %, nachdem diese
bei CHF 114,0 Mio., was einem Rückgang von 13,6 % gegenüber im ersten Halbjahr 2019 noch 5,3 % betragen hat. Trotz schwieri-
dem ersten Halbjahr 2019 entspricht. Die EBIT-Marge im ersten gem Geschäftsgang im ersten Halbjahr 2020 ist das Netto
Semester 2020 lag bei 3,7 % und damit über dem Ausblick vom Mai. ergebnis der Gruppe mit CHF 1,7 Mio. (1. Halbjahr 2019: CHF 3,8 Mio.)
dennoch positiv ausgefallen.
Cicor hat sehr schnell auf die sich abzeichnende Krise reagiert und
konnte dank konsequent umgesetzten Schutzmassnahmen die Die Bilanz von Cicor ist weiterhin sehr solide und das Nettoumlauf-
Lieferfähigkeit gegenüber den Kunden jederzeit sicherstellen. Die- vermögen (Net Working Capital) stabil. Der Free Cashflow betrug
se Massnahmen haben zeitweise zu reduzierten Produktionskapa im ersten Halbjahr 2020 CHF 0,7 Mio. (1. Halbjahr 2019: CHF 2,5
zitäten geführt. Dennoch sind die bestehenden Kundenprojekte Mio.). Im ersten Semester 2020 hat Cicor die Aktionäre mit einer
ausnahmslos fortgesetzt worden, wenn auch teilweise mit Verzö- von der Generalversammlung genehmigten verrechnungssteuer-
gerungen. Besonders hervorzuheben ist ein Projektgewinn aus der freien Ausschüttung aus der Kapitaleinlagereserve von CHF 1,50
Medizinindustrie für ein neuartiges System zur Verabreichung von pro Aktie am Unternehmenserfolg des Vorjahres teilhaben lassen.
Medikamenten, der 2021 zu einem hohen einstelligen Mio.-Fran-
ken Umsatz führen soll. Dieses Projekt ist ein Meilenstein in der Im ersten Halbjahr 2020 wurden in beiden Divisionen gezielte In-
Weiterentwicklung der Cicor Gruppe: Es zeigt, wie Cicor als Tech- vestitionen zur Prozessoptimierung und zur Ausweitung des Leis-
nologiepartner komplexe Aufgabenstellungen mit der gebündelten tungsangebotes getätigt, jedoch aufgrund fehlender Grossinves-
Kompetenz von Engineering, Elektronikfertigung, Präzisions- titionen in deutlich niedrigerem Umfang als in den Vorjahren. Die
kunststoffspritzguss und Systembau lösen kann. Mit dem Techno- Corona-Krise wurde genutzt, um die Digitalisierung von Unter-
logiezentrum in der Schweiz und dem Verbund von Produktions- nehmensprozessen, wie zum Beispiel die papierlose Auftragsab-
stätten in Europa und Asien bietet Cicor ein äusserst attraktives wicklung in der Reinraumproduktion von Dünnschicht-Substraten
Gesamtpaket. oder die digitale Unterzeichnung von Dokumenten, innert kürzes-
ter Frist zu planen und umzusetzen. Ebenso wurde die globale
Der Auftragseingang lag im ersten Halbjahr 2020 bei CHF 92,6 Mio., Zusammenarbeit aus dem Home Office gefördert und optimiert.
was einem Rückgang von 17,2 % entspricht. Der niedrige Auftrags- Die flache und dezentrale Organisation sowie die enge Zusam-
eingang spiegelt einerseits die abwartende Haltung vieler Kunden menarbeit des Leadership Teams von Cicor haben sich während
angesichts der COVID-19 Pandemie und andererseits das Bemü- dieser Zeit einmal mehr sehr gut bewährt.
hen der Kunden um Liquiditätssicherung durch Lagerbestandsab-
bau wider, obwohl namhafte Kunden bereits wieder eine steigen- AMS DIVISION MIT UNEINHEITLICHEN
de Marktnachfrage signalisieren. Aktuell ergibt der Auftragseingang ERGEBNISSEN
im Verhältnis zum Umsatz eine Book-to-Bill-Ratio von 0,85 Die AMS Division erzielte im ersten Halbjahr 2020 einen Umsatz
(1. Halbjahr 2019: 0,85). Der Auftragsbestand per 30. Juni 2020 von CHF 28,0 Mio. (1. Halbjahr 2019: CHF 31,4 Mio.). Das entspricht
betrug CHF 125,0 Mio. (30. Juni 2019: CHF 166,8 Mio.), entspre- einem Rückgang von 11,0 % gegenüber dem ersten Semester
chend einer Auftragsreichweite von rund 7 Monaten (1. Halbjahr 2019. Das operative Ergebnis auf Stufe EBIT ist auf CHF 2,5 Mio.
2019: 7,6 Monate). Cicor hat die Akquisition von Neugeschäften seit (1. Halbjahr 2019: CHF 3,7 Mio.) gesunken. Die EBIT-Marge betrug
einigen Jahren deutlich intensiviert. Dies führt zu einer inzwischen 8,9 % (1. Halbjahr 2019: 11,8 %).
rekordhohen Pipeline mit Anfragen für Projekte von neuen und
bestehenden Kunden mit Schwerpunkten in der Medizin- und In-
6 Cicor | Halbjahresbericht 2020«Die rekordhohe Pipeline mit neuen Projekten
dürfte in den kommenden Jahren zu weiterem
Marktanteilswachstum führen.»
Die Betriebe für Dünnschicht-Substrate in Ulm (Deutschland) und Dank den hohen Engineering-Kompetenzen, einem passenden
Wangs (Schweiz) verzeichneten auch im ersten Halbjahr 2020 Footprint in Europa und Asien sowie innovativen Zusatzleistun-
eine sehr gute Nachfrage. Entsprechend konnten in diesem Be- gen wie beispielsweise Printed Electronics oder der vollautomati-
reich hervorragende Resultate erzielt werden, während die Lei- sierten Anlage zur Oberflächenbeschichtung von Kunststoffteilen,
terplattenfertigung in Boudry (Schweiz) einen Rückgang, insbe- ist die Cicor Gruppe im Electronic Manufacturing Services (EMS)
sondere aufgrund der vorübergehenden Nachfrageschwäche aus Markt für Anwendungen mit hohen Anforderungen gut positio-
der Hörgeräteindustrie wegen der COVID-19 Pandemie, zu bekla- niert. Dies hat Cicor ermöglicht, auch während der Krise namhaf-
gen hatte. Das Produktionswerk für Mikroelektronikbestückung in te Kunden, insbesondere aus den strategischen Zielmärkten Me-
Radeberg (Deutschland) entwickelt sich immer mehr zu einem dizintechnik, Industrie sowie Luft- und Raumfahrt, von den
wichtigen Partner für die Medizintechnik, wobei auch hier im ers- angebotenen Dienstleistungen zu überzeugen.
ten Halbjahr 2020 pandemiebedingte Umsatzeinbussen ver-
zeichnet werden mussten. AUSBLICK AUF DAS ZWEITE HALBJAHR 2020
Die Kunden von Cicor disponieren angesichts wieder steigender
Das Werk in Boudry (Schweiz) arbeitet intensiv an der Einführung COVID-19 Infektionszahlen und im Bemühen um Liquiditätssiche-
des modifizierten Semi-Additiv-Prozesses (mSAP), der eine Weiter- rung äusserst vorsichtig und halten sich mit der Erteilung von Auf-
entwicklung der DenciTec-Technologie darstellt und die Miniaturi- trägen noch zurück. Gleichzeitig steigt die Endkundennachfrage
sierung in Form von Leiterplatten mit kleineren Strukturgrössen in wichtigen Zielmärkten wieder an, weswegen mit Nachholeffek-
weiter vorantreibt. So können Leiterplatten mit Strukturgrössen von ten gerechnet wird. Sofern es keine erneuten Lockdowns in den
25 μm zuverlässig und effizient hergestellt werden. Die Investition in Absatzmärkten unserer Kunden geben wird, rechnet Cicor daher
die derzeit leistungsfähigste Laserbohrmaschine Europas unter- mit einer Erholung des Geschäftes ab dem vierten Quartal 2020.
stützt dieses Vorhaben. Auch an den Standorten Radeberg Damit wird der Umsatz für das Gesamtjahr 2020 gegenüber 2019
(Deutschland) und Wangs (Schweiz) wurden im ersten Halbjahr um 15–20 % tiefer ausfallen. Es wird eine EBIT-Marge von 3–4 %
2020 insgesamt drei neue Lasersysteme für die hochpräzise Mikro- erwartet. Der Ausblick beruht auf einer stabilen Währungssituation
materialbearbeitung in Betrieb genommen. gegenüber dem ersten Semester 2020.
ES DIVISION VERZEICHNET EINEN PANDE- Die mittelfristigen Aussichten sind trotz der aktuellen Situation
MIEBEDINGTEN RÜCKGANG unverändert positiv. Die rekordhohe Pipeline mit neuen Projek-
Der Umsatz der ES Division betrug im ersten Semester 2020 ten dürfte in den kommenden Jahren zu weiterem Marktanteils-
CHF 81,5 Mio. (1. Halbjahr 2019: CHF 100,5 Mio.) und ist somit auf- wachstum der Cicor Gruppe führen. Cicor ist finanziell und operativ
grund der Auswirkungen der Corona-Pandemie um 18,9 % tiefer deutlich stärker aufgestellt als viele Mitbewerber und sollte daher
ausgefallen als im Vergleichszeitraum des Vorjahres. Der EBIT ist als Gewinner aus der aktuellen Krise hervorgehen.
im ersten Halbjahr 2020 auf CHF 2,2 Mio. (1. Halbjahr 2019:
CHF 4,1 Mio.) gesunken, was einer EBIT-Marge von 2,8 % (1. Halb- Im Namen des Verwaltungsrats und der Geschäftsleitung danken
jahr 2019: 4,0 %) entspricht. wir allen, die in diesem von der Corona-Pandemie geprägten ers-
ten Halbjahr 2020 ihren Beitrag zur Entwicklung der Cicor Gruppe
Das im Vorjahr eröffnete Labor für Printed Electronics erweckt auf geleistet haben: unseren Mitarbeitenden sowie auch unseren Kun-
dem Markt weiterhin grosses Interesse und unterstreicht den An- den, Lieferanten, Aktionären und Geschäftspartnern.
spruch der Technologieführerschaft der Cicor Gruppe. Nach um-
fassenden Forschungen in den Bereichen Prozesstechnik und
Materialwissenschaft konnten nun erste Entwicklungsprojekte
von zwei Kunden aus der Medizintechnik gewonnen werden. Am
Standort Bronschhofen (Schweiz) wurden im ersten Halbjahr Heinrich J. Essing Alexander Hagemann
2020 ein zusätzlicher Reinraum der ISO-Klasse 6 sowie Spezial- Präsident des Verwaltungsrats CEO
anlagen für einen neuen namhaften Kunden aus dem Industrie-
sektor installiert.
Cicor | Halbjahresbericht 2020 7DEAR SHAREHOLDERS
After the steady growth in previous years, Cicor recorded a 17.3 % high cost awareness throughout the company, a positive operating
decline in sales to CHF 109.0 million in the first half-year 2020 (1st result (EBIT) was achieved in the first half-year 2020. EBIT for
half-year 2019: CHF 131.9 million) due to the effects of the global the first half-year 2020 amounted to CHF 4.1 million (1st half-year
coronavirus pandemic. This decline in sales is in line with the 2019: CHF 7.0 million). The EBIT margin for the first half-year 2020
outlook given on May 18, 2020 and affected both the Advanced was 3.7 %, compared with 5.3 % in the first half-year 2019. Despite
Microelectronic and Substrates (AMS) Division with a decrease of the difficult business environment in the first half-year 2020, the
11.0 % and the Electronic Solutions (ES) Division, which reported net profit of the Group is nevertheless positive at CHF 1.7 million
a decrease of 18.9 %. The currency effect compared with the first (1st half-year 2019: CHF 3.8 million).
half of the previous year was around 4.5 %. Currency-adjusted
sales amounted to CHF 114.0 million, a decline of 13.6 % compared Cicor’s balance sheet remains very solid and net working capital
with the first half-year 2019. The EBIT margin for the first half- is stable. The free cash flow for the first half-year 2020 was CHF
year 2020 was 3.7 % and thus above the May outlook. 0.7 million (1st half-year 2019: CHF 2.5 million). In the first half-
year 2020, as approved at the Annual General Meeting, Cicor let
Cicor reacted very quickly to the looming crisis and was able to shareholders participate in the company’s success of the previous
ensure its ability to deliver to customers at all times thanks to year with a withholding tax-free distribution from the capital con-
consistently implemented protective measures. These measures tribution reserve of CHF 1.50 per share.
led to temporary reductions in production capacity. Nevertheless,
existing customer projects were continued without exception, In the first half-year 2020, both divisions made targeted invest-
albeit in some cases with delays. A project win from the med- ments in process optimization and the expansion of the service
ical industry for a new type of drug delivery system, which is range, but at a significantly lower level than in previous years
expected to lead to high single-digit million Swiss franc sales in due to the non-existence of major investments. The Corona crisis
2021, deserves special mention. That project is a milestone in the was used to plan and implement the digitalization of business
further development of the Cicor Group: It shows how Cicor, as a processes, such as paperless order processing in the clean room
technology partner, can solve complex tasks with the combined production of thin-film substrates or the digital signing of docu-
competence of engineering, electronics manufacturing, precision ments, within the shortest possible time. Global cooperation from
plastic injection molding and box building. With its technology the home office was also promoted and optimized. Cicor’s flat
center in Switzerland and its network of production sites in Europe and decentralized organization as well as the close collaboration
and Asia, Cicor offers an extremely attractive package. of Cicor’s Leadership Team have once again proved to be very
effective during this period.
The Order intake for the first half-year 2020 was CHF 92.6 million
(1st half-year 2019: CHF 111.8 million), a decline of 17.2 %. The low AMS DIVISION WITH MIXED RESULTS
order intake reflects on one hand the wait-and-see attitude of In the first half-year 2020, the AMS Division generated sales of
many customers due to the COVID-19 pandemic and on the other CHF 28.0 million (1st half-year 2019: CHF 31.4 million). This repre-
hand the customers’ efforts to secure liquidity by reducing inven- sents a decline of 11.0 % compared to the first half-year 2019. The
tories, although well-known customers are already signaling a re- operating result at EBIT level fell to CHF 2.5 million (1st half-year
turn to rising market demand. The order intake in relation to sales 2019: CHF 3.7 million). The EBIT margin was 8.9 % (1st half-year
results in a book-to-bill ratio of 0.85 (1st half-year 2019: 0.85). The 2019: 11.8 %).
order backlog as at 30 June 2020 was CHF 125.0 million (June 30,
2019: CHF 166.8 million), reflecting an order backlog of around 7 The thin-film substrate sites in Ulm (Germany) and Wangs (Swit-
months (1st half-year 2019: 7.6 months). Cicor has significantly zerland) recorded very good demand also in the first half-year
intensified the acquisition of new projects in recent years. This has 2020. Accordingly, excellent results were achieved in this area,
led to a record high pipeline of requests for projects from new and while PCB production in Boudry (Switzerland) suffered a decline,
existing customers with a strong focus on medical and industrial particularly due to the temporary weakness in demand from
technology. Cicor therefore expects to return to its growth path the hearing aid industry caused by the COVID-19 pandemic. The
after the end of the Corona crisis. production site for microelectronics assembly in Radeberg (Ger-
many) is increasingly developing into an important partner for
The Cicor Group is profitable even in the difficult current economic the medical technology industry, although here too a pandemic-
environment. Thanks to the quickly introduced measures and the related decline in sales was recorded in the first half-year 2020.
8 Cicor | Interim Report 2020«The record-high pipeline with new
projects should lead to further growth
in market share in the coming years.»
The site in Boudry (Switzerland) is working intensively on the in- of orders. At the same time, the demand of end customers in
troduction of the modified semi-additive process (mSAP), which important target markets is rising again, so that catch-up effects
represents a further development of the DenciTec technology and are expected. Assuming there are no further lockdowns in our
further advances miniaturization in the form of printed circuit customers’ markets, Cicor expects a recovery of the business from
boards with smaller structure sizes. Thus, printed circuit boards the fourth quarter of 2020 onwards. Therefore, sales for the full
with structure sizes of 25 μm can be produced reliably and effi- year 2020 will be 15-20 % lower than in 2019. An EBIT margin
ciently. The investment in the most powerful laser drilling m achine of 3–4 % is expected. The outlook is based on a stable currency
in Europe to date supports this project. At the Radeberg (Germany) situation compared to the first half-year 2020.
and Wangs (Switzerland) sites, a total of three new laser systems
for high-precision micro material processing were also put into The mid-term outlook remains positive despite the current situ-
operation in the first half-year 2020. ation. The record-high pipeline with new projects should lead to
further growth in market share for the Cicor Group in the coming
ES DIVISION REPORTS PANDEMIC-RELATED years. Cicor is in a much stronger financial and operational position
DECLINE than many of its competitors and should therefore emerge from
The sales of the ES Division amounted to CHF 81.5 million in the the current crisis as a winner.
first half-year 2020 (1st half-year 2019: CHF 100.5 million) and was
thus 18.9 % lower than in the same period of the previous year due On behalf of the Board of Directors and the Group Management,
to the effects of the corona pandemic. EBIT for the first half-year we would like to thank all those who have contributed to the
2020 fell to CHF 2.2 million (1st half-year 2019: CHF 4.1 million), cor- development of the Cicor Group during this first half-year 2020,
responding to an EBIT margin of 2.8 % (1st half-year 2019: 4.0 %). which was marked by the Corona pandemic: our employees as well
as our customers, suppliers, shareholders and business partners.
The laboratory for printed electronics opened last year continues to
raise great interest in the market and underlines the Cicor Group’s
claim to technological leadership. After extensive research in the
areas of process technology and materials science, first develop-
ment projects with two customers within the medical technology Heinrich J. Essing Alexander Hagemann
sector have been won. In the first half-year 2020, an additional Chairman of the Board of Directors CEO
ISO-class 6 clean room as well as special equipment were installed
at the Bronschhofen (Switzerland) site for a well-known new cus-
tomer from the industrial sector.
Thanks to its high level of engineering expertise, a suitable foot-
print in Europe and Asia and innovative additional services such
as printed electronics or the fully automated system for surface
coating of plastic parts, the Cicor Group is well positioned in the
electronic manufacturing services (EMS) market for applications
with high demands. This has enabled Cicor to convince well-known
customers, especially in the strategic target markets of medical
technology, industry, aerospace and defence, of the services it
offers, even during the crisis.
OUTLOOK FOR THE SECOND HALF OF 2020
Cicor’s customers are extremely careful in their planning due to
the rising number of COVID-19 infections as well as in an effort
to secure liquidity and are still holding back with the placement
Cicor | Interim Report 2020 9CONSOLIDATED INTERIM FINANCIAL STATEMENTS (unaudited) CONSOLIDATED BALANCE SHEET in CHF 1 000 30.6.2020 in % 31.12.2019 in % Assets Property, plant and equipment 51 989 28.3 54 927 29.7 Intangible assets 1 114 0.6 1 325 0.7 Deferred tax assets 2 665 1.5 2 950 1.6 Non-current assets 55 768 30.4 59 202 32.0 Inventories 49 714 27.1 50 632 27.4 Trade accounts receivable 35 034 19.1 36 444 19.7 Other accounts receivable 4 272 2.3 4 009 2.2 Prepaid expenses and accruals 1 497 0.7 999 0.5 Cash and cash equivalents 37 402 20.4 33 660 18.2 Current assets 127 919 69.6 125 744 68.0 Total assets 183 687 100.0 184 946 100.0 Liabilities and shareholders' equity Ordinary share capital 29 022 15.8 29 022 15.7 Share premium 103 894 56.6 108 542 58.7 Treasury shares –6 –0.0 –299 –0.2 Retained earnings –53 504 –29.1 –55 122 –29.8 Translation reserve –5 223 –2.9 –3 338 –1.8 Total equity 74 183 40.4 78 805 42.6 Long-term provisions 3 424 1.9 3 184 1.7 Deferred tax liabilities 410 0.2 385 0.2 Long-term financial liabilities 54 372 29.6 46 898 25.4 Liabilities for post-employment benefits 1 842 1.0 1 880 1.0 Non-current liabilities 60 048 32.7 52 347 28.3 Short-term financial liabilities 3 303 1.8 3 449 1.9 Trade accounts payable 26 256 14.3 28 065 15.1 Other current liabilities 8 160 4.4 9 406 5.1 Accruals 8 859 4.9 9 652 5.2 Short-term provisions 2 641 1.4 2 699 1.5 Income tax payable 237 0.1 523 0.3 Current liabilities 49 456 26.9 53 794 29.1 Total liabilities 109 504 59.6 106 141 57.4 Total equity and liabilities 183 687 100.0 184 946 100.0 10 Cicor | Interim Report 2020 | Financial Report
CONSOLIDATED INCOME STATEMENT
in CHF 1 000                                           Notes   1.1.–30.6.2020    in %      1.1.–30.6.2019     in %

Net Sales                                                (2)        109 047     100.0            131 915    100.0
Change in inventory of finished and unfinished goods                 –2 267      –2.1                737       0.6
Material costs                                                      –54 969     –50.4           –72 918     –55.3
Personnel costs                                                     –32 915     –30.2           –36 480      –27.7
Other operating income                                                   734       0.7                217      0.2
Other operating expenses                                            –10 363      –9.5            –11 547     –8.8
Depreciation                                                         –5 019      –4.6            –4 748      –3.6
Amortization                                                           –174     –0.2                –161      –0.1
Operating profit (EBIT)                                               4 074       3.7              7 015       5.3
Financial income                                                        2 714      2.5             1 829        1.4
Financial expenses                                                   –3 652      –3.3            –3 342      –2.5
Profit before tax (EBT)                                                3 136      2.9             5 502        4.2
Income tax                                                           –1 467      –1.4            –1 654       –1.3
Net profit                                                             1 669       1.5            3 848        2.9

Earnings per share (CHF)
– basic and diluted                                                    0.58                         1.33

                                                                   Cicor | Interim Report 2020 | Financial Report 11
CONDENSED CONSOLIDATED CASH FLOW STATEMENT in CHF 1 000 1.1.–30.6.2020 1.1.–30.6.2019 Profit before tax 3 136 5 502 Depreciation / Amortization 5 193 4 909 Net interest costs 360 458 Increase / (decrease) in provisions 253 –408 Other (income) / expenses that do not affect the fund –255 264 Subtotal before working capital changes 8 687 10 725 (Increase) / decrease in working capital –2 505 3 372 Income tax paid –855 –1 631 Interest paid –385 –486 Interest received 1 3 Net cash from operating activities 4 943 11 983 Purchase of property, plant and equipment –4 284 –9 102 Proceeds from sale of property, plant and equipment – 3 Purchase of intangible assets –1 –434 Net cash used in investing activities –4 285 –9 533 Purchase of treasury shares –216 –81 Payment to shareholders from capital contribution reserves –4 339 –2 898 Proceeds / (payment) of finance lease liabilities 17 –18 Proceeds from borrowings 11 870 889 Repayment of borrowings –3 656 –3 254 Net cash from / (used in) financing activities 3 676 –5 362 Currency translation effects –592 –131 Net increase / (decrease) in cash and cash equivalents 3 742 –3 043 Cash and cash equivalents at the beginning of the period 33 660 29 843 Cash and cash equivalents at the end of the period 37 402 26 800 12 Cicor | Interim Report 2020 | Financial Report
CONSOLIDATED STATEMENT OF CHANGES IN EQUITY
in CHF 1 000                                            Share       Share   Treasury   Retained   Translation        Total
                                                       capital   premium      shares   earnings       reserve       equity
Balance at 1 January 2020                              29 022    108 542     –299      –55 122      –3 338        78 805
Net profit                                                                                1 669                      1 669
Share-based payments                                               –309         509        –51                         149
Purchase of treasury shares                                                   –216                                   –216
Dividend / capital contribution paid to shareholders             –4 339                                            –4 339
Translation adjustment                                                                               –1 885        –1 885
Balance at 30 June 2020                                29 022    103 894        –6     –53 504      –5 223         74 183

in CHF 1 000                                            Share       Share   Treasury   Retained   Translation        Total
                                                       capital   premium      shares   earnings       reserve       equity
Balance at 1 January 2019                              29 022    111 440      –172     –63 778      –1 375         75 137
Net profit                                                                               3 848                       3 848
Share-based payments                                                                       103                         103
Purchase of treasury shares                                                    –81                                    –81
Dividend / capital contribution paid to shareholders             –2 898                                           –2 898
Translation adjustment                                                                                –803          –803
Balance at 30 June 2019                                29 022    108 542     –253      –59 827      –2 178         75 306

                                                                                                      Cicor | Interim Report 2020 | Financial Report 13
NOTES TO THE CONSOLIDATED
INTERIM FINANCIAL
S TATEMENTS
(unaudited)
1. PRINCIPLES OF CONSOLIDATION
AND VALUATION
These consolidated interim financial statements of the Cicor These consolidated interim financial statements were approved by
Group as of 30 June 2020 are prepared in accordance with the Board of Directors on 12 August 2020.
Swiss GAAP FER 31 “Complementary recommendation for list-
ed companies” (GAAP = Generally Accepted Accounting Princi- When preparing the consolidated interim statements, manage-
ples / FER = Fachempfehlungen zur Rechnungslegung). They do ment is required to make estimates and assumptions. Any alter-
not include all of the information and disclosures required for full ations to these estimates and assumptions are adjusted in the
annual financial statements and should be read in conjunction reporting period in which the estimates and assumptions are
with the Group’s annual report as at 31 December 2019. Further- changed. Income taxes are calculated based on an estimate of
more, the accounting complies with the Swiss company law. The the income tax rate expected for the whole year.
consolidated financial statements of the Group as at and for the
year ended 31 December 2019 are available at www.cicor.com or
upon request from the company’s registered office.
14 Cicor | Interim Report 2020 | Financial Report2. SEGMENT REPORTING
2020 AMS Division ES Division Total Corporate and Consolidated
in CHF 1 000 1.1.–30.6.2020 1.1.–30.6.2020 reportable eliminations 1.1.–30.6.2020
segments 1.1–30.6.2020
1.1.–30.6.2020
Income statement
Sales to external customers 27 807 81 240 109 047 – 109 047
Intersegment sales 165 273 438 –438 –
Segment result before depreciation
and amortization (EBITDA) 4 690 5 248 9 938 –671 9 267
Segment result (EBIT) 2 502 2 248 4 750 –676 4 074
Balance sheet 30.6.2020 30.6.2020 30.6.2020 30.6.2020 30.6.2020
Segment assets 55 864 118 888 174 752 8 935 183 687
Segment liabilities 52 940 77 043 129 983 –20 479 109 504
Other segment information 1.1.–30.6.2020 1.1.–30.6.2020 1.1.–30.6.2020 1.1.–30.6.2020 1.1.–30.6.2020
Depreciation and amortization 2 188 3 000 5 188 5 5 193
Capital expenditures for property,
plant and equipment 1 177 1 843 3 020 – 3 020
2019 AMS Division ES Division Total Corporate and Consolidated
in CHF 1 000 1.1.–30.6.2019 1.1.–30.6.2019 reportable eliminations 1.1.–30.6.2019
segments 1.1.–30.6.2019
1.1.–30.6.2019
Income statement
Sales to external customers 31 398 100 517 131 915 – 131 915
Intersegment sales 18 23 41 –41 –
Segment result before depreciation
and amortization (EBITDA) 5 739 6 913 12 652 –728 11 924
Segment result (EBIT) 3 694 4 054 7 748 –733 7 015
Balance sheet 31.12.2019 31.12.2019 31.12.2019 31.12.2019 31.12.2019
Segment assets 57 591 123 181 180 772 4 174 184 946
Segment liabilities 53 604 80 948 134 552 –28 411 106 141
Other segment information 1.1.–30.6.2019 1.1.–30.6.2019 1.1.–30.6.2019 1.1.–30.6.2019 1.1.–30.6.2019
Depreciation and amortization 2 045 2 859 4 904 5 4 909
Capital expenditures for property,
plant and equipment 3 885 4 136 8 021 – 8 021
Cicor defines its reportable segments based on the internal re-
porting to its Board of Directors. They base their strategic and
operational decisions on these monthly distributed reports, which
include the aggregated financial data for the Group and for the
Divisions. The two Divisions, AMS and ES, have been identified as
the two reportable segments. The AMS Division supplies printed
circuit boards and thin-/thick-film coating technologies as well
as a wide range of microelectronic manufacturing capabilities to
different industries whereas the ES Division provides electronic
manufacturing services, from product development to volume
production and after-sales service.
Cicor | Interim Report 2020 | Financial Report 15For the internal reporting and therefore the segment reporting, the applied principles of accounting and valuation are the same as in the consolidated financial statements. Intersegment sales are recognized at arm’s length. in CHF 1 000 1.1.–30.6.2020 1.1.–30.6.2019 Reconciliation of total reportable segment result Total reportable segment result (EBIT) 4 750 7 748 Other corporate expenses –676 –733 Financial income 2 714 1 829 Financial expenses –3 652 –3 342 Consolidated profit before tax 3 136 5 502 in CHF 1 000 1.1.–30.6.2020 % 1.1.–30.6.2019 % Sales by destination Switzerland 34 178 31.3 37 760 28.6 Europe (without Switzerland) 50 099 45.9 63 107 47.8 Asia 16 771 15.4 22 273 16.9 America 6 681 6.1 8 496 6.4 Other 1 318 1.3 279 0.3 Total 109 047 100.0 131 915 100.0 Sales by industry Aerospace & defence 10 268 9.4 11 640 8.8 Communication 1 815 1.7 703 0.5 Industrial 50 182 46.0 62 283 47.2 Medical 27 786 25.5 29 357 22.3 Automotive & transport 9 236 8.5 12 878 9.8 Watches & consumer 9 052 8.3 13 986 10.6 Other 708 0.6 1 068 0.8 Total 109 047 100.0 131 915 100.0 Sales by production region Switzerland 44 762 41.0 47 446 36.0 Europe (without Switzerland) 42 868 39.4 57 335 43.4 Asia 21 417 19.6 27 134 20.6 Total 109 047 100.0 131 915 100.0 Major customers Cicor Group’s biggest customer contributes less than 6 % (1st half- year 2019: less than 8 %) to the Group’s consolidated sales. 16 Cicor | Interim Report 2020 | Financial Report
3. SYNDICATED BANK LOAN AGREEMENT Conditional capital
On 30 June 2017, the Group signed a new syndicated bank loan At the Shareholders’ Meeting on 13 May 2009, the shareholders
agreement on a total line of CHF 75 million plus allowance of an decided to increase the conditional share capital up to 200 000
external basket of CHF 10 million valid for four years, beginning on fully paid-in registered shares with a total nominal value up to
5 July 2017, with two extension options of one additional year each, CHF 2 000 000 for the exercise of stock option rights granted to
therefore running for a maximum term of six years. On 25 May officers and other key employees.
2018, the Group made use of the first extension option, prolonging At the Shareholders’ Meeting on 13 May 2009, the shareholders
this very syndicated bank loan to 30 June 2022. Up to 30 June decided to create additional conditional share capital of up to
2020 the total line of the syndicated bank loan has been reduced 500 000 fully paid-in registered shares with a total nominal val-
to CHF 70.5 million. ue of up to CHF 5 000 000 for the exercise of conversion rights
granted to holders of convertible debt securities to be issued by
the company. Such conversion rights would have to be exercised
4. ISSUED CAPITAL within five years of the issuance of such convertible debt securities.
in CHF 1 000
Share capital at 1 January 2019 29 022 5. DIVIDENDS
Share capital at 31 December 2019 29 022 At the Shareholders’ Meeting on 16 April 2020, the shareholders
Share capital at 30 June 2020 29 022 decided a withholding tax-free distribution of CHF 1.50 per share
(totalling CHF 4.3 million) from the capital contribution reserve.
2 902 092 registered shares of CHF 10
Ordinary share capital 6. SUBSEQUENT EVENTS
Neither in 2019, nor in 2020 has there been an increase in There were no events between 30 June 2020 and 12 August 2020
ordinary share capital. that would require an adjustment to the carrying amounts of assets
and liabilities or need to be disclosed under this heading.
Authorized capital
At the Shareholders’ Meeting on 16 April 2020, the shareholders
decided to renew the authorization of the Board of Directors to
increase the share capital by a maximum of 600 000 fully paid-in
shares at a nominal value of CHF 10 until 16 April 2022.
Cicor | Interim Report 2020 | Financial Report 17ADDRESSES
HEAD OFFICE CICOR ELECTRONIC CICOR ADVANCED
Cicor Technologies Ltd. SOLUTIONS MICROELECTRONICS
Route de l’Europe 8 Swisstronics Cicor Anam Ltd.
& SUBSTRATES
2017 Boudry Contract Manufacturing AG 15 VSIP Street 4 Cicorel SA
Switzerland Gebenloostrasse 15 Thuan An City Route de l’Europe 8
info@cicor.com 9552 Bronschhofen Binh Duong Province 2017 Boudry
Switzerland Vietnam Switzerland
Tel. +41 71 913 73 73 Tel. +84 274 375 66 23 Tel. +41 32 843 05 00
CONTACT Fax +41 71 913 73 74 Fax +84 274 375 66 24 Fax +41 32 843 05 99
Cicor Management AG
S.C. Systronics S.R.L. Suzhou Cicor Technology Co. Ltd. Cicor Americas Inc.
Gebenloostrasse 15
Str III –Zona Industriala EPZ No. 11 Building 185 Alewife Brook Parkway
9552 Bronschhofen
Arad Vest, Nr. 14 No. 666 Jianlin Road Suite #210
Switzerland
310580 Arad SND-EPZ Sub-industrial Park Cambridge, MA 02138
Romania Suzhou, China 215151 USA
Tel. +41 71 913 73 00
Tel. +40 257 285 944 Tel. +86 512 6667 2013 Tel. +1 617 576 2005
Fax +41 71 913 73 01
Fax +40 257 216 733 Fax +1 617 576 2001
info@cicor.com
Cicor Asia Pte Ltd. RHe Microsystems GmbH
45 Changi South Avenue 2 Heidestrasse 70
#02-01 and #04-01 01454 Radeberg
Singapore 486133 Germany
Singapore Tel. +49 3528 4199-0
Tel. +65 6546 16 60 Fax +49 3528 4199-99
Fax +65 6546 65 76
Reinhardt Microtech GmbH
PT Cicor Panatec Sedanstrasse 14
Batamindo Industrial Park, 89077 Ulm
Lot 322–324 Germany
Jalan Beringin, Muka Kuning Tel. +49 731 9858 8413
Batam 29433 Fax +49 731 9858 8411
Indonesia
Tel. +62 770 61 22 33 Reinhardt Microtech AG
Fax +62 770 61 22 66 Aeulistrasse 10
7323 Wangs
Switzerland
Tel. +41 81 720 04 56
Fax +41 81 720 04 50
AGENDA
Annual Report 2020: 11 March 2021 Published by This Interim Report can be accessed
Annual Shareholders‘ Meeting: April 2021 Cicor Technologies Ltd. on the Internet at www.cicor.com.
Interim Report 2021: August 2021 Photos: Cicor Technologies Ltd. The German text is binding.
© Cicor Technologies Ltd.
August 2020Cicor Technologies Ltd. Route de l’Europe 8 2017 Boudry Switzerland www.cicor.com
Sie können auch lesen