Forschung an der NORDAKADEMIE
←
→
Transkription von Seiteninhalten
Wenn Ihr Browser die Seite nicht korrekt rendert, bitte, lesen Sie den Inhalt der Seite unten
Heft 10 I Dezember 2019

Forschung
an der NORDAKADEMIE

Heft 10│Dezember 2019│Forschung an der NORDAKADEMIE
Impressum

NORDBLICK
Forschung an der NORDAKADEMIE
Heft 10│Dezember 2019
ISSN-Online 2509-2987

Herausgeber:
Präsidium der NORDAKADEMIE – Hochschule der Wirtschaft
Köllner Chaussee 11 │ D-25337 Elmshorn

Redaktion:
Prof. Dr. habil. Stefan Behringer

Redaktionsassistenz:
Simon Hachenberg, M.A.
Anjuli Unruh, M.Sc., LL.M.
Köllner Chaussee 11 │ D-25337 Elmshorn
Telefon (04121) 4090 0
nordblick@nordakademie.de

Die nächste reguläre Ausgabe erscheint voraussichtlich im Juni 2020.
Redaktionsschluss: 09. April 2020
Zusendung von Beiträgen bitte an obengenannter E-Mail-Adresse.
INHALTSVERZEICHNIS

Vorwort ............................................................................................................................................ 5
Stefan Behringer

Innovation und Netzwerkeffekte
Social Connectedness and Product Exposure in the Innovation Decision Process .................. 6
Klaus Iffländer und Michael Fretschner

Innovation und ökonomische Auswirkungen
Hat Künstliche Intelligenz Ökonomische Auswirkungen?.......................................................... 24
Henrique Schneider

Innovation im Ingenieurwesen
A Systems Engineering Approach to the Use of Additive Manufacturing in the Design and
Production of Machinery .............................................................................................................. 36
Bernhard Meussen und Benjamin Wagner

Innovation inder Softwareentwicklung
Anforderungsanalyse in agilen Projekten mit Stakeholder-Boards ........................................... 48
Joachim Sauer und Felix Schaeffer


VORWORT
Liebe Leserinnen und Leser,

vor Ihnen liegt die zehnte Ausgabe des NORDBLICK. Seit der ersten Ausgabe hat sich viel
bewegt: Wir blicken auf neun Ausgaben, 66 Beiträge, zwei Sonderbände und einen
Designrelaunch zurück. Wissenschaftler der NORDAKADEMIE und anderen (inter)nationalen
Hochschulen, Unternehmensmitarbeiter und unsere Studierenden veröffentlichten Beiträge zu
Forschungsprojekten und innovativen Neuerungen in ihren Themengebieten.

Die vorliegende Ausgabe gibt Einblicke in alle Fachbereiche der NORDAKADEMIE und stellt
ausgewählte Themen und deren Bezug zu Innovation vor. Mit zwei englischsprachigen
Beiträgen und einem Beitrag in schweizerischen Deutsch, besitzt diese Ausgabe einen starken
internationalen Charakter.

Iffländer und Fretschner untersuchen in ihrer Studie, welche Auswirkung Netzwerkeffekte auf
den Einführungsprozess einer Innovation vermitteln. Hierzu kombinieren sie die Analyse des
sozialen Netzwerk eines Golfclusbs und die Innovationsentscheidungsprozesse nach Roger.
Schneider betrachtet die ökonomischen Auswirkungen von Innovationen. Am Beispiel von
künstlicher Intelligenz zeigt er ökonomische Faktoren auf, die direkte Einflüsse auf den Erfolg
von künstlicher Intelligenz haben.

In den Beiträgen von Meussen und Wagner sowie Sauer und Schaeffer werden Indikatoren
vorgestellt, um Innovationsprojekte in Unternehmen erfolgreich abzuwickeln. Meussen und
Wagner leiten aus einer Situationsanalyse Indikatoren für die Messung des Nutzens von 3D-
Druckern ab. Die ermittelten Indikatoren stellen Leitlinien für Entscheidungskriterien für 3D-
Druck im Vergleich zu herkömmlichen Fertigungstechnologien dar. Mit der Steuerung
von agilen Projekten in der Softwareentwicklung beschäftigen sich Sauer und Schaeffer.
Mit dem Konzept der Stakeholder-Boards stellen die Autoren einen in der Praxis
entwickelten Ansatz vor.

Wir wünschen Ihnen eine angenehme Lektüre

Prof. Dr. habil. Stefan Behringer

Präsident
NORDBLICK│10 (2019)│Seite 6

SOCIAL CONNECTEDNESS AND
PRODUCT EXPOSURE IN THE
INNOVATION DECISION PROCESS
Klaus Iffländer
Head Of Analytics, YAS.life

Michael Fretschner
Professorship of Marketing & E-Commerce, NORDAKADEMIE – Hochschule der Wirtschaft

 Abstract: This study connects two research streams that both share the goal of explaining
 adoption decisions, but have lacked a proper integration so far: social network analysis and
 Roger’s innovation decision processes. We aim to provide a more detailed understanding of the
 impact of network effects on the emergent process of adopting an innovation. Drawing on
 Roger’s stages in the innovation decision process, we hypothesize that the exposure to the
 product innovation and the connectedness in a social network impact each of the process stages
 – knowledge, persuasion, and decision – in a different way. To test our conceptual model, we use
 a unique dataset containing members of a German golf club and study the diffusion of an electric
 golf trolley in this population. We find support for our hypotheses and detect a negative
 interaction between connectedness and exposure on knowledge of the product class that in turn
 explains the innovation’s perceived relative advantage and finally, its adoption. Our study has
 several implications for the adoption and diffusion of innovations.

 Keywords: Adoption of Product Innovations; Diffusion Theory; Network Position; Social
 Connectedness; Product Exposure

 INTRODUCTION
With the rise of online social networks, it becomes increasingly transparent what our friends
think, like, and choose on a daily basis. However, this role of social networks in shaping the
minds of individuals is not new and does not only pertain to online settings. Rather, the
fundamental mechanisms and principles of social networks have been researched for
decades and the online social platforms that are so present today often just apply the findings
of researchers that have founded this discipline (Festinger et al., 1950; Back, 1950; Dodd, 1955;
Coleman et al., 1957; Erdös and Rényi,1960). One of the most interesting topics to both
researchers and platform owners concerns the ways and modes of product diffusions within
a given network.

 Dr. Klaus Iffländer is Head Of Analytics at YAS.life, a Berlin-based B2B-health-startup. Klaus studied business
 informatics and wrote his doctoral thesis at Hamburg University of Technology on people's decision-making
 behaviour towards innovations. He gained experiences at YAHOO in strategic partnership management, at IBM in
 statistical forecasting of sales figures, and as a business intelligence consultant at Deloitte. At YAS.life, he leads
 the data science team and drives decisions to build better products that motivate people to live a healthier, more
 active lifestyle
 E-Mail: Klaus@yas.life

 Dr. Michael Fretschner, MBR holds the Professorship of Marketing & E-Commerce at the NORDAKADEMIE -
 Hochschule der Wirtschaft, where he represents the fields of digital marketing, e-commerce, and online market
 research in teaching, research, and practice from a data-driven perspective. Before joining NORDAKADEMIE, he led
 Unruly’s Insight & Solutions team in Germany, Scandinavia, and the Netherlands as Vice President Northern Europe,
 designing and implementing custom research projects, ad content testings, and data-driven audience solutions for
 major advertisers and agencies. Michael earned his Ph.D. in Business Administration from Ludwig-Maximilians-
 Universität (LMU) in Munich.
 E-Mail: michael.fretschner@nordakademie.de

Social Connectedness and Product Exposure in the Innovation Decision Process

A research stream complementing the social network school of thought is concerned with
studying the drivers of product diffusion from an individual-level perspective (e.g. Choudhury
and Galletta, 2015; O’Keefe and McEachern, 1998). This conception is still at the heart of
decision theory today. This dualism between an individual’s decision-making process and the
influence of the social network that surrounds her poses several theoretical questions. On the
one hand, there is strong evidence for the powerful influence of a social network on an
individual’s time of adoption (Valente, 1996), attitudes (McPherson et al., 2001), emotions
(Kramer et al., 2014), and even lifestyle choices (Christakis and Fowler, 2007). On the other
hand, many researchers have shown that individual consumers follow a clear, internal step-by-
step process in order to reach an adoption decision (e.g. Hassinger, 1959). In their view, there
are individual differences that concern thresholds and modes of information gathering, but it
is clear that the individual reaches a final conclusion by herself. Although a few notable
attempts have been made in order to measure and compare the effect of the social network
with other marketing activities on the adoption rate (e.g. Sundararajan, 2012; Risselada and
Verhoef, 2013), both research streams have not been consistently linked yet. This opens the
door for studying the external effects of a social network on internal adoption decisions of an
individual. In order to bridge the gap between network-level influence and the individual’s
cognitive process to reach an adoption decision, we develop and test an empirical model by
drawing on Rogers’ (2003) innovation decision process. Since we focus on the initial purchase
decision, our analysis is limited to the first three phases of the process: knowledge, persuasion,
and decision. We relate the outcome of each phase to an actor’s social connectedness and
product exposure in order to detect the mechanisms of the social network.

 THEORETICAL FOUNDATION
2.1 Social Connectedness and Product Exposure
Social network theory has shown that a subject’s position in a social network has a significant
impact on her adoption behavior. In this study, we propose and test two distinct mechanisms
of how a social network may influence individual adoption behavior: 1) The direct effect, that
has been implied by former studies and 2) the indirect effect (via the individual’s knowledge),
that has been speculated as a possible explanation for the overall effect. We will introduce
hypotheses that provide arguments for both of these mechanisms.

Being more connected in a network is associated with a better flow of communication and
therefore a higher chance of coming into contact with an innovation early in the diffusion
process (see Rogers and Shoemaker, 1971). This is especially true in contexts where other
information channels (like mainstream media or print) have little or no impact. Thus, the level
of connectedness within a social network has been repeatedly shown to be a source for
valuable information (e.g. Risselada and Verhoef, 2013). Since the landmark study of
Granovetter (1973) which showed that widespread network ties yielded better jobs for workers
in a Boston suburb than tightly knit local communities, the concept has been a starting point
for the development of the theory of social capital. Burt (2004) showed that being in a network
position spanning several clusters and with it the access to information that would otherwise
not be shared across them is associated with a better capability to generate innovations in an
organizational context. A study conducted by Centola (2010) suggests that in the context of
innovation diffusion, social reinforcement of the focal behavior efficiently facilitates its spread
through the network. Centola (2010) explicitly attributes this phenomenon to locally clustered
networks, since individuals receive the same information from multiple connected actors.
Highly connected actors received the most information in the form of social reinforcement.

Drawing on previous research that showed how a central network position is related to
superior access to information, it seems plausible that the individuals will satisfy this
information need by utilizing their surrounding network ties. Thus, we propose:

NORDBLICK│10 (2019)│Seite 8

Hypothesis 1: The individual’s connectedness in the social network will be positively related to
her knowledge of the innovation.

The notion that better connected individuals receive more information from their network
contacts has developed into the theory of social capital (Burt, 1993). Although different
definitions exist, traditional sociology views social capital as a structural advantage that
translates into access to resources that other individuals lack. This view is attributed to the
work of Bourdieu (1986) who argues that an individual’s position within its field impacts the
resources and power she has. Burt (1993) adopts the view of Bourdieu to establish his theory
of structural holes: Whenever an individual spans several clusters of more densely connected
nodes this individual spans a “structural hole”. She connects two groups that otherwise
wouldn’t be talking to each other. This is equivalent to an information advantage that can be
capitalized upon – hence the term “social capital”. The benefits of accumulating social capital
have been shown in several studies. Being connected to diverse ties is not only an information
advantage that can be used to find better jobs. It has also been shown to be beneficial in other
types of settings. It is associated with power and influence in organizations (Brass, 1984), and
can also help to accumulate more material resources such as money (see Lin (1999) for a
more exhaustive review).

While Burt (1980a) introduces the model as a general framework capturing the drivers of
human actions, Burt (1980b) applies the model to the context of innovation adoption. Burt
develops a mathematical model that proposes that individual evaluations of actions are
dependent on two things: 1) personal preferences and 2) structural uniqueness of the actor’s
network position. In line with Rogers’s view of an innovation being dependent on a perception
of newness by the adopting unit, the innovation ceases to be an innovation, the more people
adopt it. Therefore, Burt proposes that the utility that an actor can gain from adopting the
innovation declines over time. After the innovation’s initial release into a social system, the
utility that an actor can derive from it decreases with the amount of other actors that have
already adopted it. This conception leads to several conclusions, most notably that
innovations will be adopted first by structurally unique actors.

Burt’s proposition, however, is not in accord with several empirical results that show that
isolated individuals are not among the first to adopt the innovation. Coleman et al. (1957)
assess the social connections of physicians and their prescription behavior for a novel drug.
They find that the network position has a strong impact on the time of the prescription
(adoption) and that especially highly connected physicians were among the first to prescribe
the novel drug. Actors on the fringes of the network often fail to adopt the innovation. Valente
(1996) reanalyzes Coleman’s study together with two other diffusion studies (Rogers et al.,
1970; Rogers and Kincaid, 1981) to establish an explicit connection between the network
patterns and the adopter categories proposed by Rogers (2003). Valente also find that
innovators are usually highly connected. Other empirical studies corroborate this observation.
Durrington et al. (2000), who examine the adoption of a technical service, find that the most
connected individuals were among the first to adopt. Angst et al. (2010) show that the same
is true on an organizational level by analyzing the adoption of electronic medical records by
hospitals. Risselada and Verhoef (2013) investigate the adoption of high-tech products and
also find a strong impact of a central network position on the adoption decision, even when
accounting for direct marketing activities.

For these reasons, it seems plausible that an actor’s adoption decision is significantly derived
from her centrality position in a social network which is relevant for the diffusion of the
investigated innovation. Thus, we propose:

Hypothesis 2: The individual’s connectedness in the social network will be positively related to
her probability to adopt the innovation.
Social Connectedness and Product Exposure in the Innovation Decision Process

Product exposure concerns the proportion of adopters in an individual’s personal network at a
given time. Valente (1996) defines and illustrates the concept with data from Coleman et al.
(1966) in order to document individual thresholds that explain when an individual adopts. In
Valente’s threshold model, exposure is defined in terms of ego networks as the number of
alters who have already adopted, divided by the total number of alters in a given network. While
Marsden and Podolny (1990) claim that the adoption decision is not impacted by exposure to
the product at all, while Valente (1996) shows that the effect is moderated by an individual
threshold. He links the adopter categories introduced by Rogers (2003) with a specific
threshold value that corresponds to each adopter category. He then presents empirical
evidence that individuals with low thresholds engage in collective behavior before many others
do, while individuals with high thresholds do so only after most of the group has engaged in
the collective behavior (Valente, 1996).

Other studies find that there is a direct influence of exposure on the adoption decision,
regardless of an individual threshold (e.g. Aral and Walker, 2011; Iyengar et al., 2008;
Durrington et al., 2000). In each of these studies the reasoning is that members of the social
network with more exposure to the innovation are better informed about it. Risselada and
Verhoef (2013) as well as Barrot and Albers (2008) analyze very detailed datasets and detect
evidence for interpersonal influence. Their studies also indicate that there is an information
transfer between members of a social network that fosters the diffusion of innovation. In other
words: individuals do influence each other in a network context to adopt an innovation. The
process of acquiring knowledge through exposure is different, however, from the information
flow facilitated by a central network position (captured by hypothesis 1). First, being in a
central network position does not necessarily mean that an individual is surrounded by many
adopters of the innovation. It is entirely possible to be highly connected within local clusters
of individuals who generally oppose the innovation. This would entail little information flow
regarding the innovation, while the measure of connectedness would still be high for a central
individual in such a cluster. Second, a high exposure means that an individual actually comes
into contact with other actors who have already adopted. The process of acquiring knowledge
by meeting an adopter or gaining experience with the innovation is much more active and
involved. This becomes especially obvious when the individual is asked to report her exposure
herself. She will be much more likely to accurately report her exposure to the innovation than
a measure of connectedness in a social network, since she is able to recall (at least vaguely)
how many of her direct ties are adopters. Therefore, exposure, or being surrounded by
adopters of an innovation, represents a different mechanism of acquiring knowledge of an
innovation. Finally, Goldenberg et al. (2001) find evidence for high product exposure being only
indirectly related to adoption decisions via an individual’s knowledge of the product class. We
will therefore explicitly model the influence of exposure to the innovation on the individual’s
knowledge of the product class, leading to:

Hypothesis 3: The proportion of friends who have already adopted the innovation will be
positively related to an individual’s knowledge of the product class.

In hypotheses 1 and 3 we outlined that individuals acquire knowledge about an innovation via
interpersonal ties in the two described ways of social connectedness and product exposure.
There is no theory suggesting that one of the two proposed mechanisms is superior to the
other when acquiring knowledge about an innovation via interpersonal information channels.
Rather, both are equally suitable to gain an understanding of the principles of an innovation
that is introduced into a social system. We therefore argue that individuals utilizing either of
the proposed processes can gain high levels of knowledge of the innovation, but there is no
advantage in utilizing both.

Using multiple processes or other channels in addition to the interpersonal channels under
investigation here, might be advantageous for especially complex innovations where different
types or large amounts of knowledge must be acquired before the principle of an innovation
NORDBLICK│10 (2019)│Seite 10

can be understood (Hansen, 1999). However, this kind of innovation is not the focus of this
study. Only individuals that are not in a position to utilize either of the two proposed processes,
i.e. who are neither particularly central to a network, nor have a decent level of exposure, will
have low levels of knowledge of the innovation. All else equal, individuals in this situation are
likely to be “left out”, since they have no way to access information about the innovation via
their social ties. This should result in markedly lower levels of knowledge about the innovation.
The proposed effect can be tested by defining an interaction term. Both variables, the
connectedness of an actor and her exposure are multiplied and the resulting term is tested for
its effect on the actor’s knowledge. We therefore introduce

Hypothesis 4: The interaction term of eigenvector centrality and the proportion of friends who
have already adopted the innovation will be negatively related to an individual’s knowledge of
the product class.

2.2 Knowledge and Relative Advantage
It has been argued extensively that an individual’s knowledge of a product or an innovation is
gathered to reduce uncertainty (e.g. Klerck and Sweeney, 2007) which represents a crucial
factor in the innovation decision process. Ratchford (2001) makes this most explicit by
quantifying the costs for acquiring information on an innovation in order to decrease
uncertainty for an individual. This view was also adopted by diffusion researchers. Knowledge
of a product class has been shown to play an important role in the individual’s decision process
to adopt an innovation. Highlighted by Rogers (1976) it is shown to have a major influence in
the decision to adopt an innovation. Rogers explicitly cites the Taichung experiment
(Freedman et al., 1964) for this contribution to diffusion theory. The authors were able to show
in a field experiment that intervention by mass media, meetings, and change agents fostered
the accumulation of knowledge about family planning. In another study by Wang et al. (2008),
the perception of a new service was investigated. The authors produce compelling evidence
that with increasing knowledge about the service under investigation, consumers also
developed a clearer perception of the novel functionality and uniqueness of the service. This
effect extended to the adoption intention. Therefore, we hypothesize that knowledge will have
a direct impact on the adoption decision and introduce:

Hypothesis 5: The individual’s knowledge of the product class of the innovation will be positively
related to her probability to adopt it.

In Rogers’ (2003) framework on the innovation decision process, he assumes that an
individual’s knowledge precedes the recognition of a product’s relative advantage. In the
knowledge phase of the process model, the individual collects information on the innovation
before she enters the persuasion phase. In this phase, the individual becomes more involved
with the attributes of an innovation and engages in different mental processes in order to arrive
at a decision to adopt or reject the innovation, e.g. forward planning: “What if I adopt the
innovation?” With this thinking, the consumer is more likely to either recognize the relative
advantage of an innovation or at least engage in more information seeking. Gathering
additional information about the innovation, regardless of the medium used, will decrease the
consumer’s perception of risk and uncertainty that is associated with an adoption decision
(Rogers, 2003). Studies on risk perceptions and decisions under uncertainty have shown that
providing more information is likely to reduce uncertainty, making the consumer more
confident towards a decision, and recognize the advantages of an innovation (Ghadim et al.,
2005).

While Rogers points out that a clearer recognition of the relative advantage does not
necessarily lead to a higher inclination to adopt an innovation, it is certainly an outcome of the
mental processes occurring during the persuasion stage. It is also important to note that
Rogers does not claim a linear process to be at work. He explicitly notes that there are cases
Social Connectedness and Product Exposure in the Innovation Decision Process

where a clear need prompts an immediate recognition of the relative advantage of an
innovation, which then leads to further information seeking and an accumulation of knowledge
about it.

Distinguishing further between different kinds of channels, Rogers (2003) makes another
argument for the perception of the relative advantage being preceded by knowledge about the
innovation. He distinguishes between mass media and interpersonal channels. While the first
is especially useful to acquire a general awareness-knowledge of an innovation, only the latter
is suited to “reinforce” (Rogers, 2003) people’s opinions in a way that they form stable
perceptions about an innovation (Agarwal and Prasad, 1998). This view is adopted by Agarwal
and Prasad (1998) and corroborated with findings from Media Richness Theory (Daft R.H.,
1986), which puts communication channels on a “richness” continuum, based on their ability
to address the needs of uncertainty. In this view and in line with Rogers (2003), interpersonal
channels are especially “rich” due to their capability to deliver personalized information and
persuade people, i.e. adjust their views by reducing uncertainty. Agarwal and Prasad (1998)
find evidence for this association in the context of the adoption of information technology.
They also present evidence that the association between knowledge and the perceived relative
advantage is particularly strong when the individuals make use of interpersonal
communication channels. More evidence comes from two studies investigating the adoption
of high-definition television (Dupagne, 1999) and electronic reading devices (Jung et al., 2011).
Both find evidence for the proposed relationship with the latter reporting a highly significant
correlation of 0.446 between the awareness of an innovation and its perceived relative
advantage.

Therefore, we might assume that in a situation where information about an innovation is
gathered mostly by using interpersonal channels, accumulating knowledge about the
innovation will be positively associated with an increased perception of the relative advantage:

Hypothesis 6: The knowledge of the innovation that an individual has will be positively related
to that individual’s perception of the innovation’s relative advantage.

The concept of relative advantage has been widely studied in diffusion research. It seems to
be perceived as a key attribute of innovations that drive its adoption (Tornatzky and Klein
(1982) provide an overview). Rogers (2003) lists all areas that have been identified to drive
adoption decisions and thereby the adoption rate. Even though the topic has been researched
numerous times, several studies have identified different areas that impact adoption
decisions, depending on the situation and the specifics of the adoption. The only driver that
has been consistently reported to have a significant impact is the relative advantage, as
defined by Rogers and Shoemaker (1971) (Jung et al., 2011; Hernandez et al., 2007).

Tornatzky and Klein (1982) most rigorously revisited the research on innovation attributes in a
meta-analysis. Although they convincingly point out that the field has not been able to develop
a standard on how to measure or implement the relative advantage of an innovation, three
characteristics were found to have consistent positive associations with the adoption behavior
– compatibility, relative advantage and complexity. All three showed a positive impact on the
binomial probability of an adoption of the innovation under study. However, relative advantage
is the only variable that has been consistently identified as a critical adoption factor. Moore
and Benbasat (1991) later put considerable effort into the development of a survey instrument
to measure innovation attributes. Even though this set of items was developed for personal
workstations, it can easily be adopted to other technological innovations. In line with Tornatzky
and Klein (1982), Moore and Benbasat (1991) find that relative advantage has the largest
effect on the adoption of the innovation under study. Drawing on these arguments, we posit

Hypothesis 7: The perceived relative advantage of the innovation will be positively related to the
individual’s probability to adopt it.
NORDBLICK│10 (2019)│Seite 12

Hypothesis 7 also constitutes a competing explanation as to how knowledge impacts the
adoption decision. While hypothesis 5 proposes a direct connection, hypotheses 6 and 7
model an indirect effect via consumer’s perception of the innovation’s relative advantage. All
hypotheses are depicted in Figure 1.

 Figure 1: Research Model

 METHODS
3.1 Sample and Data Collection
In order to test the proposed hypotheses, an empirical field was selected that conformed to
the following requirements: (1) There is a clearly defined social system and it can be easily
determined who belongs to it; (2) The members of the social system know each other to some
extent and the connections are measurable; (3) The social system is confronted with an
innovation that is relevant to the members, but not yet completely diffused.

For these reasons, we decided to study the diffusion of electrically powered golf trolleys (e-
trolleys) in an urban golf club in northern Germany. In order to collect the data, two distinct
sources were used: 1) network data that contained the rounds of golf played among all club
members within a focal time period, and 2) survey data that was collected using a
questionnaire.

3.1.1 Network Data

The network data was pulled from the golf club’s booking system. In order to play a round of
golf, each player has to book a time slot with the club’s reception first. Each player is identified
by her member number and the time slots are recorded and managed in a digital booking
system similar to a calendar. The data therefore shows every round played by every player that
has been on the course in the focal time period. The records show all rounds played by golfers
with the corresponding time slot from the entire year 2013. This data has been used to
construct a 2-mode network in which players are connected to events. This has been collapsed
to a 1-mode network that directly connects players to each other. Whenever two or more
players participated in the same event (a round of golf) they received a tie between them. The
resulting network consists of 665 nodes (members of the club that played at least once in
2013) and 5,742 ties between them (self-loops not included). The construction and all
transformations of the network data were conducted with ORA NetScenes 3 (Carley et al.,
Social Connectedness and Product Exposure in the Innovation Decision Process

2013). Eigenvector centrality as introduced later was then calculated for each node using
UCINET 6 (Borgatti et al., 2002).

3.1.2 Survey Data

In addition to the extraction of network data from the booking system, golf club members were
surveyed about their adoption of electric golf trolleys. The survey was conducted at the end of
the time period when the network data was collected, in October and November of 2013. The
members could either answer a paper-and-pencil or an online version of the survey. With the
support of the golf club’s management, the survey was announced and the members were
encouraged to take it. As an incentive to take the survey, the first author of the study offered
to support the club’s trainers in training the member’s children for a small amount of time in
exchange for each completed questionnaire. The invitation with a link to the survey was sent
out via email as part of the club’s monthly newsletter. Reminders to participate were sent out
two weeks later with the next newsletter following the initial invitation. In addition to the online
survey, a paper-based questionnaire was always present in the club house and members were
encouraged by the staff as well as posters to take the survey and leave it with the receptionist.
In this way, 224 completed surveys were obtained, 84 were taken offline (37.5%) and 140 online
(62.5%). Compared with the members that are listed in the booking system (665) this yields a
return rate of 33.7%. The 224 surveys were combined with the network dataset using the
member ID that was indicated on the survey and then matched with the corresponding records
in the network dataset. Unfortunately, 59 surveys could not be matched with a network node.

Of the remaining 165 surveys that could be matched, 6 had to be discarded because more than
40% of the responses were missing. Further, we excluded one outlier after conducting
extensive univariate and multivariate outlier analyses according to Hair et al. (2009) using
Mahalanobis distances and chi-square-plots (Garrett, 1989; Filzmoser et al., 2005). Before data
imputation, we performed several tests in order to examine if the data is missing not at random
(MNAR), missing at random (MAR), or missing completely at random (MCAR). Thus, we
conducted Little’s (1988) test for MCAR and a series of t-Tests and logistic regressions as
suggested by Kim and Bentler (2002) to examine the missingness of our model variables. We
found our data to be MAR and thus applied Multiple Imputation (MI). We choose MI because
it is regarded to perform better in small sample sizes (Graham, 2012) and does not assume a
specific distribution of the data. The imputation was computed using Mplus 6 (Muthén and
Muthén, 2010).

3.2 Measurement
Adoption Decision. The adoption decision is measured by the individually reported outcome of
the subject’s decision to purchase the focal innovation of this study, i.e. an electric golf trolley
of any producer. In line with Van den Bulte and Joshi (2007), Im et al. (2003), and Moe and
Fader (2001) who studied the adoption decisions for consumer goods, our study subjects were
asked to indicate in a questionnaire if they own an electric golf trolley (yes/no).

Relative Advantage. Rogers (2003) emphasizes that the relative advantage of an innovation
has to be defined specific to each innovation. Thus, there is no common measurable definition
for an innovation’s relative advantage (see also the critique by Tornatzky and Klein, 1982). The
instrument provided by Moore and Benbasat (1991) for personal workstations is commonly
adapted to measure the perceived relative advantage of a given innovation. However, the
researcher still has to define what exactly the relative advantage is for each innovation. Thus,
we explored the perceived relative advantage of electric golf trolleys in a small pilot study at
another golf club using in-depth qualitative interviews (N=7) prior to the main study. The
purpose of the interviews was to find out which dimensions of electric golf trolleys were
perceived to outperform traditional golf trolleys. The analysis of the interviews revealed that
potential and actual adopters perceived the following attributes as most advantageous: (1)
NORDBLICK│10 (2019)│Seite 14

increased endurance during a game, (2) increased well-being, (3) increased concentration, (4)
comfortable transport of the clubs, (5) owning a modern device, and (6) adequate value for
money. In line with that, we constructed a new measurement instrument consisting of six
items reflecting the six advantages on a 7-point Likert-scale.

Knowledge. Rogers (2003) distinguishes three types of knowledge that are relevant in the
knowledge stage: awareness-knowledge, how-to knowledge, and principles knowledge. In our
study, we wanted to grasp the degree of individual knowledge about the focal innovation and
thus, we decided to use a measure of awareness-knowledge. The reflective scale developed
by Smith and Park (1992) suited this purpose. It is easily adaptable to the product category at
hand and consists of four items. Here, subjects indicate their level of (latent) knowledge about
the product class in different dimensions by their answers (sample item: ‘I can identify
differences in the quality of electric golf trolleys from different manufacturers’).

Social Connectedness. In order to capture a person’s connectedness in her social network, we
used the network metric “Eigenvector Centrality” for three reasons: (1) Eigenvector centrality
is based on the theoretical concept of centrality, which captures the “importance” or “social
capital" of an actor – a person with a high centrality score also has a high potential to come
into contact with the innovation; (2) Within the class of centrality measures, eigenvector
centrality uniquely captures an actor’s position in a network based on all connections, not just
direct contacts; (3) Eigenvector centrality has been shown to correctly capture the “flow” of
the diffusion of an innovation that is replicated between actors and follows random paths
along the network, as described by Borgatti (2005).

Borgatti (2005) concludes that “the eigenvector centrality measure is ideally suited for
influence type processes”. In our study, eigenvector centrality is meant to capture purely the
network position, i.e. a positional advantage reflecting the number and diversity of ties, and
not capturing effects of a weighted network that would confound this distinction. In this way,
we model the dichotomous situation that either a member meets for a round of golf with an
adopter and learns about the innovation this way, or she does not. Remember that the kind of
information relevant in the first stage of the adoption process does not represent a complex
type of knowledge, but rather a simple piece of information, i.e. the pure awareness of the
innovation. Accordingly, we will use a dichotomized network structure and the classic
eigenvector centrality according to Bonacich (1987) in order to capture a subject’s social
connectedness.

Product Exposure. Since connectedness does not reflect the occurrence of any informal talks
and their respective contents on and off the golf course, one could argue that eigenvector
centrality does not entirely capture the dynamic spread of the innovation or the knowledge
about it. Thus, we also capture the extent of exposure to the innovation. In order to
operationalize the concept of exposure, we use subjects’ self-reported portion of their social
circle of friends, golfers, and acquaintances that have already adopted the innovation with a
single item measure on a 7-point Likert-scale. By this, we account for the fact that golfers do
not only play and interact with other golfers in their own club. There are also guests in the club
who are frequently part of a group playing a round of golf without previously knowing each
other. If one of these guests already is an adopter this is almost certain to be mentioned during
the interaction due to the high visibility of the innovation. While this contact was made by pure
chance and cannot be considered part of the focal node’s personal network, it still represents
at least an observation of the innovation.
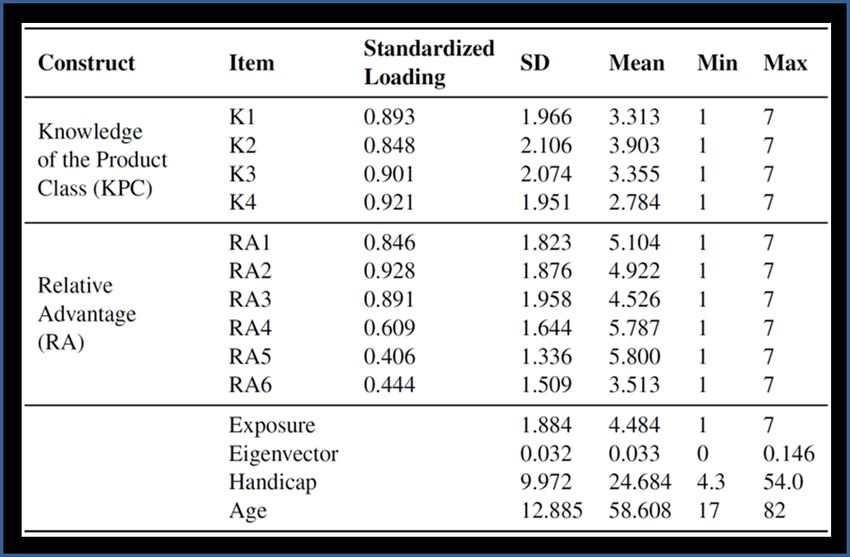
Social Connectedness and Product Exposure in the Innovation Decision Process

 RESULTS
4.1 Sample Characteristics and Possible Biases
The final sample (N=158) consists of 52 (32.91%) female and 106 (67.09%) male respondents
with an average age of 58.61 (SD=12.884). The youngest participant is 17 and the oldest
participant is 82 years old. The handicap of the sample ranges from 4.3 to 54 (M=24.684,
SD=9.972). 60 (37.97%) participants owned the innovation at the time of data collection and
98 (62.03%) did not. Table 1 summarizes the descriptive results and factor loadings for our
model variables and controls.

 Table 1: Descriptive Statistics and Factor Loadings

In order to assess whether the sample is representative, three variables were used that were
present both in the survey data and as node attributes in the network data: gender, handicap,
and age. Gender was tested using Pearson’s chi-square test. The distribution of those subjects
that could be matched and remained in the final sample was tested against the distribution of
those subjects that could not be matched. The chi-square value of 0.826 (p=0.364) indicates
that there is no significant deviation between the two groups. Handicap was tested with a one-
sample T-test. The sample mean (24.68) was tested against the handicap values of the entire
club. A T-value of -1.021 and no significant p-values for any of the alternative hypotheses
suggests that the mean handicap of the sample is sufficiently representative as well. Age was
tested in the same way. A one-sample T-test revealed a significant deviation of the sample
against the mean of the entire club’s population (54.34). The sample’s mean age was higher
(58.61). We attribute this deviation to the fact that the focal innovation of this study is
obviously more attracting to older golf players. Several T-tests were also conducted to test if
there are any differences in central model variables between responses that were obtained in
the online and the offline version of the survey. As this was not the case, we can conclude that
the two versions of the survey did not introduce any biases.
NORDBLICK│10 (2019)│Seite 16

4.2 Model Estimation
4.2.1 Analytic Technique

In order to test our hypothesized conceptual model, we choose Covariance-based Structural
Equation Modeling (CBSEM) over Partial Least Squares-SEM due to its major applications in
testing and confirming theoretical model relationships. We employed the WLSMV estimator
(Muthén and Muthén, 2010) that shows good statistical properties in terms of parameter
estimation and model fit even in small samples. Since the assumption of normality cannot be
met for each variable in the present study, this estimator seems to be the best choice for the
dataset and model at hand.

4.2.2 Measurement Model

In order to assess the appropriateness of the model measures, Cronbach’s and construct
reliability (C.R.) are calculated. For construct reliability, the formula in Gefen et al. (2000) was
used. Both indicators exceed the recommended minimum score of 0.7 (Gefen et al., 2000) and
are therefore concluded to be appropriately reliable. Convergent validity is assessed using the
average variance extracted (AVE). According to Foster and Cone (1995) it should be greater
than 0.5. This is the case, indicating that the variance shared by a latent construct is greater
than its error variance. Discriminant validity is shown by comparing AVE to the squared inter-
construct correlation. Since the squared correlation between the two constructs is 0.255 and
does not exceed the AVE of either construct it is ensured that the constructs do not relate to
each other (Fornell and Larcker, 1981). Table 2 summarizes the measures.

 Table 2: Reliability and Validity Tests

In line with the recommendation by Hair et al. (2009), loadings of indicator variables were
examined. For Knowledge, standardized loadings of K1 to K4 range between 0.848 and 0.921.
For Relative Advantage, all indicator loadings exceeded the recommended cutoff-value of 0.5
except for RA5 and RA6. Hair et al. (2009) suggest that indicator variables with loadings below
this threshold should be considered for deletion. In this case it was decided to retain them to
enhance construct validity.

4.2.3 Model Fit

In order to examine the fit of our proposed model, we draw on several established fit indices.
The CFI was 0.983, thus exceeding the recommended minimum of 0.9 (Hu and Bentler, 1999;
Hair et al., 2009). This indicates that the model has a significant advantage over the compared
model that assumes complete independence of all observed variables. Further, RMSEA of the
nested models ranged from 0.064 to 0.073 indicating a “reasonable error of approximation”
according to Kline (2004). The results of the chi-square difference tests were then pooled in
the usual way (as suggested by Rubin 1987) and revealed a test statistic of 3.139 (p-value =
.168). Therefore, it can be concluded that the overall model is not incorrect given a confidence
level of 0.05. Further, we calculated a TLI of 0.979 which also exceeds the minimum of 0.9
Social Connectedness and Product Exposure in the Innovation Decision Process

(Marsh et al., 2004). In addition, we examined R² in the context of SEMs that include
dichotomous dependent variables (McKelvey and Zavoina, 1975). Adoption has an R² estimate
of .736, Knowledge has an R² of .177, and Relative Advantage has an R² of .256.

4.2.4 Structural Model

To test our hypotheses, we examine the direction, magnitude, and significance of the
standardized path coefficients in the model. According to Muthén and Muthén (2010), we
calculated the effect sizes as a function of one standard deviation change in the covariate.
Figure 2 summarizes the standardized estimation results.

 Figure 2: Results for the Structural Model

Looking at the results for connectedness, we find a significant effect of Connectedness on
Knowledge of 0.488 (p
NORDBLICK│10 (2019)│Seite 18

only slightly as eigenvector centrality increases. Notably, the figure illustrates that knowledge
of the product class does not differ significantly between 1) individuals with high levels of both
eigenvector centrality and exposure, 2) individuals with high exposure and low eigenvector
centrality, and 3) individuals with low exposure and high eigenvector centrality.

 Figure 3: Interaction Effect of Social Connectedness and Exposure on Knowledge of the Product Class

Further, a moderate effect of 0.456 (p
Social Connectedness and Product Exposure in the Innovation Decision Process

 CONCLUSION
The current study observed the diffusion of an innovative piece of golf equipment that has not
completely diffused yet. Several hypotheses were developed to get an understanding of the
specific mechanisms governing the adoption of the innovation when the adoption is closely
related to and affected by a social network.

The main conclusion from the study is that the adoption of an innovation can be significantly
explained by how individual actors are embedded in their social network. This highlights the
role of social connectedness and product exposure within social networks. Thus, our study
strengthens and extends findings by Valente (1996) and Centola (2010) by specifically
connecting network variables to the innovation decision process. On the one hand,
connectedness within a social network reflects an individual’s structural interest to adopt an
innovation. On the other hand, product exposure reflects the likelihood of coming into contact
with the innovation. Both drivers are significantly related to the accumulation of knowledge
which in turn helps to form a realistic and adequate perception of the relative advantage of the
innovation. Both of these constructs – knowledge and perceived relative advantage – finally
drive the actual adoption decision.

Literature distinguishes between two types of social influence that play a major role in
adoption decisions: homophily and contagion. Homophily refers to similar attributes of
connected nodes or similar behavior that can be attributed to the nodes being similar in some
respect (e.g. similar preferences). In this sense, the adoption of a behavior or an innovation is
due to mere imitation of other peers. Contagion refers to actual influence occurring between
peers. Aral et al. (2009) makes this distinction very clear and argues that the two phenomena
have often been confused in previous studies. He further highlights that “pure” homophily (in
the strict sense) is the reason for 50% of the adoptions explained by network phenomena.
Since one limitation of the present study is that the time of adoption could not be measured
for all nodes in the network, the effect of exposure on the network has to be interpreted against
this background. The findings of Aral et al. (2009) suggest that much of the effect that is
attributed to exposure is due to homophily, i.e. golfers that play together also have similar
preferences and this is the reason they adopt.

By investigating the mediating effect of an individual’s knowledge of the product class, we
were able to shed light on the role that the social network plays via the accumulation of
knowledge about an innovation on the adoption decision. As hypothesized, how an actor is
embedded in her social network as well as her exposure to the innovation predicts how well
she is informed about the product class. This extends previous findings by Valente (1996) and
Iyengar et al. (2008). Instead of relating structural properties of nodes in a network with a focal
behavior, we also investigated the proposed mechanisms that bring about the decision to
adopt an innovation. There was also evidence for the hypothesized negative interaction effect
of connectedness and exposure on knowledge of the product class. This provides support for
a substitution effect of these two channels of acquiring knowledge. When both coincide – a
highly connected individual who is largely exposed to the innovation –, there is no additional
gain in knowledge. This also means that actors with substandard access to information due
to low centrality and low exposure are running a risk of not accumulating enough knowledge
to grasp the innovation’s benefits.

5.1 Managerial Implications
Our results entail several implications for management practice. First, manufacturers looking
to promote an innovation through a social network should employ measures that effectively
NORDBLICK│10 (2019)│Seite 20

reach large parts of the social network that is relevant for the innovation’s diffusion. This can
be done by increasing the visibility of the innovation within the network. Depending on the type
of product, this can pertain to the design of the product or promotional activities. This will
foster diffusion of knowledge about the product through social channels and drive adoptions.

Second, since a consumer’s acquired knowledge of the product significantly drives her
perception of the innovation’s relative advantage, it is vital that manufacturers and marketers
ensure that the relative advantage is clearly understood. Especially with an innovation that is
heavily promoted between consumers in their relevant social networks, marketers need to
keep in mind that what is communicated about an innovation is beyond their control.
Consumers will expose each other to the innovation and this communication is the seed for
forming perceptions about the relative advantage. If the key benefits and USP of an innovation
in relation to a previous product are clearly and instantly understood, it will help to spread
knowledge about it and promote favorable attitudes toward it.

Third, we found that consumers with higher levels of connectedness tend to adopt an
innovation earlier. Marketers could make use of this principle by trying to identify and target
highly central individuals, knowing about their higher interest to be among the earlier adopters.
This would also impact subsequent waves of consumers becoming exposed to the innovation.

5.2 Limitations and Future Research
As with any study, the present investigation has its limits. The first concerns the
generalizability of the results to other consumers and product innovations. The product in this
study is expensive enough to not be regarded as a purchase that is made on impulse (models
start at approximately 300€) and the population to which the product is relevant represents a
relatively broad range in age groups. However, since the product category is specific to the
sport of golf, it is possible that the observed effects are also specific to a certain demographic.
Thus, studies investigating more product categories could enhance external validity.

Further, our model may be subject to reversed causality. Due to no information on the time of
adoption and preceding variables, it is possible that the adopters have built their knowledge
and perceptions of relative advantage after adopting the e-trolley.

Another drawback relates to potential advertising and promotional effects that the research
design did not account for. As the market matures and more manufacturers compete for
customers it is possible that next to information flows in the social network, more and more
advertisements impact adoption and diffusion. Thus, a longitudinal study that records the
adoption at different points in time as well as marketing activities by manufacturers could
resolve these questions.

 REFERENCES
Agarwal, R. and Prasad, J. (1998). The antecedents and consequents of user perceptions in
 information technology adoption. Decision Support Systems, 22(1):15–29.
Angst, C. M., Agarwal, R., Sambamurthy, V., and Kelley, K. (2010). Social Contagion and Information
 Technology Diffusion: The Adoption of Electronic Medical Records in U.S. Hospitals.
 Management Science, 56(8):1219–1241.
Aral, S., Muchnik, L., and Sundararajan, A. (2009). Distinguishing influence-based contagion from
 homophily-driven diffusion in dynamic networks. Proceedings of the National Academy of
 Sciences of the United States of America, 106(51):21544–9.
Aral, S. and Walker, D. (2011). Creating Social Contagion Through Viral Product Design: A Randomized
 Trial of Peer Influence in Networks. Management Science, 57(9):1623–1639.
Social Connectedness and Product Exposure in the Innovation Decision Process

Back, K. (1950). Briefer Studies and Annotations: The Methodology of Studying Rumor Transmission.
 Human Relations, 3(3):307–312.
Barrot, C. and Albers, S. (2008). Did They Tell Their Friends? - Using Social Network Analysis to Detect
 Contagion Processes. Media and Marketing, 49:1–39.
Bonacich, P. (1987). Power and Centrality: A Family of Measures. American Journal of Sociology,
 92(5):1170.
Borgatti, S. P. (2005). Centrality and network flow. Social Networks, 27(1):55–71.
Borgatti, S. P., Everett, M. G., and Freeman, L. C. (2002). Ucinet for Windows: Software for Social
 Network Analysis.
Bourdieu, P. (1986). The forms of capital. In Richardson, J., editor, Handbook of Theory and Research
 for the Sociology of Education. Greenwood, Westport, CT.
Brass, D. (1984). Being in the Right Place: A Structural Analysis of Individual Influence in an
 Organization. Administrative Science Quarterly, 29:518–539.
Burt, R. (1993). The social structure of competition. In Swedberg, R., editor, Explorations in economic
 sociology, chapter 3. Russell Sage Foundation.
Burt, R. (2004). Structural Holes and Good Ideas. American Journal of Sociology, 110(2):349–399.
Burt, R. S. (1980a). Actor Interests in a Social Topology: Foundation for a Structural Theory of Action.
 Sociological Inquiry, 50(2):107–132.
Burt, R. S. (1980b). Innovation as a structural interest: rethinking the impact of network position on
 innovation adoption. Social Networks, 2(4):327–355.
Carley, K. M., Pfeffer, J., Reminga, J., Storrick, J., and Columbus, D. (2013). ORA User’s Guide. Institute
 for Software Research, School of Computer Science, Carnegie Mellon University, Pittsburgh,
 PA, 2013 edition.
Centola, D. (2010). The spread of behavior in an online social network experiment. Science,
 329(5996):1194–7.
Choudhury, V. and Galletta, D. (2015). Exploiting the internet: Strategies and frameworks for a small
 business. Journal of Small Business Strategy.
Christakis, N. and Fowler, J. (2007). The spread of obesity in a large social network over 32 years. New
 England journal of medicine.
Coleman, J., Katz, E., and Menzel, H. (1957). The diffusion of an innovation among physicians.
 Sociometry, 20:253–270.
Coleman, J. S., Katz, E., Menzel, H., and Columbia University Bureau of Applied Social Research (1966).
 Medical innovation; a diffusion study. Bobbs-Merrill Co.
Daft R.H., R. L. (1986). Organizational Information Requirements, Media Richness, and Structural
 Design. Management Science, 32, 5, pages 554–571.
Dodd, S. C. (1955). Diffusion is Predictable: Testing Probability Models for Laws of Interaction.
 American Sociological Review, 20(4):392.
Dupagne, M. (1999). Exploring the Characteristics of Potential High-Definition Television Adopters.
 Journal of Media Economics, 12(1):35–50.
Durrington, V. a., Repman, J., and Valente, T. W. (2000). Using Social Network Analysis To Examine the
 Time of Adoption of Computer-Related Services among University Faculty. Journal of
 Research on Computing in Education, 33:16–27.
Erdös, P. and Rényi, A. (1960). On the evolution of random graphs. Publications of the Mathematical
 Institute of the Hungarian Academy of Sciences, 5(1):17–61.
Festinger, L., Back, K. W., and Schachter, S. (1950). Social pressures in informal groups; a study of
 human factors in housing. Stanford University Press, 1 edition.
Filzmoser, P., Garrett, R. G., and Reimann, C. (2005). Multivariate outlier detection in exploration
 geochemistry. Computers and Geosciences, 31(5):579–587.
Sie können auch lesen