HYDROGRAPHISCHE NACHRICHTEN - HN 107 - Deutsche Hydrographische Gesellschaft
←
→
Transkription von Seiteninhalten
Wenn Ihr Browser die Seite nicht korrekt rendert, bitte, lesen Sie den Inhalt der Seite unten
HYDROGRAPHISCHE
NACHRICHTEN
Fachzeitschrift für Hydrographie und Geoinformation   06/2017   HN 107

Where have you been, Polarstern?

Thomas Dehling:
»Hydrographie ist so aufwendig,
sie darf nicht nur für einen Zweck da sein«
Ocean engineering
  Consulting

                                             from space into depth
                                    Realise your projects in cooperation with our hydrographic services

                                                             Our hydrography engineers at MBT are happy to
                                                             develop systems tailored exactly to your needs and to
                                                             provide professional advice and support for setting up
                                                             your systems and training your staff.
                                                             Representing MacArtney’s German subsidiary,
                                                             MBT GmbH benefits from being part of the MacArtney
                                                             Group and enjoys unlimited access to cutting-edge
                                                             engineering competences and advanced facilities.
               CTDs & SVPs

                                             Acoustic
                                             sensors

                                                                Software

                             Auxiliary
                             sensors

                                                                Integration

Part of

Denmark Norway United Kingdom USA   Canada   France   Netherlands   Germany      Australia     Singapore      China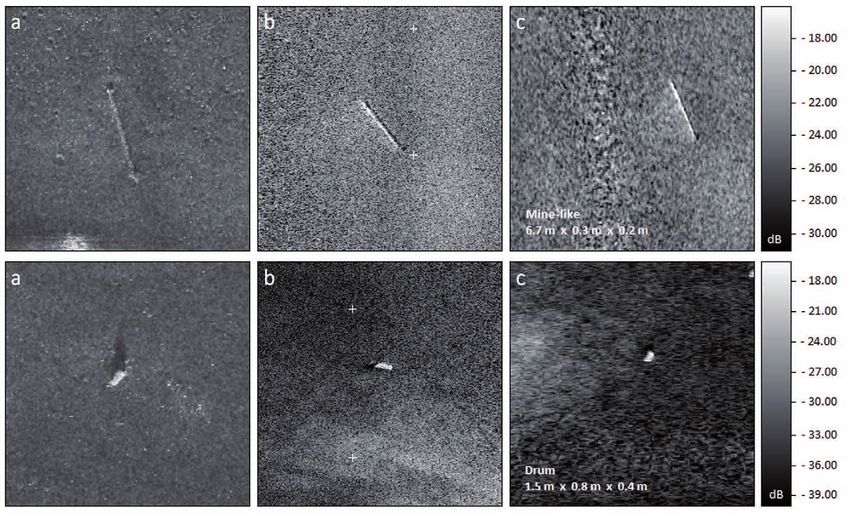
Vorwort
Liebe Leserinnen und Leser,
bereits zum vierten Mal wird der DHyG Student sondern auch international wahrgenommen wer-
Excellence Award vergeben. Mit diesem Preis zeich- den wollen.
net die DHyG jedes Jahr einen Studienabsolventen Mich stimmt diese Entwicklung dennoch nach-
aus, der sich in einer herausragenden Studienar- denklich. Man spricht von einem Domänenver-
beit mit einem beliebigen Thema der Hydrogra- lust, wenn die Fähigkeit schwindet, sich in seiner
phie auseinandergesetzt hat. Muttersprache ohne fremde Wörter adäquat
In diesem Jahr gab es drei Nominierungen: Dilip ausdrücken zu können. Sprachwissenschaftler
Adhikari, Tina Kunde und Corinne Melchior wur- befürchten, dass die Kommunikationsfähigkeit in
den für den Preis vorgeschlagen. Alle drei Nomi- der eigenen Sprache auf allen Ebenen eines Wis-
nierten haben ihre Masterarbeit an der HCU sensgebiets nachlässt, weil niemand mehr die
in Hamburg geschrieben. fachsprachliche Kommunikation in der eige-
Die Jury hat entschieden, Tina Kunde für nen Sprache angemessen weiterentwickelt. Lars Schiller
ihre Arbeit über »Precise detection of dumped Anders gesagt: Weil niemand sich mehr die
ammunition in shallow coastal waters using Mühe macht, die englischen Fachwörter zu
snippet backscatter information« auszuzeich- übersetzen und auch deutsche Fachtexte zu
nen. schreiben.
Bei Fächerecholoten können die Rohda- seit Sosehr ich es begrüße, dass die Hydro-
ten mit den Rückstreueigenschaften auf- 2014 graphischen Nachrichten internationaler
gezeichnet werden – für jeden beam und werden, ich freue mich nach wie vor über
für jeden ping. Die aufzeichnete Zeitserie jeden deutschsprachigen Beitrag von Ih-
für jeden beam wird snippet genannt. nen.
Mag sein, dass es für diesen noch recht neuen Ein positives Beispiel, wie man sich im Deut-
Begriff bereits ein deutsches Wort gibt. In diesem schen klar und verständlich ausdrückt, auch wenn
Heft steht es nicht. Denn der Fachbeitrag über die es um fachsprachliche Themen geht, ist übrigens
snippet backscatter information ist auf Englisch ver- das Wissenschaftsgespräch mit Thomas Dehling,
fasst (siehe Seite 10). das Sie ab Seite 32 lesen können.
Auch die anderen vier Fachbeiträge in dieser In diesem Sinne wünsche ich Ihnen eine interes-
HN-Ausgabe sind in englischer Sprache geschrie- sante zweisprachige Lektüre.
ben. Eine bemerkenswerte Entwicklung, die dar-
auf hindeutet, dass die Autoren nicht mehr nur die Ihr
Leserschaft in Deutschland ansprechen möchten,
Hydrographische Nachrichten Schriftführer: Hinweise für Autoren:
HN 107 – Juni 2017 Lars Schiller Der eingereichte Fachaufsatz muss in dieser Form
E-Mail: lars.schiller@dhyg.de noch unveröffentlicht sein. Reichen Sie Ihren Text
Fachzeitschrift für Hydrographie bitte unformatiert und ohne eingebundene Grafi-
und Geoinformation Redaktion: ken ein. Die beigefügten Grafiken sollten eine Auf-
Offizielles Organ der Deutschen Hydrographischen Stefan Steinmetz, Dipl.-Ing. lösung von 300 dpi haben. In der Textdatei sollte
Gesellschaft – DHyG Vasiliki Kekridou, M.Sc. die automatische Silbentrennung ausgeschaltet
Peter Dugge, Dipl.-Ing. sein; auch manuelle Trennungen dürfen nicht ent-
Herausgeber: halten sein.
Deutsche Hydrographische Gesellschaft e. V. Wissenschaftlicher Beirat: Über die Annahme des Manuskripts und den Zeit-
Horst Hecht, Dipl.-Met. punkt des Erscheinens entscheidet die Redaktion.
c/o Sabine Müller Dr. Jens Schneider von Deimling Die Verfasser erklären sich mit einer nicht sinnent-
Innomar Technologie GmbH stellenden redaktionellen Bearbeitung ihres Manu-
Schutower Ringstraße 4 Anzeigen: skripts einverstanden.
18069 Rostock Ganze Seite (210 mm × 297 mm): 300 Euro; Die mit vollständigen Namen gekennzeichneten
auf dem Umschlag, innen: 400 Euro, Beiträge geben nicht unbedingt die Meinung der
Internet: www.dhyg.de auf dem Umschlag, außen: 600 Euro. Redaktion wieder.
E-Mail: dhyg@innomar.com Halbe Seite (210 mm × 148 mm): 200 Euro.
Telefon: (0381) 44079-0 Kontakt: Stefan Steinmetz, E-Mail: sts@eiva.com Die HN erscheinen drei Mal im Jahr, i.d.R. im Februar,
Juni und Oktober. Für Mitglieder der DHyG ist der
ISSN: 1866-9204 © 2017 Bezug der HN im Mitgliedsbeitrag enthalten.
HN 107 — 06/2017 3
Sonic 2020                         Sonic 2022

       Sonic 2024                         Sonic 2026

     Beispiellose Leistungsfähigkeit mit 256 Beams bei 160° Öffnungs-
     winkel (einstellbar) und einer Pingrate von 60 Hz
     Breitbandtechnologie mit Frequenzwahl in Echtzeit zwischen
     200 bis 400 kHz sowie 700 kHz optional
     Dynamisch fokussierende Beams mit einem max. Öffnungswinkel
     von 0,5° x 1° bei 400 kHz bzw. 0,3° x 0,6° bei 700 kHz
     Höchste Auflösung bei einer Bandbreite von 60 kHz, bzw. 1,25 cm
     Entfernungsauflösung
     Kombinierbar mit externen Sensoren aller gängigen Hersteller
     Flexibler Einsatz als vorausschauendes Sonar und der Fächer ist
     vertikal um bis zu 30° schwenkbar
     Zusätzliche Funktionen wie True Backscatter und Daten der
     Wassersäule
     MultiSpectral Modus™, der es den R2Sonic-Systemen ermöglicht,
     Backscatter Daten mehrerer Frequenzen in einem einzigen Durch-
     lauf zu sammeln

     Nautilus Marine Service GmbH ist der kompetente Partner in
     Deutschland für den Vertrieb von R2Sonic Fächerecholotsystemen.
     Darüber hinaus werden alle relevanten Dienstleistungen wie Instal-
     lation und Wartung kompletter hydrographischer Vermessungssys-
     teme sowie Schulung und Support für R2Sonic Kunden angeboten.
     R2Sonic ist ein amerikanischer Hersteller von modernen Fächerecho-
     loten in Breitbandtechnologie. Seit Gründung des Unternehmens
     im Jahr 2009 wurden weltweit bereits mehr als 800 Fächerlote aus-
     geliefert und demonstrieren so eindrucksvoll die außergewöhnliche
     Qualität und enorme Zuverlässigkeit dieser Vermessungssysteme.

Nautilus Marine Service GmbH · Alter Postweg 24 · D-21614 Buxtehude · Phone: +49 (0)4161-866 25-0 · info@nautilus-gmbh.com
R2Sonic, LLC · 5307 Industrial Oaks Blvd. · Suite 120 · Austin, Texas 78735 · U.S.A. · Phone: +1-512-891-0000 · r2sales@r2sonic.com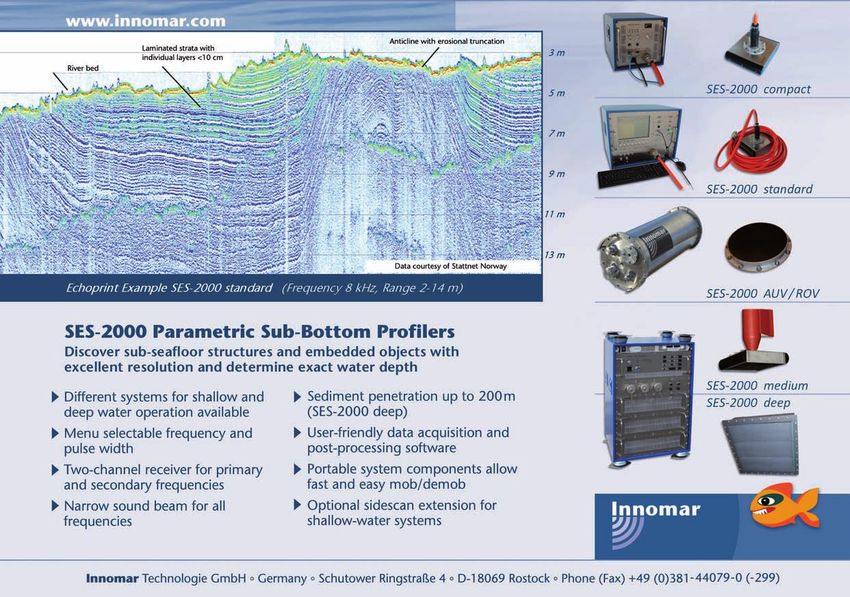
Inhaltsverzeichnis

HN 107
                                                                        Aus dem Inhalt
                   Track record
                    6 Where have you been, Polarstern?
                       by Regina Usbeck, Sebastian RöSSler and Peter Gerchow

                   Ammunition detection
                   10 High-frequency snippet backscatter information
                      An article by Tina Kunde

                   Seafloor classification
                    15 Geological interpretation of bathymetric and backscatter data
                       An article by Corinne Melchior

                   Glacial history
                   20 Reconstruction of glacial history of the area north of Svalbard/Spitsbergen
                       An article by Dilip Adhikari

                   Side-scan sonar comparison
                    27 Technical evaluation of side-scan sonars
                       An article by Andy Culbreath and Tanja Dufek

                   Wissenschaftsgespräch
                   32 »Hydrographie ist so aufwendig, sie darf nicht nur für einen Zweck da sein«
                       Thomas Dehling im Wissenschaftsgespräch

                   Nachruf
                   40 Ein großartiger Physiker
                      Im Februar starb Dr. Siegfried Fahrentholz
                      Von Brigitte Fahrentholz-Wilkening und Julia Fahrentholz-Starrost

                   IHO Assembly
                    42 Vollversammlung der IHO in Monaco
                       Mathias Jonas zum Generalsekretär gewählt
                       Ein Bericht von Thomas Dehling

                   IHO Assembly
                    44 »Hydrographers as surveyors and describers of all physics of the seas«
                    	The inaugural speech by Mathias Jonas

                   10. Nationale Maritime Konferenz
                    45 Bekenntnis zur maritimen Branche
                        Ein Beitrag der Schiff&Hafen-Redaktion

                                   Die nächste Ausgabe der Hydrographischen Nachrichten wird im Oktober 2017 erscheinen.
                                   Redaktions- und Anzeigenschluss: 15. September 2017

HN 107 — 06/2017                                                                                                       5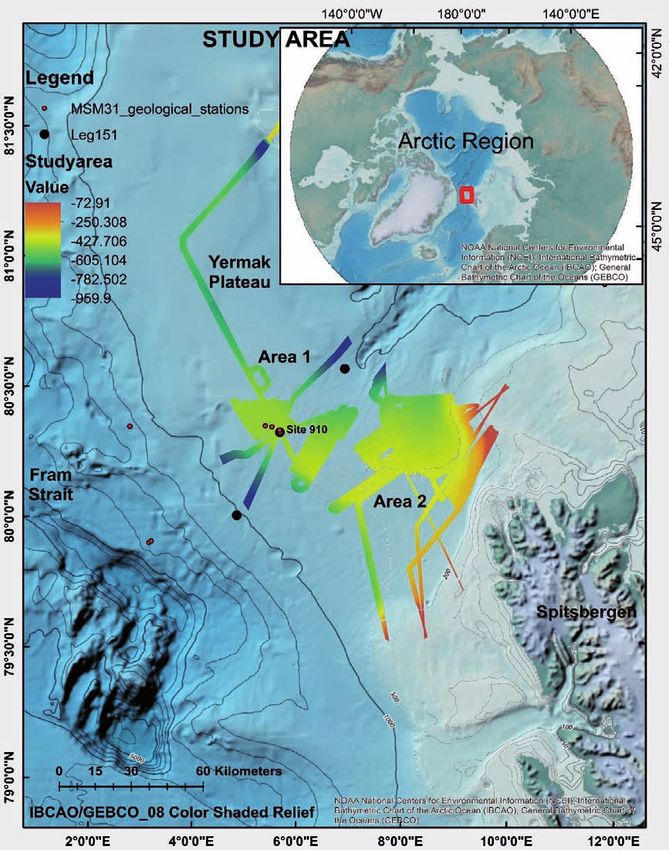
Track record
Where have you been, Polarstern?
The most likely position for each moment
in a long traveller’s life
An article by Regina Usbeck, Sebastian RöSSler and Peter Gerchow
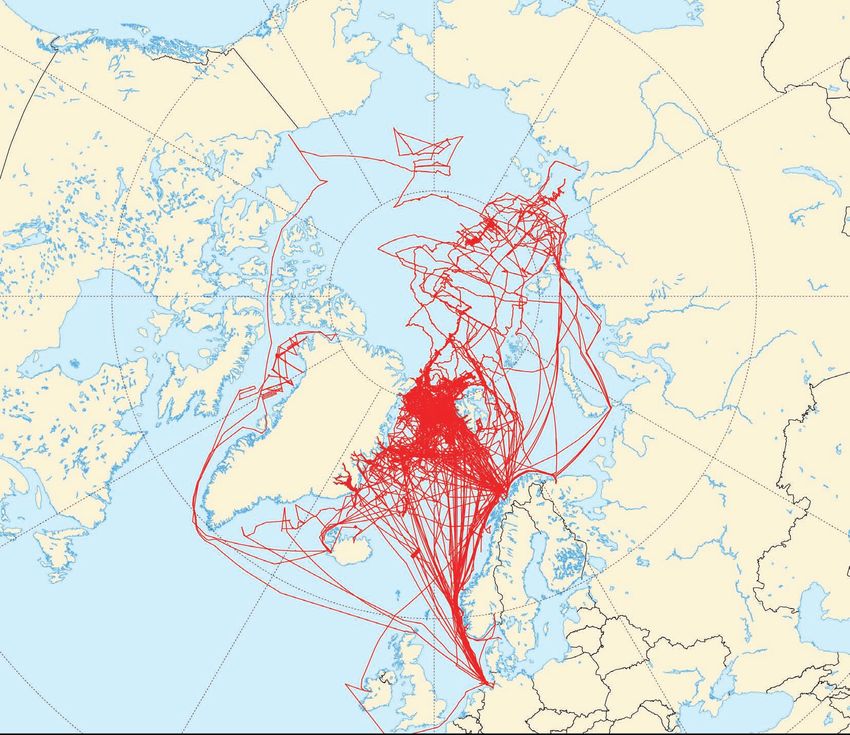
We have investigated the quality of position data of one of the longest continuously
documented history of an individual research vessel: The impressing track record of
the German icebreaking research vessel Polarstern started the 9th of December 1982
and continues up to date. The ship has travelled 1 639 449 nautical miles (until the
end of 2016) during the last 35 years and yields thus a huge amount of global position
data gathered using different systems. The data quality and frequency was continu-
ously updated and improved. Here, we present an approach to represent the whole
track record at respec-
tive maximum achiev- Polarstern | track record | positioning | antenna position | motion data
able accuracy in a uni-
fied format. This data 1 Introduction about 25 years and in the earlier days of satellite
set, the so-called ›Mas- Today, the real-time positioning of almost every navigation, the data quality was much less ac-
ter Track‹ represents moving platform is a matter of course. Everyone curate. During pre-GPS times, systems such as
the most likely position is expecting the route planner’s positions to be ARGOS or Transit allowed a position fix every now
during all of Polarstern’s ›true‹. GPS-measurements are nowadays embed- and then only during the respective overflights of
voyages. ded not only in statutory systems (such as AIS), but the satellites.
in almost any system moving around – from air Much effort has been spent to compile the
planes to pet collars. Apart from scientific site in- whole track record of Polarstern position-wise
vestigations and/or hydrographic measurements, because not only the positioning methods have
one seldom thinks about reliability and accuracy changed during time, but also the logging sys-
of this all-times available information. Common er- tems. The first electronic navigation and data ac-
ror correction and filter algorithms optimising the quisition system on board Polarstern, INDAS, was
Authors
Dr. Regina Usbeck is high-frequency data are well engineered and usu- in operation from 1982 to 1993. The continuous re-
Managing Director of FIELAX ally sufficiently accurate. cording of navigation position data finally started
in Bremerhaven. However, from time to time, discrepancies may during the cruise ARK-II/2 in 1984. Since 2000, not
Dr. Sebastian Rößler works at occur from various error sources, such as wrong only navigational and individual antenna position
FIELAX in Bremerhaven.
Peter Gerchow is responsi- reference ellipsoids or projections during search of data is saved, but also motion data from the ves-
ble for the management of reported objects at the seafloor, changed configu- sels inertial motion unit, thus allowing correction
raw data at Alfred Wegener rations of reference points, reduced availability of for pitch/roll and heading.
Institute (AWI) in Bremerhaven. satellites, reduced reception due to shadowing of
usbeck@fielax.de the antenna, misguiding through erroneous INS- 2 History of Polarstern position data
roessler@fielax.de corrections, etc. From 01.12.1982, the satellite navigation system
peter.gerchow@awi.de Of course, for high-precision hydrographic Transit (also known as NNSS or NAVSAT) was used
measurements (bathymetry and sub-bottom pro- to determine the position of the vessel. Getting
filing) exact locations as well as correct motion satellite fix GPS positions was only possible dur-
information (pitch, roll and yaw) are obligatory ing satellite passes by using the Doppler shift and
during the survey and on research vessels, it is es- the accuracy of the position was between 300 and
sential to know the exact location of taken samples 1000 metres. Between the overflights, the posi-
or the exposure point of a certain device. During tions were extrapolated using course and speed
multidisciplinary cruises, the positions for different (measured by gyro and Doppler log). The longer
measurements on the same research vessel may the satellite fix was dated back, the worse the posi-
have been logged by different people using differ- tion determination is. That means that for devices
ent systems with different reference points and/or that had to be recovered again (like moorings,
ellipsoids. Erroneous data may have one or several etc.), only the times near satellite fix points could
sources of the above combined making it difficult be used. All other positions were too inaccurate.
to find the ›true‹ or even ›most probable‹ location The continuous storage of these data started
of a certain measurement. on 13.06.1984. Fig. 1 nicely shows the jumps in the
Apparently, historic data is more affected by track caused by misrouted position extrapolation
these problems than positions measured today, between satellite position fixes.
because some systems (such as differential or From 06.07.1989, the accuracy of the position-
even raw GPS/GLONASS) are only available for ing was improved a lot. Actual GPS measure-
6 Hydrographische Nachrichten
Track record

ments (T-Set) were routed to the software VENUS
which extrapolated the positions by using the
actual set and drift values between the satellite
fixes. The combination with the GPS data lead
to a much higher accuracy between the satellite
passes. The jumps between the positions when a
new satellite fix is taken almost completely disap-
peared.
   Together with a new generation of computers,
the data acquisition system PODEV was installed
on Polarstern during 1992 together with a new
GPS-system. This system consisted of three two-
frequency GPS receivers (Ashtech/COMPASS)
which were installed as a triangle with three metre
baselines. However, since the navigation system           Fig. 1: Position data from ANT-III/2 (15.11. to 09.12.1984). Each jump corresponds to a Transit
                                                          satellite fix. Due to the high latitude and corresponding high availability of Transit overflights,
did not support GPS data, this information was            new fixes were available every 40 to 90 minutes
used to further improve the set and drift measure-
ments and thus, enhance position prediction be-
tween the satellite fixes.
   In May 1993, the INDAS system on board of RV
Polarstern was replaced by a new navigation sys-
tem ANP2000 which was capable to process the
information from the three GPS receivers. This
marks the start of true GPS navigation. Also, a new
data acquisition system (PODEV) was installed
independently of the navigation system and the
original GPS data as well as the navigation data
were logged continuously. In October 1994, an in-
crease of position accuracy was achieved by using
Wide Area Differential GPS (WADGPS) corrections
from Skyfix. However, the position data and sub-
sequent filtering through the navigation system
still could be misrouted as can be seen in Fig. 2. In
this example, the ship approaches the station from
North-East and departs in the same direction after
station completion. The red dots (original Ashtech        Fig. 2: Position data during ANT-XII/3 (05.01. to 20.03.1995) from the original navigation
GPS positions) are not as smooth and continuous           GPS receiver Ashtech (red dots) and filtered positions from the ship’s navigation system
but describe the factual track correctly. The filtered    ANP2000 (green dots) at a position with station work, i.e. no significant movement. The ship
                                                          approaches the station from North-East, idles at position and departs towards North-East.
positions (green dots) are nicely smoothed out            Obviously, the filter algorithm is not suited for very small movements and velocities
and continuous but during station time, the filter
algorithms obviously failed and produced some
›ghost tracks‹ far off the factual route.
   This setup was used until September 2000
when PODEV was replaced by the real-time data
acquisition system PODAS/DSHIP. Additionally, an
improvement of positioning occurred due to the
switch-off of the Selective Availability (SA) on May
the 2nd 2000.
   In the fall of 2000, an inertial platform, MINS, was
installed on board Polarstern which allowed a bet-
ter prediction and enhancement of the position
data. However, as the MINS is a commercial system
optimised for lower latitudes, some new artefacts
occurred in the data. The positions have been fil-
tered by the MINS in UTM coordinates which re-
sulted in erroneous predictions, especially in high
latitudes. Fig. 3 shows the obvious misguiding of
the filtered positions near the North Pole during
ARK-XVII/2.                                               Fig. 3: GPS and filtered MINS positions near the North Pole during ARK-XVII/2 (31.07. to
   As a big improvement, the new system PODAS/            07.10.2001). The original GPS position (Trimble, red dots) is of high quality and shows the
                                                          correct route within GPS accuracy. The filtered position (MINS, green dots) are obviously
DSHIP allowed a time synchronous acquisition              misrouted and erroneous
and storage of all GPS receivers on board of RV

HN 107 — 06/2017                                                                                                                                                7
Track record

 Fig. 4: Processing workflow of
   the Master Track generation

References
Douglas, David H.; Thomas K. Peucker
   (1973): Algorithms for the reduction of
   the number of points required to repre-
   sent a digitized line or its caricature;
   The Canadian Cartographer, Vol. 10,
   No. 2, pp. 112–122
Heiskanen, Weikko A.; Helmut Moritz
   (1967): Physical Gedoesy; Bulletin
   Géodésique (1946–1975), Vol. 86, No. 1,
   pp. 491–492
Ramer, Urs (1972): An iterative procedure
   for the polygonal approximation of
   plane curves; Computer Graphics
   and Image Processing, Vol. 1; No. 3,
   pp. 244–256
Teunissen, Peter J.; Alfred Kleusberg (eds.).
   (1998): GPS for Geodesy; Springer
   Science & Business Media                     Polarstern and the temporal resolution changed         have resulted in large deviations of the stored
Torge, Wolfgang (2003): Geodäsie; de            to one second. All original data as well as motion     positions and for the standard user, it is very hard
   Gruyter, 2. vollst. überarbeitete Auflage
Williams, Ed (2012). Aviation Formulary         and filtered data is stored continuously up to date.   to evaluate the database without digging deep
   V1.46; http://www.edwilliams.org/            During 2006, all older data have been converted        into the data and related metadata. In general,
   avform.htm                                   to common formats and are now available in the         the data quality has significantly improved. The
                                                state-of-the-art version of DSHIP database (https://   temporal resolution increased, the technical de-
                                                dms.awi.de/Polarstern.html).                           velopments leaded to more precise positioning
                                                                                                       and the storage of the raw data in the ship’s own
                                                3 The ›true‹ track record of Polarstern                databases now enables a long-term storage of
                                                As outlined in the history above, data qual-           relevant information. For some scientific cruises,
Fig. 5: Data example of
                                                ity and artefacts have varied through time. Also,      it was found that different positions of the same
the cruise PS103 (16.12.2016                    the storage and naming of different systems has        sample are published and that its actual position
to 03.02.2017)                                  changed. Several different error sources may           remained unclear. This is caused by the different
                                                                                                       information distributed concerning the actual
                                                                                                       locations, i.e. some instruments were fed by raw
                                                                                                       GPS data and others by filtered navigation. With
                                                                                                       a length of 118 metres, this can be already criti-
                                                                                                       cal for a vessel like Polarstern to navigate to dis-
                                                                                                       tinct small-scaled targets from previous cruises.
                                                                                                       A good documentation of the GPS antenna posi-
                                                                                                       tions helps to backtrack the true position where
                                                                                                       an original measurement was performed or a
                                                                                                       sample was taken. To be able to do so, the posi-
                                                                                                       tion of the ship (centre of gravity) as well as the
                                                                                                       orientation of the ship must be known.
                                                                                                          The aim of this project was to generate a sin-
                                                                                                       gle valid track from all available navigation- and
                                                                                                       motion sources on the vessel. The basic idea is to
                                                                                                       use all available information to create the best (or
                                                                                                       most likely) position for the centre of gravity for
                                                                                                       every moment of the entire cruise. The related
                                                                                                       motion and heading data can then be used to
                                                                                                       reconstruct the most likely location of a certain
                                                                                                       measurement.
                                                                                                          Fig. 4 illustrates the workflow of the Master Track
                                                                                                       routine. It begins with the download of all avail-
                                                                                                       able raw data from the web interface of the ship’s
                                                                                                       data acquisition system DSHIP. A first visual inspec-
                                                                                                       tion of the extracted data is performed mainly to
                                                                                                       detect missing information and afterwards, all in-
                                                                                                       dividual GPS positions (i.e. the locations of the GPS

8                                                                                                                         Hydrographische Nachrichten
Track record

antennas) are centred to a distinct location on the
vessel. Optimally, this is the location of the mo-
tion sensor which is installed close to the vessels
centre of gravity. The coordinates are centred or
projected using a rotation matrix to take the lever
arms and the motion angles into account (Torge
2003; Teunissen and Kleusberg 1998) and finally
transformed from the Cartesian coordinate system
of the ship to a geodetic system (Heiskanen and
Moritz 1967). An example of motion data, as well
as positions before and after centring is shown in
Fig. 5.
   Subsequently, an automatic filtering procedure
is applied for the track of every navigation device.
Outliers are marked, if their distance to the previ-
ous location is too far or the course (calculated
                                                                                                                 Fig. 6: Development of the
after Williams 2012) changes too quickly. For this,    algorithm (Ramer 1972; Douglas and Peucker 1973)        score values from 1984 to 2013
thresholds for speed, acceleration and course-         is used to generate a generalised version of the
change are defined. After this automatic filtering,    Master Track. This algorithm only keeps the rel-
the whole track is examined visually to detect and     evant corner points within a specified distance to
manually mark remaining outliers.                      the track. The tolerated distance of points off the
   Based on the general quality of the navigation      track was set to 4 arc seconds which is approxi-
devices and the amount of flagged positions for        mately 120 metres.                                     Further reading
each individual track, the final Master Track is a        The resulting Master Track and the generalised      A complete overview of the
combination of the best available position for eve-    Master Track is then published in the data informa-    Master Tracks calculated for
ry second of the cruise. Gaps up to a time span of     tion system PANGAEA together with a processing         Polarstern is given on the
                                                                                                              expedition homepage of this
one minute are linearly interpolated.                  report.                                                vessel on PANGAEA
   To evaluate the quality of the created Master                                                              (https://www.pangaea.de/
Track, but also the quality of the underlying raw      4 Summary                                              expeditions/cr.php/Polarstern).
data, a score value was calculated for every cruise.   Since her commissioning in 1982 until Decem-           A detailed description of
                                                                                                              the method including the
The calculation of this value takes into account       ber 2016, Polarstern has travelled 262 cruises. It     algorithmic validation and all
the completeness of the extracted raw data, the        was possible to calculate the Master Track for 240     errors can be found in the data
amount of automatically and manually flagged           of these cruises. Up to the cruise ARK-II/1 (which     processing logbook (hdl:10013/
positions, and the number of gaps and interpo-         ended on 11.06.1984), the data was not continu-        epic.45909). This logbook is a
                                                                                                              living document and updated
lated positions in the final Master Track. A score     ously recorded. Thus, for the first 15 cruises, only   continuously.
value of 0 means no data, the maximum can be           the positions registered during meteorological ob-
100 (all data available, nothing flagged and no        servations (from 06:00 a.m. until 9:00 p.m., every 3
gaps or interpolations). Fig. 6 shows the develop-     hours) are available. For the remaining seven miss-
ment of the scores for the cruises between 1984        ing cruises, unfortunately no data has been stored
and 2013, the improvement of data quality can          in the database.
be seen.                                                  In Fig. 7, the Master Tracks of all cruises are
   To reduce the amount of data without losing         shown separated for Antarctic-, Transit- and Arctic        Fig. 7: All available Master
valuable information, the Ramer-Douglas-Peucker        cruises. “                                                   Tracks from 1982 to 2016

HN 107 — 06/2017                                                                                                                            9
Ammunition detection

High-frequency snippet
backscatter information
Introducing a promising alternative to precisely detect
surficial ammunition in shallow coastal waters
An article by Tina Kunde

Within the last years, backscatter information collected with high-frequency multibeam
echo sounder systems are moving more and more to the centre of the hydrography
community’s attention. Not only the imagery processing possibilities for backscatter
information, but also the image generating technique itself has been strongly opti-
mised. Using snippet backscatter data, high-resolution images with a pixel size of up
to 0.05 m for shallow coastal waters can be generated. Combined with the possibil-
ity of vessel-based differential global navigation satellite system (DGNSS) positioning,
snippet backscatter information can be indicated as a promising prospective method
for surficial ammunition detection offering a horizontal positioning accuracy of up to
0.1 m. To stay abreast
of changes, this article ammunition detection | Baltic Sea | DGNSS | multibeam echo sounder | snippet backscatter
should introduce the
fundamentals of a base- Introduction                                                 nect precise horizontal satellite positioning with
line study conducted Hydrography as a scientific discipline of geomatics ammunition detection at high survey speed in
within a cruise with RV has a broad range of thematic fields concerning shallow coastal waters.
»Alkor« (AL447).              the earth’s waters. With regard to the rapid ad-         This article serves as an introduction to a base-
                              vancement in both ecology and economy, the line study that builds the basis for the written the-
                              aim of knowledge enhancement when dealing sis. Conducted in collaboration with the Ministry of
                              with all kind of waters is becoming increasingly Energy, Agriculture, the Environment and Rural Ar-
Author
Tina Kunde works at the       important and hence the tasks covered by hy- eas (MELUR) within the scope of a research cruise
Coastal Research Station      drography do. The main duties as stated by the with RV »Alkor« (Schneider von Deimling 2015),
of the Lower Saxony Water     IHO can be summarised to the assurance of the the acquired high-frequency multibeam snip-
Management, Coastal Defense   safety of navigation and the support of all ma- pet backscatter information were analysed due
and Nature Conservation
Agency (NLWKN) in             rine activities assigned to different subject areas to their feasibility to detect dumped ammunition
Norderney.                    such as economic developments and the envi- bodies of different shape and size. In addition, the
                              ronmental protection. In particular, the economic attainable horizontal position accuracy using dif-
tina.kunde@                   development of renewable energies and the uti- ferent GNSS solution states was compared to give
    nlwkn-ny.niedersachsen.de
                              lisation of water areas for offshore constructions evidence of possible accuracy increases.
                              and transoceanic cables moves to the centre of
                              public attention.                                      Snippet backscatter theory
                                 As explained in Böttcher et al. (2011, 2015), areas The signal transmitted by a multibeam echo
                              used for offshore wind turbines and subsequently sounder strikes the seafloor in different angles.
                              related cable routes need to be examined in ad- Parts of the acoustic energy are reflected, others
                              vance to preclude the occurrence of ammunition penetrate the seafloor where they are subject to
                              bodies. Up to now, the detection and localisation refraction processes. The remaining part of the
                              of suspicious subsea objects is performed by using signal is scattered depending on consistence
                              high-resolution side-scan or synthetic aperture so- and morphology of the seafloor. The scatter-
                              nars. These surveys are often supplemented by ing straight towards the incident wave is named
                              towed magnetometer systems as introduced in backscatter. It follows from the geometry that
                              Frenz (2014) and Kretschmer and Jans (2016). How- the backscattered signal is more extended in the
                              ever, both in a towed configuration or mounted on outer beams of the swath than in the nadir re-
                              an underwater vehicle, the accurate horizontal po- gion. The acquired and recorded time series of re-
                              sitioning of these systems is challenging and rela- turned echoes per beam is called ›snippet‹ (Fig. 1).
                              tively low compared to GNSS positioning. Due to To generate a sonar image of the ensonified area,
                              the still proceeding improvements of multibeam the snippet segments of all beams need to be
                              echo sounder systems, the snippet backscatter recombined and arranged line by line along the
                              information, which is registered simultaneously to swath. This recombination is ideally done after the
                              the bathymetric depth, offers the potential to con- evaluation of the depth measurement to ensure

10                                                                                                     Hydrographische Nachrichten
Ammunition detection
that the imagery data is connected to the right
position, whereas only the depth values at the
centre points (bottom return signal) are known;
all intermediate points get an interpolated depth
value. For the performance, the centre point of
each beam needs to be determined and placed
on the swath at the correct position. After that,
the surrounding snippet intensity values within
one beam are used for image formation until the
intersection with the adjacent beam. As indicated
in Fig. 1, the number of snippet values highly de-
pends on the pulse length: The shorter the pulse
length, the more snippets can be generated and
therefore, high-resolution mosaics are possible
following the range resolution formula.
Precise positioning using DGNSS
The determination of the actual position of mov-
ing vehicles both on land and sea can be conclud-
ed as the main objective of tracking as a branch of
navigation. For these tracking purposes, a system
is needed offering full availability, reliability and
usability. Therefore, GNSS became a great conven-
ience within the scope of aids to vessel navigation.
All common GNSS are using the same architecture
and basic principles for localisation:
• Absolute positioning (also known as stand-
alone GNSS) and
• DGNSS, which can be defined as an enhanced
Fig. 1: Scheme of pulse
form of absolute positioning. gathered with a high-frequency multibeam echo interaction at oblique
By using a receiver in combination with base sta- sounder system (200 to 400 kHz) due to their incidence and the
tion information, it is possible to minimise errors usability to detect surficial objects, in this case generation of a snippet
caused by imprecise knowledge of propagation dumped ammunition bodies of different shape
speed and orbital data leading to an increased and size. Additionally, the horizontal positioning
theoretical accuracy from metre up to millimetre accuracy of different GNSS solutions was com-
scale in comparison to the absolute positioning. pared to point out an accuracy improvement po- Fig. 2: Area of investigation
For follow-up evaluation of the general accuracy tential. The designated ammunition dumping site (rectangle) in the Kiel Bay.
Mercator projection using the
of GNSS positioning, it has to be distinguished be- Kolberger Heide in the Bay of Kiel (Baltic Sea) and global 30 arc seconds data set
tween the accuracy of the pseudorange measure- its adjacent eastern areas were chosen for data GEBCO 2008. Black pattern
ment and the carrier phase accuracy. While the acquisition (Fig. 2). On account of the geological indicates the surveyed profiles
carrier phase evaluation for kinematic observa-
tions is quite complex, the attainable accuracy of a
continuous kinematic observation can be general-
ly stated to 1 to 2 dm. The pseudorange measure-
ment is comprised of three main error influences:
• User range error,
• Signal dispersion (ionosphere, troposphere and
multipath effects) and
• Receiver errors (noise and instrumental delays).
The inertial navigation system (INS) with its dual-
antenna setup used within the presented baseline
study is able to derive a position accuracy (both
horizontal and vertical) of 0.5 to 4.0 m for absolute
positioning and 20 to 1 cm using DGNSS.
Baseline study
The baseline study was conducted in close col-
laboration with the MELUR within the scope of
a research cruise with RV »Alkor« (AL447) in Oc-
tober/November 2014. The aim of this study was
the analysis of snippet backscatter information
HN 107 — 06/2017 11Ammunition detection
origin and the consequences of a storm surge in gain corrections and heading spline smooth-
References
Böttcher, Claus; Tobias Knobloch; 1625, this area is characterised by its shallow water ing were applied to the data. The GNSS data was
Niels-Peter Rühl; Jens Sternheim; depth ranging between 5 and 18 m. post-processed using the manufacturer-specific
Uwe Wichert; Joachim Wöhler (2011): software MOTION INSight 1.1.1 partly referring to
Munitionsbelastung der deutschen Measurements and processing NovAtel Waypoint GrafNav 8.3 kindly provided by
Meeresgewässer – Bestandsaufnahme
und Empfehlungen; BSH Hamburg, The bathymetric data including the snippet Coda Octopus working with internal Kalman filter-
174 pp. backscatter information was mapped using an ing.
Böttcher, Claus; Tobias Knobloch; Jens EM 2040C multibeam echo sounder kindly pro-
Sternheim; Ingo Weinberg; Uwe vided by Kongsberg Maritime. The system was Results and interpretation
Wichert; Joachim Wöhler (2015):
Munitionsbelastung der deutschen operating with a frequency of 300 kHz, a constant For cross-validation of suspicious backscatter
Meeresgewässer – Entwicklungen pulse length of 50 µs and a maximum swath an- anomalies, the detections were compared to Ger-
und Fortschritt (Jahr 2014); MELUR gle of 130°. For positioning, the self-calibrating man Navy data provided with kind permission of
Kiel, 72 pp. multi-sensor INS F180R from Coda Octopus the Bundeswehr Technical Center for Ships and
Frenz, Uwe (2014): Autonome Unterwas-
serfahrzeuge mit SAS-Technologie combining an inertial measurement unit with a Naval Weapons, Maritime Technology and Re-
– Neue Möglichkeiten in der zivilen NovAtel dual-antenna GNSS was used. For DGNSS search (WTD 71). Regarding all further graphical
und militärischen Anwendung; Hy- evaluation, the State Bureau of Surveying and presentations and texts, it should be mentioned in
drographische Nachrichten, HN 97, Geoinformation Schleswig-Holstein kindly provid- forehand that geographical coordinates are con-
pp. 11–16.
Kretschmer, Uwe; Wolfgang Jans (2016): ed the base station information from Kiel, Bungs- sciously waived as they represent restrictive infor-
Ortung von Altmunition im Meer – berg, and Westermarkelsdorf supplied by the mation bound by the obligation of secrecy.
Beiträge aus der Forschungsarbeit der German satellite positioning service SAPOS with Using the documented latitude and longitude
WTD 71; Hydrographische Nachrichten, a data rate of 1 Hz. In total, 83 survey lines were accuracy of the evaluated GNSS positioning set-
HN 103, pp. 12–21
Schneider von Deimling, Jens (2015): R/V sailed with an average vessel speed of four knots tings, the horizontal position accuracy for the ex-
ALKOR Cruise Report AL447 – Controls covering an area of 16.7 km². For further geological emplary time period was determined. Fig. 3 draws
on methane seepage in the Baltic Sea; investigations, an Innomar SES-2000 standard par- a general visual comparison between the absolute
GEOMAR Helmholtz Centre for Ocean ametric sub-bottom profiler was utilised during an GNSS and DGNSS positioning results using the SA-
Research, Kiel, 41 pp.
additional cruise with RV »Littorina« in March 2015. POS base stations over an observation period of 24
The post-processing of the bathymetric data hours. The results depicted in Fig. 3 underline that
including manual roll-pitch-yaw calibration, tide the usage of the SAPOS correction service leads to
Fig. 3: Order of magnitude correction as well as data validation and cleaning a horizontal accuracy increase of nearly 87.5 % in
for achievable horizontal was done using the CARIS HIPS and SIPS 8.1 soft- the nearshore area. Comparing the achieved accu-
position accuracies. Absolute ware. For snippet backscatter evaluation, the QPS racies for the DGNSS positioning, it is conspicuous
GNSS positioning and DGNSS
positioning using different
Fledermaus Geocoder 7.3.6 toolbox was used. To that there are only small differences between the
indicated SAPOS base stations create a homogeneous and high-quality mosaic, different post-processing setups, which is of par-
for correction information radiometric power gain as well as angle varying ticular interest from an economic perspective. The
only exception is the single usage of the Wester
markelsdorf base station caused by its distance
to the investigated area (approximately 23.5 nm
northeast). In Fig. 4, a period of three hours (6:00
a.m. to 9:00 a.m.) is shown more detailed to give
an insight into the logged position data. Same
as in Fig. 3, it is obvious that the DGNSS solution
provides both a higher horizontal and vertical ac-
curacy.
The complete area of investigation was analysed
with a bathymetric model showing a seafloor with
water depth of 5.38 m slightly falling off towards
northwest down to 16.80 m. With the increasing
water depth also the prevailing sediments change
from coarse to a more fine grain size as document-
ed by a snippet backscatter-derived sediment
classification based on angle vs. range analysis.
Therefore, also the backscatter intensities in the
created mosaic switch from high to low reflect-
ance indicated by a light respective dark colour-
ing. The bathymetric surface and the geographical
referenced snippet backscatter image were gener-
ated with a grid size of 0.4 m × 0.4 m according
to the computed horizontal total propagation un-
certainty, whereas the charted sediment variability
uses an underlying grid size of 1.00 m × 1.00 m.
For object localisation, high-resolution snippet
backscatter close-up images with a mosaic pixel
12 Hydrographische NachrichtenAmmunition detection Fig. 4: Position accuracy for absolute GNSS positioning (blue) compared to DGNSS positioning using three SAPOS base stations (orange). Horizontal accuracy [m] (above) and vertical accuracy [m] (below) over a period of three hours in the morning size of 0.05 m × 0.05 m were generated during the was picked, on the other hand also the usage of post-processing. Fig. 5 gives an insight showing different positioning solutions must be taken into two of the detected objects and their appearance account when regarding the partly considerable within the snippet backscatter. The subfigures in- high differences. dicated as (a) show the German Navy sonar image used for validation and comparison. In the centre, Discussion indicated as (b), a screenshot taken during the data As mentioned, the snippet backscatter images can acquisition – and therefore not geographically be seen as an alternative technique to monitor referenced but orientated with respect to the ap- dumped surficial ammunition bodies in a shallow propriate bearing – is shown. Subfigures indicated water environment. In contrast to deep-towed so- with (c) show the processed and geographically nar systems (both side-scan and synthetic aperture referenced snippet backscatter mosaic. Compar- sonar) or systems mounted on an autonomous ing images (b) and (c), the post-processed mosaic underwater vehicle, the vessel-based multibeam remains below the expectations, but nevertheless, can be supplemented with a high-precision GNSS. the detection of surficial objects is technically fea- Quantitative sediment transport processes can be sible. In total, 20 objects of different shape and size measured, monitored and predictively modelled were examined more closely. Due to the fact that using the versatile multibeam data. Furthermore, all objects are located in a similar environment and this may help to identify possibly hazardous areas water depth, an assessment of the data sensitivity and can give information about the surrounding is only possible in theory. habitat to evaluate a possible toxic contamination. In addition to the image-based object analysis, Compared to applied side-scan sonar systems, the horizontal object position was determined the coverage of the multibeam echo sounder can and compared with the official data. All objects be stated as the most influencing limitation fac- show a significant difference in the horizontal po- tor. However, the detection of dumped objects is sition compared to the reference information. On only possible up to a certain water depth as the the one hand, this can be seen in the fact that it footprint of the swath was stretched and, conse- is not ascertainable where the reference position quently, the transmitted pulses are distributed HN 107 — 06/2017 13
Ammunition detection

     Fig. 5: Detected ammunition bodies on the seafloor. Side-scan sonar images taken from a database provided by the German Navy (left),
     screenshot of multibeam snippet backscatter information during data acquisition (centre), and post-processed snippet backscatter mosaic with
     a pixel size of 0.05 m × 0.05 m (right). Dark colours represent low, light colours high backscatter intensities given in dB

                                    over a wider range leading to resolution decrease.              enables a long-term monitoring strategy using a
                                    With both system approaches, a detection of bur-                vessel equipped with GNSS and a high-frequency
                                    ied ammunition bodies is not feasible, but the us-              multibeam echo sounder as a platform.
                                    age of low-frequency acoustic or sonar systems is                  With regard to the post-processed snippet
                                    already an object of research as also mentioned                 backscatter images, especially its resolution, fur-
                                    by Kretschmer and Jans (2016). Anyhow, for a reli-              ther improvements are preferable. Compared to
Acknowledgements
The author would like to            able detection of ammunition bodies, the survey                 the online data, it is obvious that the post-proc-
address thanks to: Dr. Jens         should always be conducted using different sys-                 essed images did not represent the normal case.
Schneider von Deimling (CAU)        tems to confirm the findings and to justifiable pre-            Nevertheless, high-frequency multibeam snippet
for sharing his project idea,       clude potential hazards.                                        backscatter offer a promising alternative at least
providing the opportunity
to participate on RV »Alkor«                                                                        from both economic and scientific perspective.
his expedition AL447, and           Conclusion                                                         Already focused by the body of experts, the
supervision;                        The central issue addressed by the study was the                assessment of future sedimentation processes
Prof. Dr.-Ing. Harald Sternberg     feasibility of snippet backscatter information col-             provides a framework for further investigations
and M.Sc. Tanja Dufek (HCU)
for supervision;                    lected with a vessel-based high-frequency multi-                regarding the monitoring of ammunition body
Claus Böttcher and the body         beam echo sounder to detect ammunition bodies                   burification caused by sediment transport. The
of experts »Munition im Meer«       of different sizes dumped in shallow coastal wa-                successfully demonstrated positioning improve-
(MELUR) as well as the WTD 71       ters. By means of the analysis of GNSS information,             ments obtained by post-processing the data with
for close cooperation;
Dipl.-Geol. Julia Schwab (CAU)      a possibility to improve the current lack of horizon-           SAPOS corrections could serve in the future to
for additional sub-bottom           tal position accuracy should be pointed out. Based              quantitatively evaluate possible sedimentation dy-
profiler data.                      on the evaluation of 20 randomly selected objects,              namics. 18 month after the AL447 research cruise,
                                    it can be established that the snippet backscatter              the cooperative project UDEMM (project period:
                                    information gathered with the EM 2040C multi-                   March 2016 to February 2019) is focused on the
                                    beam echo sounder are suitable for the detection                implementation of an environmental monitor-
                                    of surficial objects. For verification, imagery as well         ing of ammunition delaboration procedures. Us-
                                    as position data provided by the German Navy was                ing acoustic, visual, and chemical studies, future-
                                    used. The vessel-based GNSS offers a significant                oriented methods, techniques, and strategies for
                                    increase of the horizontal position accuracy from               the mentioned environmental monitoring should
                                    0.64 m up to 0.08 m compared to the absolute                    be developed to ensure a long-term benefit for
                                    positioning. The combination of precise position-               both the environmental and the economic point
                                    ing and feasible snippet backscatter information                of view. “

14                                                                                                                         Hydrographische Nachrichten
Seafloor classification
Geological interpretation of
bathymetric and backscatter data
An article by Corinne Melchior
The Geomar Helmholtz Centre for Ocean Research Kiel carried out two cruises in the
eastern equatorial Pacific back in 2015 and collected multibeam, backscatter and sub-
bottom data along with other oceanographic information. This work focuses on the
evaluation and processing of the echo sounder data sets. Wrong measurements en-
countered during the data processing are analysed and corrected. A geological clas-
sification and interpretation of the seafloor by using the ArcGIS tool »Benthic Terrain
Modeler« and an algorithm for Principal Component Analysis and K-means clustering.
Classifying the seafloor
Angle Range Analysis | Benthic Terrain Modeler | Principal Component Analysis | K-means classification helps to identify pit
structures lining the
1 Introduction 2 Study area seafloor which possibly
During the summer of 2015, the German research The study area is located in the eastern equatorial formed due to dissolu-
vessel RV »Sonne« started its cruises SO 242-1 (28th Pacific, about 400 km off the coast of Peru (Fig. 1). tions in the seabed.
July to 25th August) and SO 242-2 (28th August to Its depths range from 2,400 m to 4,400 m and the
1st October). Both research cruises were executed dimensions of the terrain are 84 km in width and
by the Geomar Helmholtz Centre for Ocean Re- 500 km in length. It consists of the DISCOL area
search Kiel and went to the Eastern equatorial Pa- in the southwestern part and a total of six tran-
cific to the DISCOL (DISturbance and reCOLoniza- sit ways. It is located in the middle of the Nazca
tion) Experimental Area where in the late 1980s a Plate where the seafloor is about 25 million years
test dredging in order to a long term observation old. Therefore it is even more surprising that lava
of the rehabilitation of the seafloor after a human fields not covered by sediments are found in this
impact has taken place. During the SO 242 cruises area.
Author
lava fields which seem to be of newer origin were Corinne Melchior works
discovered. They indicate an at least semi active 3 Data acquisition as a hydrographer at Geo
volcanism. Apart from those lava structures, pock- The measuring system consisted of a Kongsberg Ingenieurservice Group in
marks were found in this area. multibeam echo sounder, the EM122 with the abil- Wilhelmshaven.
Based on the provided bathymetric data, the ity to record not only the bathymetry data but also melchior@geogroup.de
processing and assessment of it as well as the backscatter data. The data was recorded with a
identification and description of geological fea- frequency of 12 kHz and a survey speed of 8 knots
tures building the seafloor are part of this work. within the research area of the DISCOL region. Dur-
Along with that, the seafloor is classified into mor- ing the transits, the vessel drove at a speed of 12
phological structures and the seafloor pits are to to 15 knots (Geomar 2015). The sub-bottom data
be described and identified. was collected with the Atlas Parasound DS3 which
Fig. 1: Overview of the
location of the surveyed area
(background data: GEBCO 30
arc seconds grid, survey data:
50 m resolution)
HN 107 — 06/2017 15Seafloor classification
the beams along track alternate in their height,
especially visible when lines overlap. Changes in
height in the outer beams, especially when the up-
and downwards movements are opposed to each
other, is an indicator of a roll offset. A closer look on
the recorded roll values, the time series plot in the
processing software Qimera is used to plot the roll
values over time and it shows big variations in the
angle measurements. With the software the errors
could not be eliminated but only minimised.
Apart from the roll errors, wrong measurements
on the down slope of seamounts are observed
where the slope seems to be extended (Fig. 2). A
plausible origin is not recognisable. It can be as-
sumed that during the data recording process,
a logging error of depth and position occurred.
Examining the beams in question for those errors
gives the result that the wrong echoes are record-
Fig. 2: Downslope error
plotted with the ship track in is hull-mounted on the RV »Sonne«. It measures ed by the inner beams between beam number
black (grid resolution: 50 m) with parametric effect, where the primary high 183 and 236. The slope extension varies between
frequency was at 18 kHz and the secondary low 2,000 and 6,500 m and the height difference of
frequency at 4 kHz. The positioning for all the re- those wrong measurements compared to the
corded data was provided by the integrated Sea way they should be measured varies between 150
path MRU-GPS system. and 230 m. Those errors on the downslope of the
seamounts can unfortunately not be corrected but
4 Data processing have to be deleted in order not to influence the
later occurring computations based on the data.
4.1 Erroneous measurements
Already during the measurements and later in 4.2 Backscatter processing
the processing wrong measurements in the outer Backscatter images can be created in the Fle
beams were detected. With a closer look on the dermaus Geocoder Tool (FMGT) by QPS. The soft-
data, a pattern can also be observed. It seems that ware provides a tool to extract the intensity of the
backscatter data by mosaicking the snippets. It
Fig. 3: Workflow of the
classification process within extracts the backscatter data from the processed
the Benthic Terrain Modeler multibeam data and creates a grid based on a cell
(according to Wright et al. size. Additionally, FMGT provides already a classifi-
2005) cation based on the backscatter data. The Angle
Range Analysis (ARA) classifies the seafloor based
on the changes of the signal’s intensity over the
grazing angle. It compares the measured values
to mathematical models and based on their simi-
larities the classification takes place (Fonseca et
al. 2008). But since a homogeneous seafloor is as-
sumed, the ARA is not suitable for deep sea values.
Since no homogeneity is provided over a distance
of about 7 km.
4.3 Benthic Terrain Modeler
The Benthic Terrain Modeler – a tool for ArcMap
– helps to analyse the terrain and to classify the
seafloor. Several computations can be executed.
For a seafloor classification, the following terrain
computations are needed: slope and standardised
Bathymetric Position Indexes (BPI) for a broad ra-
dius and a fine radius as well as the bathymetry
and a classification dictionary. A schematic of the
workflow is shown in Fig. 3.
The Bathymetry Position Index provides infor-
mation of a location – a raster cell – relative to its
surrounding. The surrounding is defined by an in-
ner and outer radius which describe an annulus
– a ring-shaped element. The radii are measured
16 Hydrographische NachrichtenSeafloor classification
Fig. 4: Broad (A) and fine
(B) BPI computations for
the example area. Raster
resolution: 50 m
References
Amiri-Simkooei, Ali R.; Mirjam Snellen;
Dick G. Simons (2011): Principal
Component Analysis of Single-Beam
Echo-Sounder Signal Features for
Seafloor Classification; IEE Journal of
Oceanic Engineering, Vol. 36, No. 2,
from the centre of the centre raster cell. The mean 4.4 Principal Component Analysis/ pp. 259–272
elevation of the values within the annulus is com- K-means classification Eleftherakis, Dimitrios (2013): Classifying
puted and compared to the elevation value in the The Principal Component Analysis (PCA) is a method sediments on Dutch riverbeds using
multi-beam echo-sounder systems;
centre cell. If the centre cell is on a higher elevation that extracts the main components from a variety doctoral thesis, TU Delft
than the computed mean value for the surround- of input variables and devides them into fewer vari- Fonseca, Luciano; Craig Brown; Brian Cal-
ing, a positive BPI is assigned, and if it is lower than ables. It is assumed that the input data are different der; Larry Mayer; Yuri Rzhanov (2008):
the computed mean value within the defined ra- from each other (Eleftherakis 2013). The output is a Angular range analysis of acoustic
themes from Stanton Banks Ireland:
dii, a negative BPI will be assigned. In case of a BPI reduced data set containing only the principal most- A link between visual interpretation
which is close to zero, it is advisable to cross-check ly uncorrelated components. The tool therefore min- and multibeam echosounder angular
the terrain with the slope at this point because it imises the dimensions and complexity of the input signatures; Applied Acoustics, No. 70,
can be that the point is either within a flat area, or data sets. The output component layers represent pp. 1298–1304
Geomar (2015): Cruise Report SO242-1
a saddle point or on a constant slope (Weiss 2001; the main components. The first component is the Hovland, Martin; Henrik Svensen; Carl
Lundblad et al. 2006). There are two BPI computa- strongest one – the one that variates the most. The Fredrik Forsberg; Harald Johansen;
tions needed for the seafloor classification, a broad second output component is the second strongest Christine Fichler; Jan Helge Fossa; René
and a fine BPI. The differences are the values of one and so on. Input layers for the PCA are, addition- Jonsson, Håkon Rueslåtten (2005):
Complex pockmarks with carbonate-
the radii. The usage of the broad BPI is to identify ally to the BPIs, the slope and the bathymetry, the ridges off mid-Norway: Products of
coarse structures on the seafloor, and the fine BPI backscatter data and its statistics like the mean, min- sediment degassing; Marine Geology,
is for fine and small structures. The difference of imum, maximum, the standard deviation and the No. 218, pp. 191–206
the two types of BPIs can be seen in Fig. 4. range of the backscatter. Those are processed with Judd, Alan; Martin Hovland (2007): Seabed
Fluid Flow; Cambridge University Press
The next two elements needed for the BTM clas- the PCA and the three principal components from Lundblad, Emily R.; Dawn J. Wright;
sification are the slope and the classification dic- the output are taken for further processing. Main Joyce Miller; Emily M. Larkin; Ronald
tionary. The dictionary is the basic component of contributors of the three principal components are Rinehart; David Naar; Brian T. Donahue,
the BTM. It defines the different classes and their the backscatter standard deviation, mean, the broad S. Miles Anderson, Tim Battista (2006):
A Benthic Terrain Classification Scheme
characteristics. It has a table structure where each bathymetry as well as the slope (Fig. 5). for America Samoa; Marine Geodesy,
row corresponds with a class and the columns de- For classifying the now reduced amount of No. 29, pp. 89–111
fine the thresholds of the used layer values. The data, the unsupervised classification method of Moore Jr., Ted C.; Neil C. Mitchell; Mitchell
morphological classes for classifying the data set K-means clustering is used. The algorithm iterates Lyle, Jan Backman; Heiko Pälike (2007):
Hydrothermal pits in the biogenic
include seamounts, basement highs, plain area as over the data layers until there are clusters which sediments of the equatorial Pacific
well as small and deep depressions and pits. contain features as similar as possible but the clus- Ocean; Geochemistry Geophysics
The BTM uses the broad and fine BPIs, standard- ters themselves are distinguishable from each oth- Geosystems, No. 8
ises them for being scale independent, as well as the er as much as possible (Amiri-Simkooei et al. 2011). Weiss, Andrew D. (2001): Topographic
Position and Landforms Analysis;
slope and the bathymetric grid. Each of those layers The Nature Conservancy, www.
can have a lower and an upper limit. For setting those 4.5 Sub-bottom profiler data processing jennessent.com/downloads/tpi-
thresholds, values must be taken from the single lay- The sub-bottom data are mostly used for cross- poster-tnc_18x22.pdf, last access on
ers by drawing profiles across each layer (see table). checking the bathymetry data in regions around 16.05.2017
Wright, Dawn J.; Emily R. Lundblad; Emily
M. Larkin; Ronald W. Rinehart; Joshua
Class Zone Broad Broad Fine Fine Slope Slope Murphy; Lori Cary-Kothera (2005):
BPI Lower BPI Upper BPI Lower BPI Upper Lower Upper Benthic Terrain Modeler; Oregon State
0 Not defined University Davey Jones Locker Seafloor
Mapping/Marine GIS Lab & NOAA
1 Seamounts 170 1250 Coastal Services Center; dusk.geo.
2 Basement highs 20 170 –150 orst.edu/esri04/p1433_ron.html, last
access on 16.05.2017
3 Plain area –40 20 –200 0 3
4 Small depressions –150 –40
5 Deep depressions –340 –150
6 Pits –50 170 –3421 150 50
HN 107 — 06/2017 17Sie können auch lesen