Near-infrared (NIR) on-line analysis for coarse-grained raw materials
←
→
Transkription von Seiteninhalten
Wenn Ihr Browser die Seite nicht korrekt rendert, bitte, lesen Sie den Inhalt der Seite unten
Process Know-how
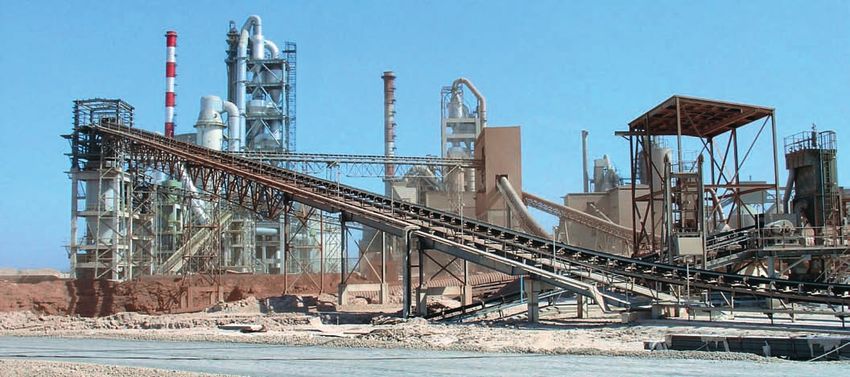
Raysut cement plant in Oman • Zementwerk Raysut in Oman
Near-infrared (NIR) on-line analysis for
coarse-grained raw materials
Dr. Sebastian B. Müller*, Dr. Christoph N. Zwicky, Dr. Leopold Blahous
ABB Switzerland Ltd., Business Unit Minerals, Baden-Dättwil/Switzerland
Summary: In the present paper the use of near-infrared (NIR) spectroscopy for predicting the concentration of CaO, SiO2, Al2O3,
Fe2O3, as well as the moisture content of cement raw material on line is evaluated. Two sets of near-infrared spectra were used to as
sess the effect of systematic changes in the particle size fraction on the predictive performance. The results of this study promote the
applicability of using fine-grained bore-hole samples of a raw material quarry as base calibration and the transfer of this calibration
for on-line analysis of coarse-grained raw material as delivered by a primary crusher.
On-Line-Nahinfrarot(NIR)-Analyse Analyse on-line par spectrométrie Análisis online con infrarrojo próxi-
von grobkörnigem Rohmaterial proche infrarouge (NIR) de matières mo (“near-infrared” NIR) de materia
premières à gros grain prima con granulometría gruesa
Zusammenfassung: Im vorliegenden Résumé: L’application de la spectrométrie Resumen: El presente artículo evalúa el
Beitrag wird die Verwendung der Nah proche infrarouge (NIR) pour la prévision empleo de la espectrometría de infrarrojo
infrarot(NIR)-Spektroskopie zur Vor de la concentration en CaO, SiO2, Al2O3, próximo (NIR) para la predicción online
hersage der Konzentration von CaO, Fe2O3 ainsi que de la teneur en humidité de la concentración de CaO, SiO2, Al2O3
SiO2, Al2O3, Fe2O3 sowie des Feuchtig des matières premières à ciment en cours y Fe2O3 y el contenido de humedad en la
keitsgehalts von Zementrohmaterial im d’exploitation (on-line) est présentée dans materia prima del cemento. Se utilizaron
laufenden Betrieb (On Line) vorgestellt. cet article. Deux sets de spectres proches dos sets de espectros de infrarrojo próxi
Es wurden zwei Sets von NIR-Spektren infrarouges sont utilisés pour analyser les mo para evaluar el efecto en el comporta
verwendet, um die Auswirkungen syste incidences des variations systématiques miento predictivo de cambios sistemáticos
matischer Veränderungen in der Korn dans la fraction granulométrique sur le en la fracción de tamaño de partícula. Los
größenfraktion auf das Vorhersageverhal comportement prévisionnel. Les résultats resultados de este estudio muestran que
ten zu beurteilen. Die Ergebnisse dieser de cette étude montrent que les carottes se puede emplear pruebas de sondeo con
Studie zeigen, dass feinkörnige Bohrpro de sondage à grains fins provenant d’une grano fino provenientes de un yacimien
ben aus einem Rohmaterial-Steinbruch carrière de matières premières peuvent to de materia prima para la calibración
zur Grundkalibrierung verwendet wer être utilisées pour le calibrage de base et y transferir esta calibración para análisis
den können und dass diese Kalibrierung que ce calibrage peut aussi être appliqué de materia de grano grueso como el que
für die On-Line-Analyse von grobkörni pour l’analyse on-line des matières pre aporta una trituradora primaria.
gem Rohmaterial aus einem Grobbre mières à gros grains en provenance d’un
cher übernommen werden kann. concasseur primaire.
*Corresponding author: sebastian.mueller@ch.abb.com
44 ZKG INTERNATIONAL No. 4-2011 www.zkg-online.info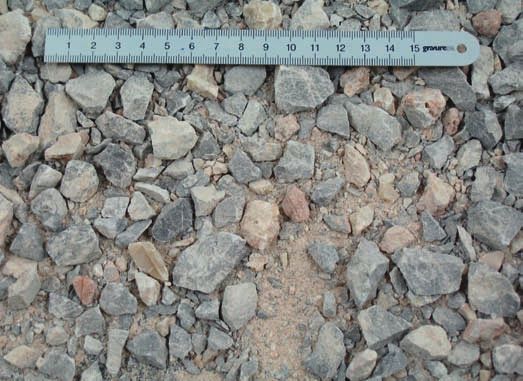
Process Know-how
1 Einleitung
Der Nahinfrarot(NIR)-Bereich des elektromagnetischen Spek
trums erstreckt sich von 780 nm bis 2500 nm (Wellenlänge)
bzw. 12�������
������
800 cm-1 bis 4000 cm-1 bei Messung der Wellenzahl
(Anzahl der Wellen pro cm). Die NIR-Spektroskopie befasst
sich mit Absorptionen von NIR-Energie durch die Moleküle
einer Probe. Absorptionen werden durch verschiedene Me
chanismen verursacht: Grundschwingungen, Obertöne von
Grundschwingungen, Kombinationen von Grundschwin
gungen sowie elektronische Absorptionen [1-3]. Obertöne
sind annähernde Vielfache der Grundschwingungen. Die über
wiegende Mehrheit der Grundschwingungen tritt im mittleren
Infrarotbereich (4000-400 cm-1) auf. Ein Kombinationsband
geht aus einer Kombination des Ein- oder Vielfachen von
zwei (oder mehr) Grundschwingungen hervor. Weiter treten
Wasserstoffbrückenbindungen auf. Wenn in einer Probe Was
1 First NIR analyzer at the Raysut cement plant in Oman ser enthalten ist, erfolgt zwischen dem Wasser und der Probe
Erstes NIR-Analysegerät im Zementwerk Raysut in Oman eine komplexe, dynamische Interaktion, die für die betreffende
Probe einzigartig sein kann [4]. Die Form und Stärke der Was
1 Introduction serabsorptionsbänder hängt von der Mineralzusammensetzung
The near-infrared (NIR) region of the electromagnetic spec des untersuchten Rohmaterials ab [5,6].
trum extends from 780 nm to 2500 nm (wavelength) or
12 800 cm-1 to 4000 cm-1 if measuring in wave numbers (the Das NIR-Absorptionsspektrum eines Rohmaterials wird
number of waves per cm). NIR spectroscopy is concerned durch seinen Mineralgehalt bestimmt. Für die quantitative Ana
with absorptions of NIR energy by molecules within a sample. lyse bildet ein chemometrisches Modell das Infrarotspektrum
Absorptions are caused by different mechanisms: fundamental auf die chemische Zusammensetzung ab. Ein solches Modell
vibrations, overtones of fundamental vibrations, combinations of wird durch Bezugnahme auf die exakte Elementanalyse unter
Tab. 1: Chemical composition of the investigated samples [g/100g] • Chemische Zusammensetzung der untersuchten Proben [g/100g]
SiO2 Al2O3 Fe2O3 MnO MgO CaO Na2O K 2O TiO2 P 2O 5 L.O.I* Sum
F-7/7 18.09 4.77 2.55 0.04 0.94 39.92 0.24 0.92 0.3 0 31.98 99.75
F-6/2-3 9.3 2.93 1.69 0.02 0.91 46.41 0.17 0.59 0.17 0 37.5 99.69
F-5EST/2 10.08 1.8 0.96 0.01 1.28 46.95 0 0.31 0.11 0 37.99 99.49
F-6/2-4 13.41 2.58 1.71 0.01 1.16 43.74 0 0.54 0.14 0 36.07 99.36
F-3/5 6.04 1.5 0.67 0.01 0.73 50.32 0 0.17 0.09 0 40.2 99.73
F-2/4 2.22 0.25 0.12 0.01 0.76 53.93 0.25 0.02 0.01 0.04 42.32 99.93
F-6/2-2 1.63 0.39 0.18 0.01 0.57 53.56 0 0.05 0.02 0.05 42.98 99.44
F-5EST/1 21.31 7.36 4.3 0.02 1.39 31.57 0.42 1.42 0.41 0.04 31.88 100.12
F-3/2 4.54 1.29 0.6 0.01 0.59 51.52 0 0.14 0.07 0 40.73 99.49
F-4/2 4.54 0.94 0.49 0 0.83 51.67 0 0.12 0.06 0 40.95 99.6
F-5R/2 5.22 0.84 0.43 0.01 1.29 50.62 0 0.13 0.05 0.05 40.85 99.49
F-3/3 6.72 1.89 0.84 0.01 0.56 49.79 0 0.19 0.11 0 39.66 99.77
F-7R.SID 14.05 3.12 1.76 0.01 1.25 43.46 0 0.66 0.17 0 35 99.48
F-2/6 1.49 0.3 0.15 0.01 0.53 54.52 0 0.04 0.02 0 43.13 100.19
F-5R/4 24.78 6.57 3.5 0.05 1.33 32.86 0.29 1.31 0.43 0 28.46 99.58
F-5EST/4 10.86 2.99 1.57 0.03 0.91 45.77 0 0.6 0.19 0 37.23 100.15
F-7/6 16.81 4.71 2.4 0.04 1.19 40.34 0 0.32 0.29 0 33.33 99.43
F-5EST/5 18.3 4.95 2.54 0.04 0.99 39.15 0 0.97 0.32 0 32.64 99.9
F-6/1-3 21.97 5.89 3.2 0.04 1.18 35.18 0.28 1.15 0.38 0 30.24 99.51
Min 1.49 0.25 0.12 0.00 0.53 31.57 0.00 0.02 0.01 0.00 28.46
Max 24.78 7.36 4.30 0.05 1.39 54.52 0.42 1.42 0.43 0.05 43.13
Mean 11.12 2.90 1.56 0.02 0.97 45.33 0.09 0.51 0.18 0.01 37.01
Stdev 7.41 2.22 1.24 0.01 0.29 7.18 0.14 0.45 0.14 0.02 4.55
CV** 0.67 0.76 0.79 0.75 0.30 0.16 1.59 0.89 0.79 2.01 0.12
* LOI = loss on ignition/Glühverlust
** CV = coefficient of variation (Stdev/Mean)/Variationskoeffizient (StAbw/Mittelwert)
ZKG INTERNATIONAL No. 4-2011 www.zkg-online.info 45
Process Know-how
2 Samples F-2/6 (top) and F-7/6 (bottom), original state (left) and crushed (right)
Proben F-2/6 (oben) und F-7/6 (unten), Originalzustand (links) und gebrochener Zustand (rechts)
fundamental vibrations, as well as electronic absorptions [1-3]. Berücksichtigung des Feuchtigkeitsgehalts abgeleitet. Das Er
Overtones are approximate multiples of the fundamental vibra scheinungsbild eines Infrarotabsorptionsspektrums hängt nicht
tions. The vast majority of fundamental vibrations occur in the nur vom Mineralgehalt sondern auch von der Korngröße des
mid-infrared region (4000-400 cm-1). A combination band oc analysierten Rohmaterials ab, insbesondere wenn die Korngrö
curs when a photon of NIR energy is shared between two (or ßenverteilung nicht genau eingegrenzt ist [6].
more) vibrations which would be individually observed as fun
damentals in the mid-infrared region. Electronic absorptions Beim ersten NIR-Analysegerät im Zementwerk Raysut in
are caused by the movement of electrons from one orbit to a Oman (Bild 1) tauchte die Frage auf, ob der Korngrößeneffekt
higher-energy orbit [4]. Furthermore hydrogen bonding occurs. kompensiert werden kann, um die Verwendung von chemisch
Whenever water is present in a sample there will be a complex, repräsentativen feinkörnigen Materialien für die Kalibrierung
dynamic interaction between water and the sample, which may zu ermöglichen, statt Proben vom Förderband zu verwenden.
be unique for that sample �������������������������������������
[4]����������������������������������
. The shape and strength of water Die Bohrproben aus dem Steinbruch enthielten solche che
absorption bands depends on the mineral composition of the misch repräsentativen feinkörnigen Materialien. Dieser Beitrag
investigated raw material [5,6]. beschreibt die Schritte und die Methodik, mit denen diese Fra
ge geklärt wurde.
The NIR absorption spectrum of a raw material is a property
of its mineral content. For quantitative analysis a chemometric 2 Die Proben
model maps the infrared spectrum to the chemical composi Die Untersuchungen wurden an 19 Kalksteinproben aus einem
tion. Such a model is derived by reference to accurate elemen Brecher durchgeführt. Die Proben wurden vom Endnutzer
tal analysis, accounting for moisture content. The feature of an genommen und ihre chemische Zusammensetzung deckt den
infrared absorption spectrum depends not only on the mineral erwarteten Konzentrationsbereich der vier Oxide CaO, SiO2,
content but also on the particle size of the analyzed raw mate Al2O3 und Fe2O3 ab, denen das Hauptinteresse gilt. Ein Teil der
rial especially if the particle size distribution is not well con Proben enthielt einen Mergelanteil. Tabelle 1 zeigt die chemische
strained [6]. Zusammensetzung der untersuchten Proben. Die Proben wur
den mittels energiedispersiver Röntgenfluoreszenzspektrometrie
For the first NIR analyzer at the Raysut cement plant in Oman (ED-RFA) anhand von Schmelztabletten analysiert.
(Fig. 1) the question arose as to whether the particle size effect
46 ZKG INTERNATIONAL No. 4-2011 www.zkg-online.info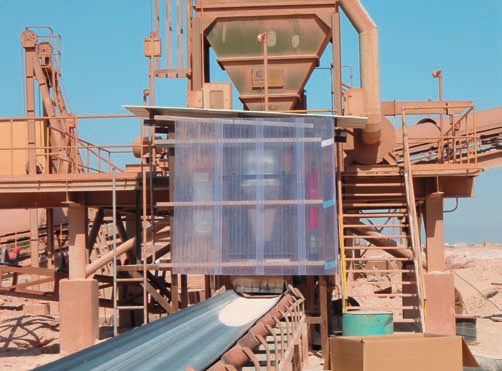
Process Know-how
can be compensated to permit the use of chemically repre Das Originalrohmaterial wurde direkt vom Förderband genom
sentative fine-grained materials for calibration instead of tak men. Nach der Analyse des grobkörnigen Originalrohmaterials
ing samples off the conveyor belt. Such chemically representa mittels NIR-Spektroskopie wurden die Proben getrocknet und
tive fine-grained material were the drill hole samples from the gebrochen. Die Spaltweite des Brechers wurde so eingestellt,
quarry. This paper describes the steps and the methodology to dass 90 % der Charge einen äquivalenten Korndurchmesser
clarify that subject. unter 2 mm hatte. Die feinkörnigen Proben wurden wieder
mit NIR-Spektroskopie untersucht. Bild 2 zeigt das grobkör
2 The samples nige Originalrohmaterial und die gleiche Probe nach dem
The investigations were performed on 19 limestone samples Zerkleinern als feinkörniges Material. Naturgemäss enthält das
out of a crusher. The samples had been collected by the end grobkörnige Rohmaterial auch Anteile von feinkörnigem Ma
user and their chemical composition covers the expected con terial. Die Bilder 3 und 4 zeigen die Korngrößenverteilung des
centration range of the four oxides of key interest CaO, SiO2, grobkörnigen und des feinkörnigen Materials in den beiden
Al2O3 and Fe2O3. A part of the samples contained a marl com Proben aus Bild 2. Alle anderen Proben wiesen ähnliche Korn
ponent. Table 1 shows the chemical composition of the investi größenverteilungen auf.
gated samples. The samples were analysed by energy-dispersive
x-ray fluorescence spectrometry (ED-XRF) on fused beads. 3 Erfassung von NIR-Spektren
Die NIR-Spektren wurden mit einem ABB Spectraflow-Sys
The original raw material was obtained directly from the con tem aufgenommen. Da die Einbeziehung von Feuchtigkeit in
veyor belt. After analyzing the original, coarse-grained raw die Kalibrierung von größter Bedeutung ist, wurden die NIR-
material with NIR-spectroscopy the samples were dried and Spektren für jede Probe bei unterschiedlichen Feuchtigkeits
crushed. The gap width of the crusher was set so that 90 % graden aufgenommen. Die Methodik zur Bestimmung ver
of the batch possesses an equivalent particle diameter smaller schiedener Feuchtigkeitsgehalte in den Proben basiert auf ISO
than 2 mm. The fine-grained samples were investigated with 11465 [7]. Zuerst wurde die Feuchtigkeit der Originalproben
NIR-spectroscopy again. Figure 2 illustrates the coarse-grained ermittelt. Dazu wurden die Proben gewogen und 24 Stunden
original raw material and the same sample after crushing as bei einer Temperatur von 105 °C in einem Labor-Trocken
fine-grained material. Obviously the coarse-grained raw mate schrank getrocknet. Sofort nach der Entnahme der Proben
rial inherently contains some fine-grained material. Figures 3 aus dem Trockenschrank wurde das Nettotrockengewicht be
and 4 show the particle size distributions of the coarse- and the stimmt.
fine-grained material for the two samples from Figure 2. All the
other samples had similar particle size distributions. Dann ließen wir die Proben abkühlen. Beim Abkühlen beginnt
eine Probe, Feuchtigkeit aus der umgebenden Luft aufzuneh
3 Acquisition of NIR spectra men. Unmittelbar vor der Aufnahme der ersten Spektren wurde
The NIR-spectra were acquired using an ABB Spectraflow sys das Gewicht der Probe erneut bestimmt. Für jeden Feuchtig
tem. Since the incorporation of moisture into the calibration keitsgrad wurde eine definierte Menge Wasser über die Probe
is crucial, the acquisition of the NIR-spectra was performed gesprüht und anschließend wurde die Probe gewogen (Bild 5).
for each sample at varying moisture levels. The methodology of Die Anzahl der Feuchtigkeitsgrade wurde vorab experimentell
determining variable moisture contents in the samples is based evaluiert. Nach dem Zufügen des Wassers wurden insgesamt
on ISO 11465 [7]. First the moisture of the original samples fünf NIR-Spektren aufgenommen. Vor den einzelnen Scan-
was determined. Therefore the samples were weighed and dried Vorgängen wurde die Probe gemischt, um der variablen Posi
during 24 hours at a temperature of 105 °C in a laboratory-type tion der gröberen und feineren Partikel sowie der möglichen
drying cabinet.The dry net weight was determined immediately Heterogenität der Probe bei einem höheren oder geringeren
after having taken the samples out of the drying cabinet. Feuchtigkeitsgehalt Rechnung zu tragen. Die einzelnen NIR-
Spektren wurden aufgezeichnet, indem die Probe auf einer
Then the samples were allowed to cool down.Within this cool Drehscheibe platziert wurde, um die Situation auf dem Förder
ing period a sample starts to capture moisture from the ambient band annähernd nachzubilden (Bild 6). Nach der Aufzeichnung
60 70
Sample F-2/6 Sample F-2/6
50 60
Sample F-7/6 Sample F-7/6
Content [wt.-%]
Content [wt.-%]
50
40
40
30
30
20
20
10 10
0 0
>16 8-16 4-8 2-4 1-2 0.5-1 0.25- 500 250- 125- 90-125 63-90 45-63 32-45
Process Know-how
5 Tray containing sample material placed on a scale while spraying 6 Tray containing sample material placed on the turntable during
water across the sample NIR-measurement
Auf einer Waage platzierte Schale mit Probenmaterial, das mit Auf der Drehscheibe platzierte Schale mit Probenmaterial während
Wasser besprüht wird der NIR-Messung
air. The weight of the sample was determined again just before von fünf NIR-Spektren wurde die Probe erneut gewogen, um
the acquisition of the first spectra. For each moisture level a eventuelle Verdunstungseffekte während des Scannens zu be
defined amount of water was sprayed across the sample and rücksichtigen.
then the sample was weighed (Fig. 5). The number of moisture
levels has been evaluated experimentally in advance. After hav Für jeden Feuchtigkeitsgrad wurde der jeweilige Feuchtigkeits
ing added the water, a total of five NIR-spectra were acquired. gehalt des Materials ermittelt. Ausgehend vom Feuchtigkeits
Before each scan the sample was mixed in order to take into gehalt in g/100 g kann der effektive Prozentsatz der einzelnen
account the variable position of the coarser or finer particles chemischen Bestandteile der Proben wie folgt berechnet wer
and the possible heterogeneity of the sample containing more den:
or less moisture. Each NIR-spectrum was recorded by placing
the sample on a turntable to approximate the situation on the CaOeff = CaOtrocken · (1 - Feuchtigkeit/100)
conveyor belt (Fig. 6). After having recorded five NIR-spectra,
the sample’s weight was determined again in order to take into 4 Ergebnisse
account possible evaporation effects during scanning. Zur Erstellung der multivariaten Kalibrierungen wurde die
Partial Least Squares-Regressionsanalyse (PLS) [8] angewendet.
For every moisture level the corresponding moisture content Die Trainingsspektren wurden für jede Probe bei 8 verschie
of the material was determined. On the basis of the moisture denen Feuchtigkeitsgraden aufgenommen, ein Intervall von
content in g/100g the effective percentage of every chemical annähernd 0 % bis maximal ca. 9 % Feuchtigkeitsgehalt abde
component present in the samples can be calculated by: ckend. Die fünf verschiedenen Spektren für jeden Feuchtig
keitsgrad wurden arithmetisch gemittelt. Somit ist jede Probe
CaOeff = CaOdry · (1 - moisture/100) durch acht gemittelte Spektren repräsentiert. Folglich besteht
das Trainingsset aus insgesamt 152 Proben.
4 Results
The method of partial least squares (PLS) [8] was used to cre Das grobkörnige Material wurde ebenfalls bei variierenden
ate the multivariate calibrations. For each sample the training Feuchtigkeitsgraden mit einem Feuchtigkeitsgehalt zwischen
spectra were acquired at 8 different moisture levels, covering a 0 % und maximal 6,2 % gemessen. Einen höheren Feuchtig
range from approximately 0 % up to a maximum of about 9 % keitsanteil konnte das grobkörnige Material nicht absorbieren.
moisture content. The five distinct spectra per moisture level Die Proben des grobkörnigen Materials wurden nicht in das
were averaged arithmetically. Hence each sample is represented Trainingsset inkorporiert. Für die spezifischen auf dem fein
by eight averaged spectra. Thus, the training set contains a total körnigen Material basierenden multivariaten Kalibrierungen
number of 152 samples. wurden nur die Spektralbänder ausgewählt, von denen wir aus
früherer Erfahrung wussten, dass sie anstelle des vollständigen
The coarse-grained material was also measured at varying Spektrums einen erheblichen Beitrag zur Kalibrierung leis
moisture levels with a moisture content ranging between 0 ten. Es wurde eine Kreuzvalidierung durchgeführt, bei der ein
% and a maximum of 6.2 %. This was the maximum mois Block von acht Proben ausgelassen wurde.
ture level, which the coarse-grained material could absorb.
The coarse-grained material samples were not included in the Nachdem das Modell für den spezifischen Bestandteil feststand,
calibration training set. For the specific fine-grained material wurde das ausgewählte Modell auf die NIR-Spektren des grob
based multivariate calibrations only those spectral bands were körnigen Rohmaterials angewendet und die Vorhersagen wurden
chosen, of which we knew from past experience that they sig mit den jeweiligen Referenzwerten verglichen. Die Bilder 7–11
nificantly contribute to the calibration instead of the com fassen die Vorhersageergebnisse zusammen, die bei der Anwen
48 ZKG INTERNATIONAL No. 4-2011 www.zkg-online.info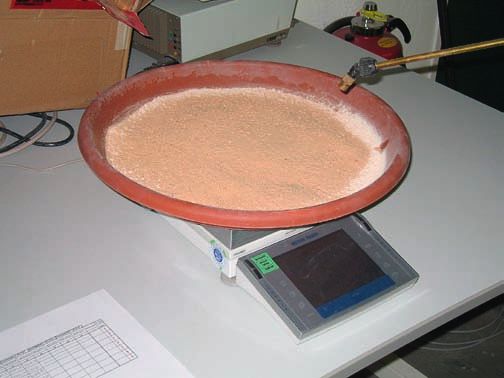
Process Know-how
60 40
Predicted SiO 2 [g/100g]
Predicted CaO [g/100g]
50 30
y = 1.0087x - 5.1542 y = 1.0076x + 4.1619
R 2 = 0.9062 R 2 = 0.9092
40 20
30 10
CaO Target Linear (CaO) SiO2 Target Linear (SiO2)
20 0
20 25 30 35 40 45 50 55 60 0 5 10 15 20 25 30
Reference CaO [g/100g] Reference SiO2 [g/100g]
7 Predictions for CaO based on NIR-spectra of coarse-grained 8 Predictions for SiO2 based on NIR-spectra of coarse-grained
material material
Vorhersagen für CaO auf der Grundlage der NIR-Spektren von Vorhersagen für SiO2 auf der Grundlage der NIR-Spektren von
grobkörnigem Material grobkörnigem Material
10 6
y = 1.064x + 0.4909
5
Predicted Al2O3 [g/100g]
Predicted Fe2O3 [g/100g]
8 R 2 = 0.9018
y = 1.0759x + 0.8007
R 2 = 0.9238 4
6
3
4
2
2
1
Al2O3 Target Linear (Al2O3) Fe2O3 Target Linear (Fe2O3)
0 0
0 1 2 3 4 5 6 7 8 0.0 0.5 1.0 1.5 2.0 2.5 3.0 3.5 4.0 4.5 5.0
Reference Al2O3 [g/100g] Reference Fe2O3 [g/100g]
9 Predictions for Al2O3 based on NIR-spectra of coarse-grained 10 Predictions for Fe2O3 based on NIR-spectra of coarse-grained
material material
Vorhersagen für Al2O3 auf der Grundlage der NIR-Spektren von Vorhersagen für Fe2O3 auf der Grundlage der NIR-Spektren von
grobkörnigem Material grobkörnigem Material
12 dung der einzelnen multivariaten Kalibrierungen auf die grob
körnigen Proben erzielt wurden. Die Abszisse entspricht dem
Predicted moisture [g/100g]
8 „wahren“ Gehalt an CaO, SiO2, etc., die Ordinate den vorher
y = 1.72x - 0.8
R 2 = 0.93 gesagten Werten. Die schwarze Linie entspricht einer Kleinste-
4 Quadrate-Approximation an die Vorhersagedaten und die pink
farbene Linie zeigt die Position einer fehlerfreien Vorhersage.
0
Diese Ergebnisse zeigen, dass eine erhebliche Veränderung des
-4
Moisture Target Linear (Moisture) Korngrössenbereichs sich hauptsächlich in einem Offset betref
Reference moisture [g/100g] fend der prozentualen Vorhersagen der Oxidgewichte für CaO,
SiO2, Al2O3 und Fe2O3 äussert. Im Fall der Feuchtigkeit ist der
Offset gering und die Steigung ist größer als Eins. Das fein
11 Predictions for moisture based on NIR-spectra of coarse-grained
material. körnige Material besitzt eine größere Gesamtoberfläche als das
Vorhersagen für die Feuchtigkeit auf der Grundlage der NIR-Spek- grobkörnige Material. Deshalb kann das feinkörnige Material
tren von grobkörnigem Material mehr Feuchtigkeit absorbieren als grobkörniges Material. Aus
diesem Grund neigt die Feuchtigkeits-Kalibrierung dazu, die
plete spectrum. Cross validation was used leaving out a block Feuchtigkeit im grobkörnigen Material mit zu hohen Werten
of eight samples. vorherzusagen.
Once the model for the specific constituent was determined, Die obigen Ergebnisse wurden für ein einziges Set multivaria
the selected model was applied to the NIR spectra of the ter Kalibrierungen erzielt. Die Ergebnisse von Korrelationsver
coarse-grained raw material and the predictions were com fahren können unter Umständen nicht immer verallgemeinert
pared to the corresponding reference values.The scatter plots of werden. Um sicherzustellen, dass die oben genannten Ergeb
Figs. 7–11 summarize prediction results when each multivariate nisse nicht zufällig sind, beschlossen wir, die Ergebnisse durch
calibration was applied to the coarse-grained samples. The ab zahlreiche multivariate Kalibrierungen für jede Komponente
scissa corresponds to the ‘true’ content of CaO, SiO2, etc. while zu verifizieren.
the ordinate corresponds to the predicted values.The black line
corresponds to a least squares fit to the prediction data and the Dazu verwendeten wir eine einfache kombinatorische Strategie.
pink line indicates the location of an error-free prediction. Unterschiedliche Spektralbänder wurden mit verschiedenen
ZKG INTERNATIONAL No. 4-2011 www.zkg-online.info 49Process Know-how
Tab. 2: Spectral intervals used within the present investigation • Bei der vorliegenden Untersuchung verwendete Spektralintervalle
Variation of the wavelength for the lower limit [nm] Variation of the wavelength for the upper limit [nm]
Variation der Wellenlänge für die untere Grenze [nm] Variation der Wellenlänge für die obere Grenze [nm]
Interval 1/Intervall 1 1180 to 1200/1180 bis 1200 1280 to 1300/1280 bis 1300
Interval 2/Intervall 2 1450 to 1510/1450 bis 1510 1690 to 1750/1690 bis 1750
Interval 3/Intervall 3 1890 to 2090/1890 bis 2090 2300 to 2500/2300 bis 2500
These results show that the percentage oxide weight predictions Vorverarbeitungstechniken kombiniert, die breite Anwendung
of CaO, SiO2, Al2O3 and Fe2O3 are primarily affected by offset in der NIR-Spektroskopie finden und in handelsüblicher Ka
effects when the particle size range of the samples is substan librierungssoftware enthalten sind.
tially altered. In the case of moisture, the offset is small but the
slope is higher than unity. The fine-grained material has a larger Im Rahmen dieser Untersuchung wurden drei Spektralinter
overall surface than coarse-grained material.Therefore the fine- valle verwendet. Ihre Grenzen variierten wie in Tabelle 2 an
grained material can absorb more moisture than coarse-grained gegeben. So wurden insgesamt 23���������������������������
��������������������������
716 verschiedene Spektral
material. So the moisture calibration used to predict the mois bereiche getestet, die jeweils aus drei sich nicht überlappenden
ture in the coarse-grained material tends to predict higher than Spektralbändern bestanden. Diese Spektralbereiche wurden mit
the actual values. den folgenden Signalvorverarbeitungstechniken kombiniert:
Spektrentransformation mittels SNV (Standard Normal Vari
The above results were obtained for a single set of multivariate ate) [9] mit oder ohne De-trending, entweder ohne Ableitung
calibrations. The results of correlation methods can not always oder mit einer numerischen Approximation nach Savitzky-Go
be generalized. In order to ensure that the above results are not lay [10] der ersten oder zweiten Ableitung unter Verwendung
fortuitous, it was decided to verify the above results by a multi von 17, 23, 31 oder 35 Glättungspunkten sowie Mittelwert
tude of multivariate calibrations per constituent. zentrierung oder einer Varianzskalierung.
For this purpose we employed a simple combinatorial strat All diese Methoden sind in handelsüblicher Kalibrierungssoft
egy. Different spectral bands were combined with a variety of ware enthalten. Unsere Referenz war GRAMS. Die Kombina
preprocessing techniques that are commonly applied in NIR- tion aller Varianten führte zu insgesamt 23���������������������������
��������������������������
716�����������������������
· ��������������������
3�������������������
· ����������������
(1+2������������
· ���������
4)�������
· ����
2=
spectroscopy and which are included in standard commercially 1�����������������������������������������������������������
����������������������������������������������������������
280�������������������������������������������������������
������������������������������������������������������
664 verschiedenen Versionen, die im Laufe der Untersu
available calibration software. chung getestet wurden.
Within the present investigation, three spectral intervals were Der PLS-1-Algorithmus, die verschiedenen Vorverarbeitungs
used. Their limits varied as indicated in Table 2. Thus, a total of algorithmen in Verbindung mit der Möglichkeit zum Variie
23 716 different spectral regions each consisting of three non- ren der Spektralbänder, ein Modul für die Kreuzvalidierung
overlapping spectral bands were tested. These spectral regions und ein Vorhersagemodul zur Beurteilung neuer, unbekannter
were combined with the following signal preprocessing tech Spektren wurden in Matlab implementiert. Bei der Implemen
niques: Standard Normal Variate transformation [9], with or tation wurde darauf geachtet, dass die numerische Kompatibili
without de-trending, with either no derivative or a Savitzky- tät mit dem im Handel erhältlichen Software-Paket PLSplusIQ
Golay numerical approximation [10] of the first or second de (GRAMS/AI, Thermo Scientific) erhalten blieb. Ein Rechen
rivative using 17, 23, 31 or 35 smoothing points plus mean ergebnis von Matlab stimmte in der Regel auf 6 bis 7 Stellen
centering or variance scaling. mit dem entsprechenden Rechenergebnis von GRAMS über
ein.
All these methods are included in commercial calibration soft
ware. Our reference was Grams. Combining all variants resulted Jede multivariate Kalibrierung, die mit den NIR-Spektren der
in a total of 23 716 · 3 · (1+2 · 4) · 2 = 1 280 664 different versions Proben des feinkörnigen Materials durchgeführt wurde, ver
that were tested in the course of the investigation. wendete die NIR-Spektren des grobkörnigen Materials dazu,
die Konzentration jener Komponenten vorherzusagen, denen
The PLS-1 algorithm, the different preprocessing algorithms unser Interesse galt. Diese Vorhersagen wurden mit den Re
combined with the possibility of varying the spectral bands, ferenzkonzentrationen dieser Proben verglichen. Der lineare
and modules for performing cross-validation and predicting Trend der Vorhersagen, d.h. die Steigung und der Offset ihrer
new unknown spectra were implemented in Matlab. During its linearen Kleinste-Quadrate-Approximation, wurde für jeden
implementation caution was exercised to maintain numerical der 1���������������������������������������������������
��������������������������������������������������
280�����������������������������������������������
����������������������������������������������
664 Fälle bestimmt. Die folgenden Histogramme
compatibility with the commercial software package PLSplusIQ zeigen die Steigungen der linearen Approximationen und den
(Grams/AI, Thermo Scientific). A Matlab computational re daraus resultierenden Offset der linearen Approximation der
sult was usually equal to 6- to 7-digits with the corresponding vier Hauptoxide CaO, SiO2, Al2O3 und Fe2O3.
Grams computational result.
Die Histogramme (Bilder 12–15) zeigen, dass für alle vier Oxide
Each multivariate calibration, which was done with the NIR die überwiegende Mehrheit der Steigungen in einem Bereich
spectra of the fine-grained material samples, used the NIR von +/-0,1 um den Wert 1 liegt. Dies bestätigt das anfäng
spectra of the coarse-grained material to predict the concen liche Ergebnis, dass die Anwendung einer Kalibrierung auf der
tration of the constituents of interest. These predictions were Grundlage von feinkörnigem Material auf Material, wie es tat
compared with the reference concentrations of these samples. sächlich aus dem Brecher kommt, sich in erster Linie in einem
The linear trend of the predictions, i.e. the slope and the offset Offset äussert.
50 ZKG INTERNATIONAL No. 4-2011 www.zkg-online.infoProcess Know-how
12 Ranges of values of offset and slope for CaO • Wertebereiche des Offsets und der Steigung für CaO
13 Ranges of values of offset and slope for SiO2 • Wertebereiche des Offsets und der Steigung für SiO2
14 Ranges of values of offset and slope for Al2O3 • Wertebereiche des Offsets und der Steigung für Al2O3
value of their linear least squares fit was determined for each of Für die Feuchtigkeit weist das Steigungshistogramm Werte auf,
the 1 280 664 cases. The subsequent histograms show the slopes die im Allgemeinen größer als Eins sind (Bild 16). Bei allen Be
of the linear fits and the resulting offset of the linear fit of the standteilen (CaO, SiO2, Al2O3, Fe2O3 und Feuchtigkeit) zeigte
4 key oxides, CaO, SiO2, Al2O3 and Fe2O3. sich, dass die Signalvorverarbeitung der entscheidende Faktor
für die Variation des Offsets ist.
The histograms (Figs. 12–15) show that for all four oxides the
great majority of the slopes lies within a band of +/-0.1 around
ZKG INTERNATIONAL No. 4-2011 www.zkg-online.info 51Process Know-how
15 Ranges of values of offset and slope for Fe2O3 • Wertebereiche des Offsets und der Steigung für Fe2O3
16 Ranges of values of offset and slope for moisture. • Wertebereiche des Offsets und der Steigung für die Feuchtigkeit
the value 1. This confirms the initial result that the effect of us 5 Fazit und Ausblick
ing a calibration based on fine-grained material on material as Die Anzahl der Tests ist groß genug, um die folgenden allge
it really comes out of the crusher is primarily an offset. meinen Schlussfolgerungen zu ziehen:
1) Bei der Verwendung multivariater Kalibrierungen auf der
In the case of moisture content, the slope histogram shows slope Grundlage von feinkörnigem Material zur Vorhersage der
values generally greater than unity (Fig. 16). All constituents (i.e. Konzentration von grobkörnigem Zementrohmaterial, wie
CaO, SiO2, Al2O3, Fe2O3 and moisture) showed that signal pre- es aus dem Brecher kommt, bleibt die Korrelation zwischen
processing is the key determining factor for the offset varia den Referenzwerten und den Vorhersagewerten in sehr
tions. hohem Maße erhalten.
2) Der Haupteffekt ist ein Offset, der von der jeweiligen Si
5 Conclusions and outlook gnalvorverarbeitungsmethode und den gewählten Spektral
The number of tests is large enough to permit the following bändern abhängt.
general conclusions: 3) Die zu den Vorhersagen der oxidischen Komponenten ge
1)�������������������������������������������������������������
When
�����������������������������������������������������������
using multivariate calibrations based on fine-grained hörenden Steigungen der Korrelationsgeraden zeigen ver
material to predict the concentration of coarse-grained ce gleichsweise geringe Abweichungen vom Zielwert 1.
ment raw material as it comes out of the crusher the correla 4) Feuchtigkeitskalibrierungen basierend auf feinkörnigem
tion between reference values and predicted values is pre Material zeigen bei sich erhöhendem Feuchtigkeitsgehalt
served to a very high degree. einen systematisch zu hohen Zuwachs in der Feuchtigkeits
2)����������������������������������������������������������������
The
��������������������������������������������������������������
main effect is an offset that depends on the distinct pre vorhersage für grobkörniges Material.
processing technique and the chosen spectral bands.
3)��������������������������������������������������������������
The
������������������������������������������������������������
slopes associated with the predictions of the oxide com Für die Praxis bedeutet dies, dass man bei einem On-Line NIR-
ponents in the coarse-grained material show comparatively Analysegerät feinkörnige Materialproben für die Grundkalib
small deviations from their target value of 1. rierung verwenden kann und sich die abschließende Anpassung
4)�������������������������������������������������������������
M�����������������������������������������������������������
oisture calibrations done with fine-grained material show beim tatsächlichen Rohmaterial auf die Korrektur des Offsets
that for increasing moisture contents the predictions of mois für die Oxide beschränkt. Im Falle der Feuchtigkeit müssen
52 ZKG INTERNATIONAL No. 4-2011 www.zkg-online.infoProcess Know-how
ture in coarse-grained material tend to systematically overpre Steigung und Offsets angepasst werden. Für die Durchführung
dict as the moisture level increases. dieser abschließenden Modellanpassung ist eine begrenzte An
zahl von Vor-Ort-Tests ausreichend. Feinkörnige Proben wer
The practical consequence is that for an NIR On Line Ana den bei Messkampagnen im Steinbruch sehr häufig aus Bohr
lyzer it is possible to use fine-grained material samples to do löchern gewonnen und stehen somit im Zementwerk ohnehin
the base calibration and the final adjustment to the actual raw zur Verfügung. Diese Vorgehensweise wurde beim SpectraFlow
material is limited to an offset correction for the oxides and a Analysegerät des Zementwerks in Raysut, Oman angewendet,
slope offset correction for moisture. A limited number of on dem die Autoren für die Bereitstellung der verschiedenen Pro
site tests are sufficient to do this final model adaptation. Fine- ben danken.
grained samples are very often obtained from boreholes during
a quarry campaign and are then already available at the cement www.abb.com
plant. This type of approach was used for the SpectraFlow ana
lyzer of the Raysut Cement company in Oman and the authors
would like to express their gratitude for the provision of the
various samples.
Literature/Literaturverzeichnis
[1] Hunt, G. R. & Salisbury, J. W. 1970 Visible and near-infrared spectra [6] Milliken, R. E. & Mustard, J. F. 2008 Estimating water content of
of minerals and rocks: I Silicate minerals. Modern Geology, vol. 1, hydrated minerals using reflectance spectroscopy II. Effects of parti
pp. 283-300. cle size. Icarus, vol. 189, pp. 574-588.
[2] Hunt, G. R. & Salisbury, J. W. 1971 Visible and near-infrared spec [7] DIN ISO 11465, Dezember 1996. Bodenbeschaffenheit – Bestim
tra of minerals and rocks: II Carbonates. Modern Geology, vol. 2, mung der Trockensubstanz und des Wassergehalts auf Grundlage
pp. 23-30. der Masse – Gravimetrisches Verfahren (ISO 11465:1993).
[3] Hunt, G. R. & Salisbury, J. W. 1971 Visible and near-infrared spectra [8] Martens, H., Næs,T. 1989 Multivariate Calibration.Wiley, Chiches
of minerals and rocks: III Oxides and Hydroxides. Modern Geology, ter.
vol. 2, pp. 195-205. [9] Barnes, R. J., Dhanoa, M. S., Lister, S. J. 1989 Standard Normal
[4] Næs, T., Isaksson, T., Fearn, T. & Davies, T. 2002 A User-Friendly Variate Transformation and De-trending of Near-Infrared Diffuse
Guide to Multivariate Calibration and Classification. IMPublica Reflectance Spectra. Applied Spectroscopy, vol. 43, no. 5, pp. 772-
tions. Chichester. ISBN 0 9528666 2 5. 777.
[5] Milliken, R. E. & Mustard, J. F. 2005 Quantifying absolute water [10] Savitzky, A. & Golay, M. J. E. 1964 Smoothing and Differentiation of
content of minerals using near-infrared reflectance spectroscopy. Data by Simplified Least Squares Procedures. Analytical Chemistry,
Journal of Geophysical Research, vol. 100, E12001, pp. 1-25. vol. 36, no. 8, pp. 1627-1639.
ZKG INTERNATIONAL No. 4-2011 www.zkg-online.info 53Sie können auch lesen