Landbauforschung Applied Agricultural and Forestry Research - Vol. 64 No. 1 03.2014
←
→
Transkription von Seiteninhalten
Wenn Ihr Browser die Seite nicht korrekt rendert, bitte, lesen Sie den Inhalt der Seite unten
Landbauforschung
Applied Agricultural
and Forestry Research
Vol. 64
No. 1 · 03.2014
Landbauforschung                                          Applied Agricultural and Forestry Research

Landbauforschung Applied Agricultural and Forestry        Landbauforschung Applied Agricultural and Forestry
Research ist eine wissenschaftliche Zeitschrift, in der   Research is a scientific journal, concerning about the
Forschungsergebnisse zu gesellschaftlich relevanten       latest research results of socially relevant issues
Themen veröffentlicht werden, die einen Bezug zur         related to agriculture, forestry and rural development.
Landwirtschaft, zur Forstwirtschaft und zur ländlichen    The journal is targeted explicitly to interdisciplinary
Entwicklung aufweisen. Die Zeitschrift ist damit          topics.
explizit disziplinenübergreifend ausgerichtet.
                                                          Particularly welcome are application-oriented
Erwünscht sind insbesondere anwendungsorientierte         scientific contributions with an interdisciplinary
wissenschaftliche Beiträge, die interdisziplinär ange-    approach or have a close connection with other
legt sind oder die ausgeprägte Bezugspunkte zu an-        research areas.
deren Fachdisziplinen aufweisen.
                                                          The geographical focus of the journal is Germany and
Der geographische Fokus der Zeitschrift liegt auf         Europe.
Deutschland und Europa.
Landbauforschung Applied Agricultural and Forestry        Landbauforschung Applied Agricultural and Forestry
Research wird vom Thünen-Institut herausgegeben           Research is published by the Thünen Institute and
und erscheint vierteljährlich. Die Beiträge unterliegen   appears quarterly. Contributions are subject to a
einer doppelt-anonymen Begutachtung (double               double blind peer review. Articles may be written in
blind peer review). Sie können in Englisch oder           English or German.
Deutsch verfasst sein.
                                                          Authors are responsible for the content of their
Für den Inhalt der Beiträge sind die Autoren/Autorin-     articles. The publishers are not liable for the content.
nen verantwortlich. Eine Haftungsübernahme durch
die Redaktion erfolgt nicht.                              With the submission of a manuscript, the authors
                                                          grant permission for publication. The guidelines for
Mit der Einsendung von Manuskripten geben die Ver-        the submission of manuscripts can be found under
fasser/Verfasserinnen ihre Einwilligung zur Veröffent-    www.ti.bund.de/landbauforschung or obtained from
lichung. Die von den Autoren/Autorinnen zu beach-         the publishers.
tenden Richtlinien zur Einreichung der Beiträge sind
unter www.ti.bund.de/landbauforschung oder bei der        Indexed in: CAB International, Science Citation Index
Geschäftsführung erhältlich.                              Expanded, Current Contents – Agriculture, Biology &
                                                          Environmental Sciences, Scopus, Web of Science.
Indexiert in: CAB International, Science Citation Index
Expanded, Current Contents – Agriculture, Biology &       Publisher
Environmental Sciences, Scopus, Web of Science.           Johann Heinrich von Thünen Institute
Herausgeber
Johann Heinrich von Thünen-Institut                       Editor in Chief
                                                          Prof. Dr. Andreas Bolte,
Schriftleitung                                            Prof. Dr. Peter Weingarten
Prof. Dr. Andreas Bolte,
Prof. Dr. Peter Weingarten                                Managing Editor
                                                          Dr. Matthias Rütze
Geschäftsführung                                          Phone +49 40 - 73962 247
Dr. Matthias Rütze                                        Leuschnerstraße 91
Tel. +49 (0) 40 - 73962 247                               21031 Hamburg, Germany
Leuschnerstraße 91                                        landbauforschung@ti.bund.de
21031 Hamburg, Germany                                    www.ti.bund.de
landbauforschung@ti.bund.de
www.ti.bund.de                                            Graphic Design and Typesetting
                                                          Karin Tamoschat-Depolt, Thünen Institute
Grafikdesign und Satz                                     Heidrun Fornahl, Thünen Institute
Heidrun Fornahl, Thünen-Institut
Karin Tamoschat-Depolt, Thünen-Institut                   Photos cover pages
Fotos Umschlagseite                                       Katja Seifert, Thünen Institute (2),
Katja Seifert, Thünen-Institut (2),                       Michael Welling, Thünen Institute (1)
Michael Welling, Thünen-Institut (1)
                                                          ISSN 0458-6859
ISSN 0458-6859
                                                          Printed on FSC-certified paper
Gedruckt auf FSC-zertifiziertem Papier
                                                          All rights reserved.
Alle Rechte vorbehalten.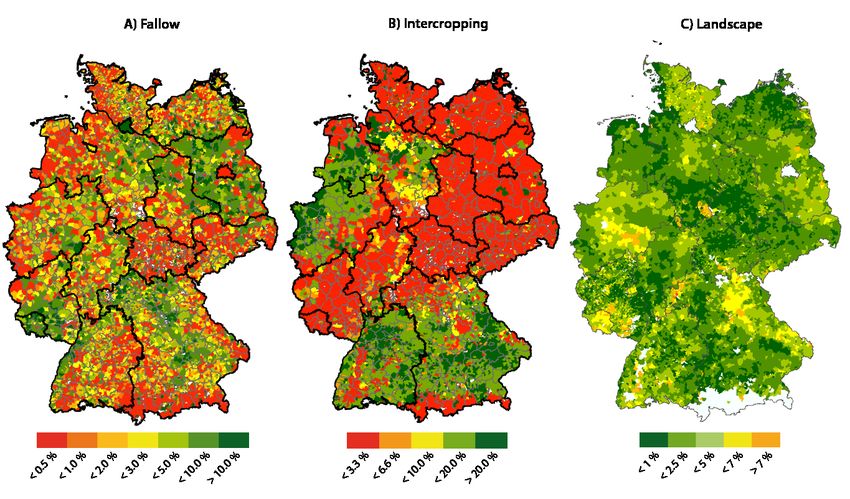
Landbauforschung
Applied Agricultural and Forestry Research
Vol. 64 No. 1 03.2014

Inhalt
Content

       Frank Offermann, Claus Deblitz, Burkhard Golla, Horst Gömann, Hans-Dieter Haenel, Werner Kleinhanß, Peter Kreins,
       Oliver von Ledebur, Bernhard Osterburg, Janine Pelikan, Norbert Röder, Claus Rösemann, Petra Salamon, Jürn Sanders
       and Thomas de Witte
       Thünen-Baseline 2013-2023: Agri-economic projections for Germany
1      Thünen-Baseline 2013-2023: Agrarökonomische Projektionen für Deutschland

       Andrea Machmüller und Albert Sundrum
       Der Einfluss länderspezifischer Berechnungsverfahren auf den betrieblichen Nährstoffvergleich gemäß
       Düngeverordnung
       The effect of German federal state-specific calculation methods on the farm nutrient comparison according to
17     the German fertilizer application ordinance

       Annkathrin Gronle, Herwart Böhm and Jürgen Heß
       Effect of intercropping winter peas of differing leaf type and time of flowering on annual weed infestation in
       deep and shallow ploughed soils and on pea pests
       Einfluss des Mischfruchtanbaus von Wintererbsen mit unterschiedlichen Blatttypen und Blütezeitpunkten auf
31     das annuelle Unkrautaufkommen in tief- und flachwendend bearbeiteten Böden und auf Erbsen-Schädlinge

       Tasja Kälber and Kerstin Barth
       Practical implications of suckling systems for dairy calves in organic production systems – a review
       Praktische Konsequenzen Mutter- bzw. Ammen-gebundener Aufzuchtsysteme für Kälber in der ökologischen
45     Milchviehhaltung – eine Übersicht
F. Offermann, C. Deblitz, B. Golla, H. Gömann, H.-D. Haenel, W. Kleinhanß, P. Kreins, O. v. Ledebur, B. Osterburg, J. Pelikan, N. Röder,
C. Rösemann, P. Salamon, J. Sanders and T. de Witte · Landbauforsch · Appl Agric Forestry Res · 1 2014 (64)1-16
                                                                                                                                              1
DOI:10.3220/LBF_2014_1-16

Thünen-Baseline 2013-2023:
Agri-economic projections for Germany

Frank Offermann*, Claus Deblitz*, Burkhard Golla*****, Horst Gömann**, Hans-Dieter Haenel****,
Werner Kleinhanß*, Peter Kreins**, Oliver von Ledebur***, Bernhard Osterburg**, Janine Pelikan***,
Norbert Röder**, Claus Rösemann****, Petra Salamon***, Jürn Sanders* and Thomas de Witte*

Abstract                                                                           Zusammenfassung
This article presents selected results of the Thünen-Baseline                      Thünen-Baseline 2013-2023: Agraröko-
as well as the assumptions upon which these results are                            nomische Projektionen für Deutschland
based. The Thünen-Baseline is established using and com-
bining several models of the Thünen model network. It pro-                         Die Thünen-Baseline 2013 bis 2023 ist eine auf den deutschen
vides a reference scenario for the analysis of the impacts of                      Agrarsektor fokussierte modellgestützte Projektion der
alternative policies and developments. The projections are                         erwarteten Entwicklungen auf der Grundlage der im Winter
based on data and information available as of winter 2013/14.                      2013/14 vorliegenden Daten und Informationen. Sie stellt
The baseline assumes a continuation of the current policy                          eine Referenzsituation für die Analyse von Auswirkungen
framework and the implementation of already decided poli-                          alternativer Politiken und Entwicklungen dar. Die Thünen-
cy changes. For the Thünen-Baseline 2013 to 2023, this                             Baseline geht von einer Beibehaltung der derzeitigen Agrar-
implies the implementation of the EU-CAP reform decided in                         politik bzw. der Umsetzung bereits beschlossener Politik-
2013 and its national implementation according to the deci-                        änderungen aus. Für die vorliegende Baseline bedeutet dies
sions made at the German Ministers of Agriculture confer-                          im Wesentlichen die Umsetzung der 2013 beschlossenen
ence.                                                                              Reform der Europäischen Agrarpolitik und ihrer nationalen
     Overall, the Thünen-Baseline 2013 to 2023 draws a pic-                        Umsetzung entsprechend des Beschlusses der deutschen
ture of a competitive agricultural sector in Germany, which                        Agrarministerkonferenz.
adapts well to the changes of the latest policy reform and                             Insgesamt zeichnet die Thünen-Baseline 2013 bis 2023
seizes the opportunities for expanding production, especial-                       das Bild einer wettbewerbsstarken Landwirtschaft in
ly in the dairy sector. On the other hand, the projections also                    Deutschland, die sich gut an die Veränderungen der jüngs-
highlight that – under the assumptions made and with                               ten Agrarreform anpasst und die Möglichkeiten zur Produk-
unchanged policy conditions – the problems that may                                tionsausdehnung, insbesondere im Milchbereich, wahr-
accompany intensive livestock production will not simply                           nimmt. Auf der anderen Seite zeigen die Projektionen, dass
dissolve. In contrast, in view of the projected high profitabili-                  sich unter den getroffenen Annahmen und unveränderten
ty of intensive pig and poultry production the related chal-                       politischen Rahmenbedingungen die Probleme, die sich aus
lenges could increase.                                                             der intensiven Tierproduktion ergeben können, nicht im
                                                                                   Zeitablauf „von selbst“ lösen, sondern im Gegenteil ange-
Keywords: agricultural policy, impact assessment, modelling,                       sichts der projizierten Rentabilität der Veredlungsproduktion
Germany                                                                            weiter an Bedeutung gewinnen könnten.

                                                                                   Schlüsselwörter: Agrarpolitik, Politikfolgenabschätzung,
                                                                                   Modellierung, Deutschland

*     Johann Heinrich von Thünen Institute, Institute of Farm Economics, Bundesallee 50, 38116 Braunschweig, Germany
**    Johann Heinrich von Thünen Institute, Institute of Rural Studies, Bundesallee 50, 38116 Braunschweig, Germany
***   Johann Heinrich von Thünen Institute, Institute of Market Analysis, Bundesallee 50, 38116 Braunschweig, Germany
**** Johann Heinrich von Thünen Institute, Institute of Climate-Smart Agriculture, Bundesallee 50, 38116 Braunschweig, Germany
***** Julius Kühn Institute, Institute for Strategies and Technology Assessment, Stahnsdorfer Damm 81, 14532 Kleinmachnow, Germany

      Contact: frank.offermann@ti.bund.de
2 F. Offermann, C. Deblitz, B. Golla, H. Gömann, H.-D. Haenel, W. Kleinhanß, P. Kreins, O. v. Ledebur, B. Osterburg, J. Pelikan, N. Röder, C.
Rösemann, P. Salamon, J. Sanders and T. de Witte · Landbauforsch · Appl Agric Forestry Res · 1 2014 (64)1-16
1 Introduction linkages between markets and actors. MAGNET is based on a
simultaneous system of non-linear equations, which ensure
This article presents and discusses selected results of the an equilibrium in the model and the identity between expens-
Thünen-Baseline 2013 to 2023 as well as the assumptions es and income. Behavioural equations describe the economic
upon which these results are based.1 The projections are activities of different actors (for example, consumers and pro-
based on data and information available as of winter 2013/14. ducers). Product demand, product supply and factor demand
It is important to stress that the Thünen-Baseline is not a fore- functions are specified so that consumers and producers
cast about the future. Rather, the baseline describes expect- maximize their utility or profit. Linking supply and demand,
ed developments should the current agricultural policy be the model endogenously determines prices and quantities
continued in accordance with specific assumptions about that lead to balanced product and factor markets. Trade mod-
the development of exogenous influences. The Thünen-Base- elling differentiates products by origin based on the Arming-
line thus serves as a reference scenario for analyses of the ton assumption (Armington, 1969) and considers transport
impacts of alternative policies and developments. It comple- requirements, and describes trade structure in the form of a
ments the more general and highly aggregated results of the matrix of bilateral trade flows (see Hertel and Tsigas, 1997).
baseline reports of the EU-Comission (2013) and the OECD- The GTAP data base 8.2 used for this study includes 57 sectors
FAO (2013) by offering a detailed picture of the projected sit- and 129 regions for the base year 2007 (https://www.gtap.
uation of German agriculture in 2023, taking into account agecon.purdue.edu/databases/v8/v8_doco.asp).
national policies. AGMEMOD (http://www.agmemod.eu) is a partial, multi-
The assumptions for the development of the exogenous national, multiple-product model based on econometrically
factors and the agricultural policy conditions selected for the estimated parameters and a recursive-dynamic approach. It
baseline were chosen in close consultation with experts from covers production, consumption, trade, inventories and pric-
the German Ministry of Food and Agriculture. Preliminary es for 20 agricultural and 17 processing sectors of the EU
baseline results were discussed with representatives from member states, accession candidates and other neighbour-
the federal as well as Länder ministries. This approach ing countries. The German model provides a detailed repre-
enabled the integration of expert knowledge as well as the sentation of grains and oilseed, potatoes, cattle and calves,
definition of a scenario that is widely accepted as a relevant sheep, pigs, poultry and milk as well as their processed prod-
basis for further policy impact analyses. ucts (Salamon and von Ledebur, 2005). Coupled with each
other and the appropriate world markets, the models create
a combined EU Model for the individual EU Member States
2 Methodology (van Leeuwen et al., 2011). In the present model, version 7,
the world markets are endogenous, but calibrated to fit to
The Thünen-Baseline is established using and combining the OECD price projections (OECD-FAO, 2013). The data base
several models of the Thünen model network. The Thünen covers the years 1973 to 2012.
model network connects farm, regional and sector partial The regionalized agricultural and environmental infor-
and general equilibrium models for the joint application for mation system RAUMIS (Henrichsmeyer et al., 1996) is
policy impact assessments. With the help of the model net- employed to analyze medium and long-term agricultural
work, the impacts of a wide range of trade, agricultural and and environmental policy impacts. The model consolidates
environmental policies on various facets of the agricultural various agricultural data sources with the national agricultur-
sector, e.g. markets, production, environment, income, can al accounts as a framework of consistency. It comprises of
be analyzed at different levels (Figure 1). In the analysis, a more than 50 agricultural products, 40 inputs with exoge-
coordinated, parallel and/or iterative implementation of the nously determined prices, and reflects the German agricul-
model takes place. This implementation allows for the align- tural sector with its sector linkages. According to data avail-
ment of important assumptions, the exchange of model ability, the spatial differentiation is based on administrative
results as a basis for other models of the network, and the bodies, i.e., 326 regions (NUTS III level) treated as single
reciprocal check of the model results. This approach aims at „region farms.” Production adjustments caused by changes in
providing a consistent overall result. The databases and char- the general framework conditions such as agricultural poli-
acteristics of models used for the establishment of the cies are determined by using a comparative-static mathe-
Thünen-Baseline 2013 to 2023 are briefly described below. matical programming approach that maximizes a non-linear
The MAGNET model (Modular Applied GeNeral Equilibri- objective function for regional farm income. The model is
um Tool) is a multiregional, general equilibrium model cover- calibrated to observed production decisions using a positive
ing global economic activity as well as single countries and mathematical programming approach (Howitt, 1995; Cypris,
regions (Woltjer et al., 2013). It provides a detailed representa- 2000). Model base years are available in four-year intervals
tion of the interactions between agriculture, the input sector from 1979 to 2010.
and the food industry as well as commercial economics and Farm level aspects are covered by FARMIS, a process-ana-
the service sector, and accounts for the intra- and interregional lytical programming model for farm groups (Osterburg et al.,
2001; Offermann et al., 2005; Deppermann et al., 2013) based
on information from the farm accountancy data network
1 The full report with detailed results is published in German as Offermann
et al. (2014).
(FADN). Production is differentiated for 27 crop and 15F. Offermann, C. Deblitz, B. Golla, H. Gömann, H.-D. Haenel, W. Kleinhanß, P. Kreins, O. v. Ledebur, B. Osterburg, J. Pelikan, N. Röder,
C. Rösemann, P. Salamon, J. Sanders and T. de Witte · Landbauforsch · Appl Agric Forestry Res · 1 2014 (64)1-16
3
Coverage World economy Agric. markets German agricultural sector Worldwide
Model MAGNET AGMEMOD GAS-EM RAUMIS FARMIS agri benchmark
Aggregation level Global economic framework
World
EU
Price changes
- Member states
Germany
Production change
Sector Aggre-
- Counties County farms
constraints gation
Farm Adaptive
- Farms Farm groups
adaptions behaviour
Typical
farms
Main focus for Agricultural Prices and Environment Adjustment
Supply Income
Thünen-baseline trade demand (Gas emissions) strategies
Regional focus of the respective model for the Thünen-Baseline.
Figure 1
The use of models of the Thünen model network for the establishment of the Thünen-Baseline 2013 - 2023
livestock activities. The matrix restrictions cover the areas of For the projection of greenhouse gas and ammonia emis-
feeding (energy and nutrient requirements, calibrated feed sions from agriculture in the baseline scenario, the Thünen
rations), intermediate use of young livestock, fertilizer use model network is linked to the model GAS-EM. GAS-EM is a
(organic and mineral), labour (seasonally differentiated), modular spreadsheet programme to estimate gaseous and
crop rotations and political instruments (e.g., set-aside and particulate emissions from animal agriculture and crop pro-
quotas). The model is calibrated to observed production duction including professional horticulture. GAS-EM was first
decisions and elasticities using a positive mathematical pro- described in Dämmgen et al. (2002) and has been developed
gramming approach. For this study, the model specification further continuously since then. The assessment of emissions
is based on data from the accounting years 2009/10, 2010/11 within GAS-EM uses the definitions of agriculture according
and 2011/12. The farm sample was stratified by region, type, to the definitions of IPCC. All calculation procedures involved
system and size, resulting in 646 farm group models (of are based on the rules provided by the respective conven-
which 90 groups represent organic farming). Results are tions and the current guidance documents. In addition, the
aggregated to the sector using farm group specific weight- German agricultural inventory uses differing methods in spe-
ing factors. To account for structural change, econometrically cific circumstances in order to improve the description of
estimated farm exit probabilities were applied to the aggre- national emission conditions (Haenel et al, 2014). It is used to
gation factors for the projection. Within regions, farms com- generate the official National Emission Inventory Reports for
pete for land on rental markets (Bertelsmeier, 2005). Germany. For this study, the projections of gaseous emis-
TIPI-CAL und TYPICROP are accounting models applied sions in 2023 are based on the RAUMIS projections for land
within the framework of the global agri benchmark network use and livestock numbers in the baseline scenario.
(www.agribenchmark.org). They represent in detail produc- For the analysis of the impact of the new greening
tion technology and physical interrelationships at farm level. requirements (see section 3.2), the extent of existing land-
As part of the model network, these models are mainly used scape elements was established based on the ATKIS ‘Basic
to analyze the impacts of changes in policy, economic, and Landscape Model’ (ATKIS Basic DLM). The ATKIS describes the
regulatory framework on selected farms, and to investigate topographic features of the landscape in vector format. The
the financial consequences of different alternative farm features are assigned to a certain feature type and defined on
adjustments and development strategies. The database the basis of their spatial position, their geometrical type,
comprises typical farms, which are established based on a descriptive attributes and relations to other objects (rela-
globally harmonized Standard Operating Procedure togeth- tions) (AdV, 2008).
er with more than 40 partners in different countries. Data are Spatial analysis of ATKIS adopts a method used to estab-
collected annually, and the validation of results and specifi- lish the ‘Index of regional proportions of ecotones’ (Enzian
cation of adjustment strategies is done in cooperation with and Gutsche, 2004). Since 2002 this GIS-based register is
farmers and advisors. established in German pesticide risk management. It adjusts4 F. Offermann, C. Deblitz, B. Golla, H. Gömann, H.-D. Haenel, W. Kleinhanß, P. Kreins, O. v. Ledebur, B. Osterburg, J. Pelikan, N. Röder, C.
Rösemann, P. Salamon, J. Sanders and T. de Witte · Landbauforsch · Appl Agric Forestry Res · 1 2014 (64)1-16
pesticide risk mitigation measures for differences in land- made at the German Ministers of Agriculture conference. The
scape composition according to the amount of semi-natural most important policy assumptions of the baseline can be
habitats. The method involves a topological analysis of the summarised as follows:
landscape features and the land use/land cover (LULC) types
represented by ATKIS. It allows the identification and quantifi- t Trade policy framework: The baseline accounts for the EU
cation of transition areas between LULC types and landscape accession of Croatia, and numerous bilateral trade agree-
features. Transition areas are grouped into (1) transition areas ments which will be implemented over the following
with direct proximity of two LULC types (e.g. the zone years (e.g. with countries in South America and North Afri-
between a crop field and grassland, crop field and settlement, ca and the Balkan states).
crop field and forest) and (2) indirect proximity of two LULC t Price and quota policies: EU regulation No. 1308/2013 fore-
types interrupted by streams, ditches, hedges, roads etc. sees a safety net with public intervention mechanisms for
selected products. In addition, the EU commission has at its
disposal a reserve fund for crisis prevention and manage-
3 Assumptions ment measures, to be able to react to general market dis-
turbances. The Thünen-Baseline presumes that neither
3.1 General economic framework these measures nor export support for milk products are
The Thünen-Baseline 2013 to 2023 builds on external projec- applied during the projection horizon due to the prevailing
tions for macroeconomic developments from 2013 to 2023, world market conditions. The baseline scenario takes into
as compiled in secondary sources like the USDA (2011, 2012). consideration the stepwise increase of the milk quota until
The baseline scenario is characterized by an annual growth 2013/14 and its abolishment in 2015. The sugar market
of the world economy of 3.3 %, and a more modest growth in reform is implemented based on the study by Gocht et al.
Germany (1.75 % p. a.). World population growth is projected (2012), and covers the end of the quota regime in 2017
to increase by 1 % p. a., while the population in Germany is while maintaining border protection. In view of the OECD-
slightly declining (-0.2 % p. a.). The baseline scenario assumes FAO projection of world market prices, an EU-internal sugar
that the Euro continuously gains in value compared to the price of 390 €/t in 2023 results from these calculations.
US-Dollar, resulting in an exchange rate of 1.41 $/€ in 2023 t Direct payments of the first CAP pillar: The redistribution
(EU-Commission, 2013). As international trade mostly takes of funds between EU member states, the national redistri-
place in US-Dollar, this lowers world market prices from the bution of 4.5 % of the budget to the second pillar, and
point of countries of the Eurozone. support for young farmers lead to a base payment of
Inflation in Germany remains low at 1.7 % p. a. Agricultural 175 €/ha and a greening payment of 85 €/ha. To support
land in Germany is assumed to continue to be lost at an annu- smaller farms, a top-up is granted of 50 €/ha for the first
al rate of -0.1 %, accompanied by structural change at historic 30 ha and 30 €/ha for the next 16 ha.
rates with a decline of farm numbers by -3.4 % each year. The t Greening: Eligibility for a part of the direct payments de-
assumptions for the development of input prices in Germany pends on the fulfillment of the so-called ‘greening’ require-
are generally based on historical trends from 2003 to 2012. ments. These comprise protection of permanent grasslands,
For energy inputs, the oil price projections used in the OECD- minimum crop diversity and provision of ecological focus
FAO-outlook (2013) are applied, which imply continuously areas (EFA). For the Thünen-Baseline it is assumed that the
high price increases (+3.1 % p. a). Due to the high importance share of EFA remains fixed at 5 % of arable area throughout
of energy costs for the production of nitrogen fertilizers, fertil- the projection period, and that all options for elements
izer prices were also linked to the price forecasts of oil. counting as ecological focus area are accepted in Germany.
World market price projections2 for agricultural products t Support measures of the second CAP pillar: The cut of EU
from the OECD-FAO (2013) are used as a calibrated basis in funds for second pillar measures in Germany is compen-
the AGMEMOD model to establish price developments in the sated by the national redistribution of funds from the first
EU and Germany. For the projection period international pillar. The baseline assumes that the distribution to indi-
prices for livestock products, expressed in Euro, rise further vidual measures remains unchanged compared to the
(+10 % to +30 %) compared to the already high price level in previous finance period.
2009 to 2011, whereas world market prices for crop products t Support for bioenergy: Electricity stemming from biogas
decrease slightly. is supported in Germany by the Renewable Energy Sourc-
es Act (EEG), which guarantees a certain price for electric-
ity generated from renewable energy sources. It is expect-
3.2 Policy framework ed that the amendment to the EEG in 2012 will slow down
The baseline assumes a continuation of the current policy the expansion of biogas plants (Gömann et al., 2013),
framework and the implementation of already decided policy leading to a demand for 1.2 million ha of energy maize in
changes. For the Thünen-Baseline 2013 to 2023, this implies 2023. Taking into account projections for fuel demand, it
the implementation of the EU-CAP reform decided in 2013 is assumed that the new policy framework will reduce
and its national implementation according to the decisions demand for biofuels until 2015, with only a modest
increase in the following years, whereas demand for etha-
2 All price developments refer to nominal prices. nol from cereals remains constant.F. Offermann, C. Deblitz, B. Golla, H. Gömann, H.-D. Haenel, W. Kleinhanß, P. Kreins, O. v. Ledebur, B. Osterburg, J. Pelikan, N. Röder,
C. Rösemann, P. Salamon, J. Sanders and T. de Witte · Landbauforsch · Appl Agric Forestry Res · 1 2014 (64)1-16
5
4 Results A regional disaggregation (Figure 3) shows that EU-exports
increase to all regions with the exception of the Commonwealth
4.1 Changes in agricultural trade pattern of Independent States (CIS). Exports to CIS-countries are pro-
Macroeconomic developments as well as changes in the jected to stagnate as a consequence of expected population
political framework (e.g. the implementation of bilateral decline and the related impacts on demand. Imports from Cen-
trade agreements, the end of milk and sugar quota regimes, tral and South America, Asia and Africa increase markedly due
biofuel targets) influence trade flows in the baseline. Figure 2 to the implementation of trade agreements with the EU, which
provides an overview of the changes in world trade between offer export opportunities for the respective countries. Imports
2010 and 2023. Total agricultural exports increase from from North America and Oceania do not change significantly.
702 bn € in 2010 to 843 bn € in 2023. The share of EU-28 inter-
nal-trade as a percentage of world agricultural trade decreas- 4.2 Farm gate prices
es from 30 % to 26 %. EU exports to non-EU countries increase In addition to world market prices and macroeconomic
slightly from 70 bn € to 76 bn €. developments, the (politically influenced) demand for
1,000 20
EU28 share of world trade
EU28 internal trade
EU28 export to non-EU countries
800 World agricultural exports (excl. EU exports)
15
600
Share in %
billion €
10
400
5
200
0 0
2010 2015 2020 2023
Source: Own calculations with MAGNET (2014).
Figure 2:
Agricultural world trade and share of EU-28 (exports)
Agricultural exports Agricultural imports
45 45
2010 2023
40 40
35 35
30 30
25 25
billion €
billion €
20 20
15 15
10 10
5 5
0 0
North Africa Asia Central CIS Australia Rest North Africa Asia Central CIS Australia Rest
America and South and New of the America and South and New of the
America Zealand World America Zealand World
Source: Own calculations with MAGNET (2014).
Figure 3:
Agricultural exports and imports of EU-28 in 2010 and 20236 F. Offermann, C. Deblitz, B. Golla, H. Gömann, H.-D. Haenel, W. Kleinhanß, P. Kreins, O. v. Ledebur, B. Osterburg, J. Pelikan, N. Röder, C.
Rösemann, P. Salamon, J. Sanders and T. de Witte · Landbauforsch · Appl Agric Forestry Res · 1 2014 (64)1-16
biofuels and biogas is a further important determinant of however not be projected with the equilibrium models used
prices for agricultural products in Germany. for this study. In the subsequent period until 2023, prices for
Wheat prices are projected to decrease slightly during milk products are projected to remain stable despite the
the beginning of the projection period (Figure 4), and then anticipated production increase, due to a persistent demand
remain constant at around 200 €/t, thus being significantly from abroad. The farm gate price for milk stands at 33 €/100 kg
higher than intervention prices. Feed cereal (e.g. maize, bar- milk with 3.7 % fat and 3.4 % protein (excluding VAT). Prices
ley) prices stabilize at the comparatively high level of approx- for cheese increase, not least due to rising production costs.
imately 170 €/t. World market developments support prices Whole milk powder production is expanded following an
for rapeseed in Germany. Therefore, despite the drop in increased demand from Asia, which towards the end of the
domestic demand for rapeseed for biofuels, the decrease of projection period diminishes the price differentiation
the rapeseed price is moderate and prices remain rather con- between whole and skimmed milk powder. The butter price
stant at 370 €/t. This means that the rapeseed price is signifi- in Germany follows world market trends and remains com-
cantly lower than in the record year 2012, but 11 % higher paratively stable after 2015.
than during the period 2009 to 2011.
Solid demand from the world market leads to an increase
in nominal prices for livestock products of 10 to 30 % in 2023 4.3 Agricultural production
compared to the period 2009 to 2011. In Germany, an Table 1 provides an overview of the development of land use
increase in beef production as a consequence of higher dairy and agricultural production in the Thünen-Baseline. Despite
cow numbers following the end of the quota regime damp- the projected increase of cereal prices by about 27 % in 2023
ens the price development for beef. The broiler prices shown compared to the average of the period 2009 to 2011, cereal
in Figure 4 represent wholesale prices. The prices on farm area decreases slightly (-7 %). This is due to the increase of
gate level are expected to rise less dynamically due to an energy maize to approximately 1.2 million ha, and the con-
assumed substantial increase in the trade margin that could tinuing loss of agricultural land. Within the cereal produc-
already be observed in the past. tion, there is a marked shift to wheat growing, with a decrease
The developments in the dairy sector are strongly influ- of the area used for more extensively grown cereals like sum-
enced by the end of the quota scheme. Despite currently mer barley. This shift in cropping structure and the increase
quite strong world market prices, a decrease of prices until of yields over time lead to an increase of cereal production by
2015/16 can be expected. The extent of this decrease can approximately 50 million t by 2023, despite the smaller
Table 1
Development of production, land use and income in German agriculture
1999 2007 2010 Baseline Baseline
2023 2023 vs. 2009/11
Unit Absolute in %
Land use
Cereals 1,000 ha 6,840 6,830 6,662 6,184 -7
Wheat 1,000 ha 2,706 3,131 3,257 3,607 11
Barley 1,000 ha 2,196 1,948 1,706 1,378 -19
Rye 1,000 ha 851 664 667 452 -32
Oilseeds 1,000 ha 1,137 1,408 1,409 1,369 -3
Potatoes 1,000 ha 298 270 259 297 15
Pulses and root crops 1,000 ha 804 732 731 680 -7
Silage maize 1,000 ha 1,203 1,017 1,050 1,027 -2
Other arable fodder 1,000 ha 469 599 750 688 -8
Energy maize 1,000 ha 51 444 809 1,217 50
Set aside 1 1,000 ha 720 593 244 601 146
Cattle 1,000 head 14,831 12,749 12,772 12,951 1
of which: Dairy cows 1,000 head 4,765 4,123 4,191 4,308 3
Milk production2 1,000 t 26,768 28,057 30,051 35,372 18
Beef and veal production 1,000 t 1,396 1,136 1,221 1,207 -1
1
Incl. unused grasslands.
2
Actual fat and protein content.
Source: Own calculations with RAUMIS (2014).F. Offermann, C. Deblitz, B. Golla, H. Gömann, H.-D. Haenel, W. Kleinhanß, P. Kreins, O. v. Ledebur, B. Osterburg, J. Pelikan, N. Röder,
C. Rösemann, P. Salamon, J. Sanders and T. de Witte · Landbauforsch · Appl Agric Forestry Res · 1 2014 (64)1-16
7
Cereals (€/100 kg) Oilseeds (€/100 kg)
25 80
70
20
60
50
15
40
10
30
20
5 Soft wheat Rape seed
Barley Soybeans
10
Maize Sunflower seeds
0 0
2002 2005 2008 2011 2014 2017 2020 2023 2002 2005 2008 2011 2014 2017 2020 2023
Protein meals (€/100 kg) Vegetable oils (€/100 kg)
50 140
120
40
100
30 80
60
20
40
10 Rape meal Rape meal
Soybean meal 20 Soybean meal
Sunflower meal Sunflower meal
0 0
2002 2005 2008 2011 2014 2017 2020 2023 2002 2005 2008 2011 2014 2017 2020 2023
Meat (€/100 kg) Milk products (€/100 kg)
500 500
400 400
300 300
200 200
Skimmed milk powder
100 Beef 100 Whole milk powder
Pork Emmentaler
Broiler1 Butter
0 0
2002 2005 2008 2011 2014 2017 2020 2023 2002 2005 2008 2011 2014 2017 2020 2023
1
Wholesale price.
Source: Own calculations with AGMEMOD (2014).
Figure 4:
Development of farm gate prices in Germany8 F. Offermann, C. Deblitz, B. Golla, H. Gömann, H.-D. Haenel, W. Kleinhanß, P. Kreins, O. v. Ledebur, B. Osterburg, J. Pelikan, N. Röder, C.
Rösemann, P. Salamon, J. Sanders and T. de Witte · Landbauforsch · Appl Agric Forestry Res · 1 2014 (64)1-16
cropping area. Oilseed areas remain constant, while produc- t the opportunities for an increase of milk production fol-
tion increases by 4 %. Silage maize and other arable fodder lowing the end of the quota scheme;
area is slightly reduced, as fodder yield increases while cattle t the growing importance of income generation from pro-
numbers remain more or less constant. ducing energy maize for biogas generation;
With the abolishment of the milk quota and rising milk t lower costs for protein feed;
prices, milk production increases to 34.5 million t by 2023. t the continuing structural change, with high exit rates
Compared to the period 2009 to 2011, this corresponds to a especially of small farms with below-average income
growth of milk output in Germany by 18 %. Breaking the potential and the resulting opportunity for growth for
historic trend, dairy cow numbers increase slightly. Total cat- remaining farms;
tle numbers – and thus beef production – remain almost t the reduced labour requirements as a consequence of
constant. technical change; and
The observable trend of a regional concentration of dairy t improvements in crop and dairy yields.
production accelerates following the end of the dairy quota
system. On average, milk production increases by 300 kg/ha The large differences in the income of farms of different size
UAA from 2009/11 to 2023. According to the model results, observed in the base period persist. However, income devel-
an above-average expansion of dairy production will take opments differ by farm type (Figure 5), which can be mainly
place in the coastal regions and in the lower Rhine region, in attributed to the different price developments for agricultur-
some middle mountain areas, as well as in the Allgäu and pre al products (Section 4.2). In addition, the reduction of direct
Alpine regions (Map 1). These grassland and lower-yielding payments, the introduction of nationally uniform basic and
arable crop areas have generally shown a particularly com- greening payments and the redistributive payments for
petitive dairy production in the past, and already exhibit smaller farms lead to changes in support payments whose
high dairy production densities. A withdrawal from dairy size and direction strongly depend on region (federal state)
production can in particular be observed on arable locations, and individual farm characteristics (e.g., volume of direct
such as for example the Cologne-Aachen area, the Hildesheim payments in base period and land area).
plain and the northeast of Brandenburg. In addition, some On the one hand, arable farms are especially affected by
grassland regions lose production shares. This affects, for the strong increase of fertilizer and energy prices and the
example, the Black Forest as well as parts of Hesse, and thus decrease of prices for rape and sugar beet. On the other
grassland regions that have proven to be less competitive for hand, they benefit from the still growing demand for energy
dairy production in the past and in which dairy production maize. The average land area of arable farms increases mark-
has been declining. These regions are often found near urban edly, due to the high exit rates of small arable farms with low-
centres which offer comparatively good off-farm job oppor- er incomes. Overall, income of arable farms stabilizes at the
tunities. comparatively high level of the base period. Dairy farms prof-
The share of milk production produced in farms with it from the elimination of quota costs and a strong increase in
larger dairy herds further increases significantly. This trend is the average milk production quantity. Despite an above-
especially marked in the northern regions, where over 90 % average reduction of direct payments, the income of dairy
of the milk is produced in farms with more than 60 cows in farms rises by 24 % and thus reaches a level comparable to
2023. Many farms with smaller herds either exit milk produc- that of arable farms. Due to the increase in prices for farm
tion, or use the opportunities offered by the end of the milk inputs, other grazing livestock farms cannot increase their
quota scheme to enlarge their herds. In the southern regions, income above the low level of the base period (–3 %) despite
this leads to an increased importance of medium-sized the positive developments of beef prices. Mixed and pig and
farms, which in the baseline provide approximately 50 % of poultry farms profit from rising pork and poultry prices in the
the regional production. Thünen-Baseline. In addition, pig and poultry farms are less
affected by the reduction and reformation of direct pay-
ments than other farm types. While on average farms receive
4.4 Income 50 €/ha less than in the base period, the payments in pig and
The following analysis of income developments at the farm poultry decrease by only 5 €/ha. Income increases by 11 % in
level focuses on the indicator ‘farm net value added (FNVA) mixed and 44 % in pig and poultry farms. However, higher
per agricultural working unit (AWU)’. FNVA measures the regulatory requirements are currently under discussion, e.g.
return to the factors land, labour and capital, and is put in as part of the fertilizer directive, and could increase produc-
relation to the amount of labour input to account for differ- tion costs for these farms in the future.
ences and changes in farm size. All income figures are adjust- The increase of rental prices for grassland especially
ed for inflation and refer to 2010 prices. affects other grazing livestock farms due to the high share of
Compared to the base period of 2009/10 to 2011/12 grasslands in combination with an often high share of rented
(Figure 5), the average FNVA/AWU increases by 13 %, and is land. According to the model results, rents are projected to
thus markedly higher than average income over the last ten increase strongly especially in regions with intensive live-
years. The decrease of farm gate prices in real terms and the stock farming.
reduction of direct payments are partly offset by multiple The income of organically managed farms declines
factors: slightly in the baseline compared to the base year period asF. Offermann, C. Deblitz, B. Golla, H. Gömann, H.-D. Haenel, W. Kleinhanß, P. Kreins, O. v. Ledebur, B. Osterburg, J. Pelikan, N. Röder,
C. Rösemann, P. Salamon, J. Sanders and T. de Witte · Landbauforsch · Appl Agric Forestry Res · 1 2014 (64)1-16
9
Density of milk production Regional reallocation of milk production
(2010; in kg per hectare UAA) (2010 to 2023; in kg per hectare UAA)
in kg per ha UAA in kg per ha UAA
less than 1,000 more than 0
1,000 to 2,000 0 to 500
2,000 to 3,000 500 to 1,000
3,000 to 4,000 1,000 to 1,500
more than 4,000 more than 1,500
Source: Own calculations based on RAUMIS (2014).
Map 1:
Regional relevance and reallocation of milk production in Germany
70,000
2009/10-2011/12
60,000 Baseline 2023
50,000
40,000
€/AWU
30,000
20,000
10,000
0
All farms Arable Dairy Other grazing Mixed Pig & Poultry
livestock
Source: Own calculations based on FARMIS (2014).
Figure 5:
The development of farm net value added per agricultural work unit by farm type (in real terms in prices of 2010)10 F. Offermann, C. Deblitz, B. Golla, H. Gömann, H.-D. Haenel, W. Kleinhanß, P. Kreins, O. v. Ledebur, B. Osterburg, J. Pelikan, N. Röder, C.
Rösemann, P. Salamon, J. Sanders and T. de Witte · Landbauforsch · Appl Agric Forestry Res · 1 2014 (64)1-16
shown in Figure 6. Yield and price increases and relative gains
from the reform of direct payments are generally not suffi- Table 2
cient to compensate rising input prices. Only organic arable Development of the nitrogen balance
farms increase their income (+9 %), which is mainly due to
the growing size of the average farm in the wake of structural 2009/2011 2023 Change
in % to
change. The FNVA/AWU decreases in organic dairy (-4 %), Elements of the nitrogen balance kg N/ha UAA 2009/11
other grazing livestock (-14 %) and mixed farms (-11 %).
Inputs
Organic fertilizer 81 94 13
4.5 Environmental impacts Mineral fertilizer 98 98 0
One of the key indicators for the environmental impacts of Symbiotic fixation
agriculture is the N-surplus, which the difference between all Asymbiotic fixation 36 35 -1
Asymbiotic deposition
nutrient inputs and outputs on agricultural land. For the soil
Total inputs 215 229 6
surface nitrogen balance, inputs include mineral and organic
fertilizers, atmospheric deposition, and symbiotic and asymbi- Outputs/losses
otic N-fixation, while output refers to the quantity of nitrogen N in harvested yields
-146 -159 8
in harvested crop production. A positive balance or surplus Ammonia losses
reflects inputs that are in excess of crop and forage needs. A Nitrogen balance (soil surface balance)
modified calculation of the N-surplus is used to assess the Denitrification
potential impact of excess nitrogen on water, by subtracting Leaching 69 70 2
Accumulation in soils
nitrogen loss through the volatilization of ammonia to the
Source: Own calculations based on Raumis (2014).
atmosphere from livestock housing and stored manure.
Compared to the historic developments during the past
decade, the trend of declining livestock numbers is not sus-
tained in the baseline scenario, while the increase of biogas fermentation residues from biogas production in 2023.
production leads to a rise in the quantity of nitrogen from Stocking rates vary greatly, with an average of 0.9 livestock
fermentation residues, which has a lower utilization rate than units (LU) per ha, and values of more than 2 LU/ha in the
mineral fertilizers. Inputs from organic fertilizers increase by northwest of Germany. High nitrogen inputs from organic
13 % in 2023 (Table 2), while inputs from mineral fertilizers fertilizers are projected especially for the northwestern part
stagnate due to higher fertilizer prices and increased nitro- of Germany, and some regions in Schleswig-Holstein and
gen use efficiency . Overall, the sectoral nitrogen soil surface Bavaria. While average nitrogen input from organic fertilizers
surplus remains almost constant at 70 kg/ha UAA. are around 94 kg N/ha UAA, values exceeding 300 kg N/ha
Regional nitrogen balances are to a large extent influ- UAA are observed in some regions with intensive livestock
enced by the amount of regionally produced manure and production in Lower Saxony.
energy maize. Map 2 provides an overview of regional stock- Ammonia is one of the most important airborne pollut-
ing rates and nitrogen from livestock excretions and ants. Directive 2001/81/EC of the European Parliament and
45 000
2009/10-2011/12
40 000
Baseline 2023
35 000
30 000
25 000
€/AWU
20 000
15 000
10 000
5 000
0
Total Arable Dairy Other grazing Mixed
livestock
Source: Own calculations based on FARMIS (2014).
Figure 6:
The development of farm net value added per agricultural work unit in organic farms (in real terms in prices of 2010)F. Offermann, C. Deblitz, B. Golla, H. Gömann, H.-D. Haenel, W. Kleinhanß, P. Kreins, O. v. Ledebur, B. Osterburg, J. Pelikan, N. Röder,
C. Rösemann, P. Salamon, J. Sanders and T. de Witte · Landbauforsch · Appl Agric Forestry Res · 1 2014 (64)1-16
11
Regional stocking rates Organic nitrogen from livestock and
fermentation residues
livestock unit per ha UAA in kg per ha UAA
less than 0.5 less than 40
0.5 to 1.0 40 to 80
1.0 to 1.5 80 to 120
1.5 to 2.0 120 to 160
more than 2.0 more than 160
Source: Own calculations based on RAUMIS (2014).
Map 2:
Regional stocking rates and organic nitrogen from livestock and fermentation residues (2023)
the Council on National Emission Ceilings for certain pollut- Greenhouse gas emissions will slightly increase (+1 %) com-
ants (NEC Directive) foresees a reduction of ammonia emis- pared to 2005, due to a small rise in cattle numbers and an
sions in Germany to less than 550,000 t after 2010. The Euro- increase of nitrous oxide (N2O) emissions as a consequence
pean Commission already suggested further reductions. of a higher turnover of nitrogen in soils.
Figure 7 provides an overview of the past and projected
development of ammonia emissions in Germany. The reduc-
tion of livestock numbers in the eastern part of Germany in 5 Relevance and impact of the
the early 1990s, the continuous decrease of cattle numbers „Greening” obligations
and technical progress with respect to the management of
organic fertilizers all have contributed to the decrease of The exemption of very small farms from the greening obliga-
ammonia emissions in the past. Total ammonia emissions tions is relevant for only a marginal share of total arable and
fluctuated around the emission limit during the years 2010 grassland (0.7 % and 1.6 % respectively), whereas the exemp-
to 2012. The emissions are projected to increase again above tion of organic farms refers to 6 % of total agricultural area.
the limit until 2023 due to an increase in livestock numbers. Based on the cropping patterns of 2012, approximately
Ammonia emissions from storage and spreading of fermen- 25,000 farms will need to adjust their land use by reducing
tation residues from biogas production are not yet account- the share of the dominant main crop(s) by 9 % (125,000 ha in
ed for in the guidelines for emission calculations. These could total). In the majority of the concerned farms, farmers have to
add another 40,000 t of ammonia emissions per year. The reduce the share of either maize or winter wheat.
projections thus highlight that additional measures for In Germany, in total 550,000 ha are required to fulfill the
ammonia reductions will be necessary to ensure full compli- obligations for EFA. Current fallow land already accounts for
ance with legal emission limits. 100,000 ha; however its regional distribution is quite uneven12 F. Offermann, C. Deblitz, B. Golla, H. Gömann, H.-D. Haenel, W. Kleinhanß, P. Kreins, O. v. Ledebur, B. Osterburg, J. Pelikan, N. Röder, C.
Rösemann, P. Salamon, J. Sanders and T. de Witte · Landbauforsch · Appl Agric Forestry Res · 1 2014 (64)1-16
700
Other
NEC-limit
sectors
600 Mineral
fertilizers
500 Leguminosous
crops, meadows
Other livestock
400
kt NH3
Poultry
Pigs
300
Cattle
200
100
0
1990
1991
1992
1993
1994
1995
1996
1997
1998
1999
2000
2001
2002
2003
2004
2005
2006
2007
2008
2009
2010
2011
2012
2023
Source: GAS-EM (2014).
Figure 7:
Development of ammonia emissions in Germany
Map 3:
Regional shares of fallow land, intercropping / catch crops and landscape elements as percentage of arable area
(Map 3, A). Taking into account the eligibility of leguminous especially in northwestern and southern Germany (Map 3, B).
crops, current cropping levels could provide another Taking into account existing fallows as well as leguminous
100,000 ha of EFA. Especially the eligibility of catch (or inter- and catch crops, only 40,000 ha (F. Offermann, C. Deblitz, B. Golla, H. Gömann, H.-D. Haenel, W. Kleinhanß, P. Kreins, O. v. Ledebur, B. Osterburg, J. Pelikan, N. Röder,
C. Rösemann, P. Salamon, J. Sanders and T. de Witte · Landbauforsch · Appl Agric Forestry Res · 1 2014 (64)1-16
13
Adjustment costs of the arable farm in Ostholstein range Sanction (long term)
from 21 to 36 €/ha UAA, and are thus considerably lower Sanction (short term)
than sanctions (75 to 113 €/ha). The best option combines
Fallow
the inclusion of barley in the crop rotation and buffer
strips to fulfill the EFA obligation. Fallow is also a compet- Catch crops + beans
itive option, as it fulfills both crop diversity and EFA Catch crops + summer barley
requirements. Catch crops however are an expensive
Buffer strips
option for this farm, as the necessary introduction of sum-
mer crops reduces whole farm gross margin. 0 20 40 60 80 100 120
For the arable farm in southern Lower Saxony, cost are Sanction (long term)
lowest (17 €/ha UAA) if catch crops are used to fulfill EFA Sanction (short term)
obligations and barley is grown to extend crop rotations.
Fallow
The reason is that this farm already grows mustard before
sugar beets, and only needs to replace mustard by a seed Peas + catch crops
mixture. The alternative options are more than twice as Catch crops
costly (34 to 42 €/ha UAA). Not fulfilling the greening obli-
Buffer strips
gations would lead to losses of 90 to 113 €/ha.
0 20 40 60 80 100 120
The best option for the arable farm in Saxony-Anhalt is to Sanction (long term)
leave some land fallow. This strategy only causes costs of Sanction (short term)
36 €/ha UAA. The options of buffer strips as EFA and barley
Fallow
for extending the crop rotation, or the combination of
catch crops and soybeans are, however, only marginally Catch crops + soybeans
more expensive (38 €/ha). Thus, greening could promote Catch crops + summer barley
cultivation of soybeans in some regions.
Buffer strips
0 20 40 60 80 100 120
Adjustments costs of the bull fattening farm in North Sanction (long term)
Rhine-Westfalia range from 47 to 69 €/ha UAA, while Sanction (short term)
sanctions would lead to losses of more than 100 €/ha UAA
Fallow
in the long run. Based on the calculations the combina-
tion of fallow and purchase of fodder maize is the most WPS + undersowing
competitive option. The reason is a) that maize purchase WPS + catch crops
is comparatively cheap, and b) gross margin loss of wheat Buffer strips
is comparatively small. However, as the availability of fod-
der maize is generally limited, in most cases one the alter- 0 20 40 60 80 100 120
native options will be realized.
The dairy farm in Schleswig-Holstein would face sanc- Sanction (long term)
tions equal to 35 €/ha UAA in the short run if greening obli- Sanction (short term)
gations are not fulfilled. As this is only slightly higher than
Fallow
the adjustment costs (32 to 41 €/ha UAA), it could be ben-
eficial for the farm not to participate in (part of) the green- Catch crops + beans
ing payments, especially if regional availability of maize is Undersowing in maize
poor or maize prices are high. However, in the long run,
Buffer strips
sanctions would increase to 57 €/ha UAA. In this situation,
growing ley grass and rye silage as well as catch crops on 0 20 40 60 80 100 120
€/ha UAA
part of the maize area will become the best option.
Source: Own calculations based on TIPI-CAL and TYPICROP (2014).
Figure 8
Cost of adjustments to greening obligations in €/ha UAA14 F. Offermann, C. Deblitz, B. Golla, H. Gömann, H.-D. Haenel, W. Kleinhanß, P. Kreins, O. v. Ledebur, B. Osterburg, J. Pelikan, N. Röder, C.
Rösemann, P. Salamon, J. Sanders and T. de Witte · Landbauforsch · Appl Agric Forestry Res · 1 2014 (64)1-16
levels of eligible land use and landscape elements suffice to t Uncertainty also exists with respect to the development of
fulfill the EFA requirements of the greening obligations. the oil price, which affects the prices of agricultural inputs
It is therefore expected that overall, the impact of the as well as, via the so-called „bushel-barrel-correlation,” the
greening obligations will be limited. However, depending on level of world market prices for agricultural products.
the circumstances, the obligation may require a noticeable
change of land use in individual farms. We investigate five All the models used for this study are based on a detailed
constellations of intensive farms which are particularly affect- depiction of policies and economic relationships and inter-
ed by one or more of the greening obligations to illustrate the dependencies in agricultural production. They have success-
related impacts at farm level and to analyze the profitability of fully been applied for many policy impact analyses (e.g.,
different potential adjustment strategies (Figure 8). Gömann et al., 2008; Gocht et al, 2012), and are continuously
developed further. Still, due to specific model characteristics
and restricted data availability, it is inevitable that some poli-
6 Reflection of results, assumptions and cy instruments or new technical developments cannot be
model restrictions modelled, or only in a simplified way. The most important
restrictions in this respect are:
The results of a baseline projection depend on the assump-
tions on the development of exogenous factors and the t The static models are not explicitly taking into account
assumptions on biophysical and economic causalities inher- short-term fluctuations, e.g., of world market prices.
ent in the model specifications. This chapter aims to reflect During the last years, especially world market prices of
the results of the Thünen-Baseline against the outcome of milk fluctuated markedly within a single year, often due to
similar projections of the EU-Commission (2013), to identify climate events in some export countries. These effects are
the key uncertainties in model assumptions and specifica- not covered.
tions and to discuss their implications for the results. t The end of the milk quota scheme, which restricted milk
The projections of domestic price levels of the EU-Commis- quantities in the EU for 30 years, represents a structural
sion (2013) and the Thünen-Baseline are quite similar. For cere- break, whose impacts are difficult to project, especially
als, absolute prices in the target year are very close, though the during the first years. Higher price fluctuations may occur,
gap to respective world market prices is higher in the EU-Com- in particular if climatic events or demand shifts occur
mission projections. The price developments for oilseeds and during this period. These phenomena cannot be project-
protein meals are also very similar. For meat and milk, the ed with the used model system, which is simulating equi-
Thünen-Baseline projections of prices in Germany are a bit low- librium markets.
er than the prices projected by the EU-Commission for the EU t Supply and demand of agricultural products for energy
market (Figure 9), which reflects differences in the development production is currently not comprehensively modelled.
of regional market and supply conditions. Milk production is Thus, the area cropped with energy maize is determined
projected to increase strongly in Germany, which explains a by the current and the expected expansion of the number
lower national price. As a consequence of the slight increase in of biogas plants.
beef production and the sluggish development of respective t New methodological guidelines for the calculation of gas-
demand in Germany, beef prices are projected to increase less eous emissions will lead to changes in the results for
than in the EU-Commission’s outlook. Increasing competition greenhouse gas emissions (obligatory implementation of
from imported pigs for slaughtering restricts the increase of new guidelines in 2015; IPCC, 2006) and ammonia emis-
farm gate pork prices in Germany in the Thünen-Baseline. sions (new Guidebook, EEA, 2013) in the future.
The Thünen-Baseline relies on a number of assumptions
concerning the development of factors and variables not
explicitly covered in the models used. Some of the areas con- 7 Conclusions
cerned are characterized by high uncertainties:
Overall, the Thünen-Baseline 2013 to 2023 draws a picture of
t While the basic elements of the reform of the EU-CAP a competitive agricultural sector in Germany, which adapts
2014 to 2020 have been decided, the final design of many well to the changes of the latest policy reform and seizes the
regulatory details as well as their national implementa- opportunities for expanding production, especially in the
tion were still under discussion at the time of this study. dairy sector. On the other hand, the projections also high-
Especially the final implementation of greening require- light that the problems that may accompany intensive live-
ments may differ from the assumptions made for this stock production will not simply dissolve. In view of the pro-
study, which could impact the results of the model projec- jected high profitability of intensive pig and poultry
tions. In addition, the still open decisions of other mem- production the related challenges could even increase.
ber states concerning the degree of remaining coupled The Thünen-Baseline 2013 to 2023 provides the basis for
payments could also affect agriculture in Germany. With subsequent policy impact analysis. Potential future studies
respect to trade agreements, the impact of the currently include the analysis of the impacts of adjustments to the CAP
negotiated free trade agreement with the United States following the midterm review in 2017, as well as the investi-
on trade as well as on production is an important issue. gation of a more fundamental reform after 2020.Sie können auch lesen