Software Measurement News - Volume 26, Number 1, March 2021 Journal of the Software Measurement Community - FG METRIKEN ...
←
→
Transkription von Seiteninhalten
Wenn Ihr Browser die Seite nicht korrekt rendert, bitte, lesen Sie den Inhalt der Seite unten
Volume 26, Number 1, March 2021

      Software Measurement News
              Journal of the Software Measurement Community

                                 Editors:

Alain Abran, Manfred Seufert, Reiner Dumke, Christof Ebert, Cornelius Wille
1
CONTENTS
Announcements .........................................................................................…... 2
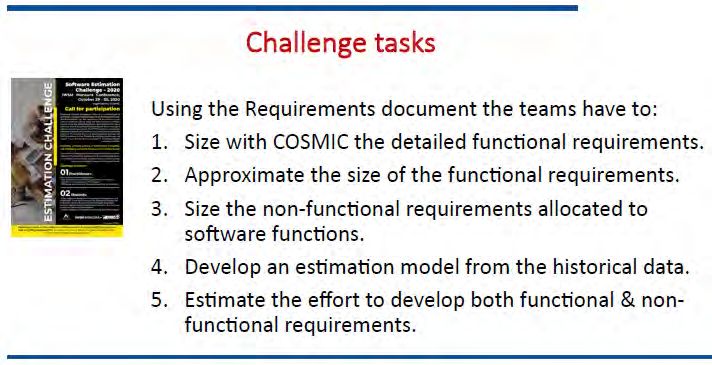
Students Challenge of Estimation, ETS Montreal …………………………………………. . 2
Data Science Workshop, GI FG 2.1.10 …………………………..………...... 4
Conference Reports ........................................................................................... 6
Community Reports ........................................................................................... 19
News Papers................................................................................................... 22
Harry Sneed:
Purpose of Software Measurement …………………………...................... 22
Reiner Dumke, Anja Fiegler, Cornelius Wille:
Large Scale Software Systems and Their Project Indicators …………..……. 31
Andreas Schmietendorf, Walter Letzel:
Analyse internetbasierter Datenspuren mit Hilfe des Web Scrapings-
Möglichkeiten, Technologien, Tests und Problemstellungen ……………………. 40
New Books on Software Measurement .................................................. 56
Conferences Addressing Measurement Issues ............................................... 62
Metrics in the World-Wide Web ......................................................................... 70
Editors:
Alain Abran
Professor and Director of the Research Lab. in Software Engineering Management
École de Technologie Supérieure - ETS, 1100 Notre-Dame Quest,Montréal, Quebec, H3C 1K3,
Canada, alain.abran@etsmtl.ca
Manfred Seufert
Chair of the DASMA, Median ABS Deutschland GmbH
Franz-Rennefeld-Weg 2, D-40472 Düsseldorf,
manfred.seufert@mediaan.com
Reiner Dumke
Professor on Software Engineering, University of Magdeburg, FIN/IKS
Postfach 4120, D-39016 Magdeburg, Germany,
dumke@ivs.cs.uni-magdeburg.de, http://www.smlab.de
Christof Ebert
Dr.-Ing. in Computer Science, Vector Consulting Services GmbH
Ingersheimer Str. 20, D-70499 Stuttgart, Germany,
christof.ebert@vector.com
Cornelius Wille
Professor on Software Engineering, University of Applied Sciences Bingen
Berlinstr. 109, D-55411 Bingen am Rhein, Germany,
wille@fh-bingen.de
Editorial Office: University of Magdeburg, FIN, Postfach 4120, 39016 Magdeburg, Germany
Technical Editor: Dagmar Dörge
The journal is published in one volume per year consisting of two numbers. All rights reserved
(including those of translation into foreign languages). No part of this issues may be reproduced in
any form, by photo print, microfilm or any other means, nor transmitted or translated into a machine
language, without written permission from the publisher.
2021 by Otto-von-Guericke-University of Magdeburg. Printed in Germany
Software Measurement News 26(2021)1
2                                                          Announcements

                   Students Challenge Overview
                       Alain Abran, ETS Montreal, Canada

                                                  see last year:

    Software Measurement News                                      26(2021)1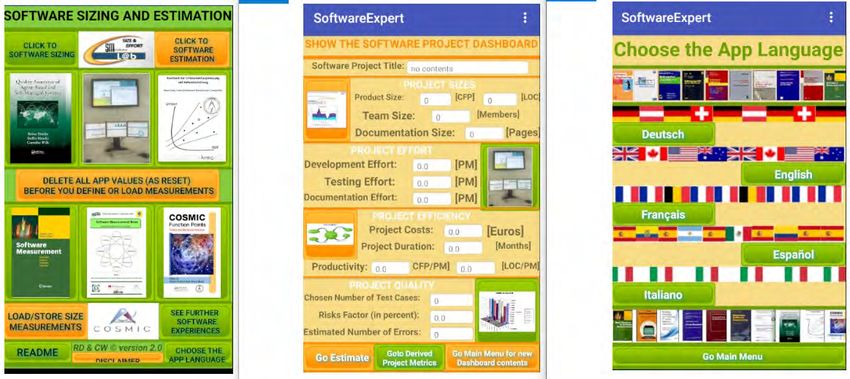
Announcement                                                      3

     see: https://profs.etsmtl.ca/aabran/English/index.html

Software Measurement News                                     26(2021)1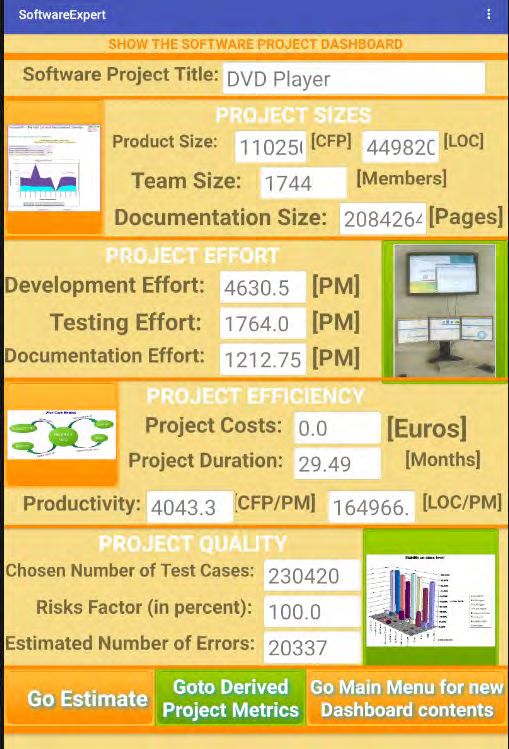
4 Announcements
Announcement of the GI-FG 2.1.10
Gesellschaft für Informatik e.V. (GI) und Plattform Lernende Systeme (PLS)
Data Science: Industrieerfahrung und Praxistipps
Virtueller Workshop am 20.5.2021, 14-17 Uhr
Zunehmend mehr Daten sind im beruflichen und privaten Umfeld verfügbar und laden
zu neuen Geschäftsmodellen ein. Big Data und Künstliche Intelligenz versprechen
vollkommen neue Produkte und Lösungen: vom autonomen Fahren bis hin zu
Industrie 4.0. Die Potenziale, mit Daten direkt Geld zu verdienen oder basierend auf
Daten intelligente Dienste und Produkte aufzubauen, scheinen unendlich.
Dazu werden Kompetenzen benötigt, um konkrete datenbasierte Use Cases
umzusetzen. Doch viele Unternehmen erreichen Ihre Ziele nicht oder nur sehr
langsam:
Unklare Use Cases und Geschäftsmodelle
Zu wenige oder qualitativ unzureichende Daten
Unklar, was in welcher Form gespeichert and analysiert werden soll
Die KI hält in der Praxis nicht, was zuvor versprochen wurde
Mangelnde Verfügbarkeit von Data Scientists und Software-Ingenieuren
Sie sind eingeladen, im Rahmen eines virtuellen Workshops mit Anwendern aus
Wirtschaft und Wissenschaft die folgenden Fragestellungen praxisorientiert zu
diskutieren:
Wie findet man geeignete Use Cases und woher bekommt man die Daten?
Worin liegt der Wert von Daten und wie kann man diesen greifbar machen?
Wie erreicht man ein nachhaltiges Geschäftsmodell?
Software Measurement News 26(2021)1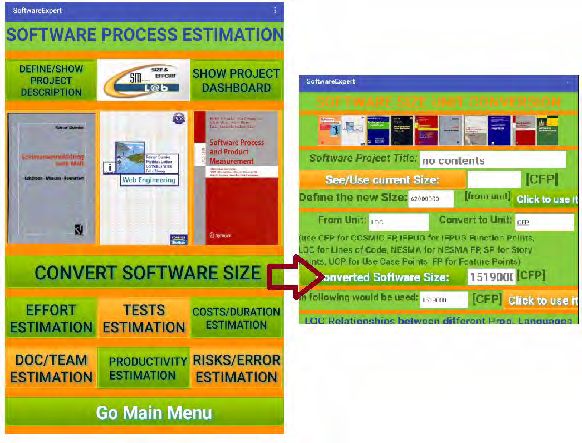
Announcement 5
Nutzen Sie den Workshop, um ...
…Impulse zum Thema Data Science aus erster Hand zu bekommen
…Ihr Netzwerk zu erweitern und sich mit Gleichgesinnten auszutauschen
…Lösungen für Ihre aktuellen Fragen und Herausforderungen zu erhalten
Die Ergebnisse des Workshops sind die Basis für ein gemeinsames Positionspapier.
Zielgruppe
Der Workshop richtet sich an alle, die Data Science im Unternehmen umsetzen und
Erfahrungen dazu austauschen möchten. Wir wollen dabei insbesondere auf die
Belange von KMU eingehen.
Anmeldung
Der Workshop ist kostenlos.
Bitte vorherige Anmeldung an Jens.Heidrich@iese.fraunhofer.de bzw.
Christof.Ebert@vector.com
Agenda
14:00 Begrüßung: Christof Ebert (Vector & GI), Maximilian Hösl (PLS)
Moderation: Jens Heidrich (Fraunhofer IESE & GI)
14:10 Impulsvorträge mit Fragerunde
Matthias Patz (DB Systel, VP Innovation & New Ventures)
Michael Weyrich (Universität Stuttgart, Direktor IAS, und robo-test)
Alexander Löser (Beuth Hochschule für Technik Berlin, Leiter FZ Data
Science)
Julien Siebert (Fraunhofer IESE, Data Scientist)
15:15 Pause
15:30 World-Café (Diskussionsrunde zu den Fragestellungen an drei virtuellen
Tischen)
16:30 Zusammenfassung und Abschluss
17:00 Ende der Veranstaltung
Siehe auch: https://fg-metriken.gi.de
Software Measurement News 26(2021)1
6                                             Conference Report

                  30th IWSM/Mensura 2020
            was held at October 29 – 30 in Mexico City

Software Measurement News                                26(2021)1
Conference Report                                   7

               Proceedings are available online

Software Measurement News                         26(2021)1
8                           Conference Report

Software Measurement News              26(2021)1
Conference Report                                        9

                  see: https://www.iwsm-mensura.org/

Software Measurement News                              26(2021)1
10 Conference Report
Workshop
“Evaluation of Service-APIs – ESAPI 2020“
Motto: APIs als Klebstoff einer umfassenden Digitalisierung
November 2020, Berlin
Sandro Hartenstein2, Konrad Nadobny1, 2, 3,
Steven Schmidt2, 4, Andreas Schmietendorf1, 2
1
OvG-Universität Magdeburg, 2HWR Berlin,
3
Bayer AG, 4Deutsche Bahn AG
1. Motivation und Themen des Workshops
Die Gartner Group1 geht davon aus, dass im Jahr 2021 mehr als 60% aller
Anwendungsentwicklungen von eingesetzten Web-APIs profitieren. Diese mit Hilfe
klassischer Internettechnologien zur Verfügung gestellten Web-APIs bieten die
Möglichkeit eines konsistenten Zugriffs auf fachlich begründete Informationen und
Funktionen aber auch auf komplette Geschäftsprozesse.
Neben einer unternehmens- und branchenübergreifenden Integration existierender
Softwarelösungen wird dabei auch die Zielstellung einer kompositorischen und damit
agilen Softwareentwicklung verfolgt. Aufgrund der ggf. „ad hoc“ zusammengesetzten
Lösungen muss auch der Betrieb mit diesen Herausforderungen umgehen können.
Daher kommt der Themenstellung „DevOps“ als Klammer zwischen Entwicklung und
Betrieb eine besondere Bedeutung zu.
Der ESAPI-Workshop im Jahr 2020 fokussierte die folgenden Themen:
− Bewertung von Vertrauen und Sicherheit bei Web-APIs.
− Branchenspezifische Ansätze zur Spezifikation von Web-APIs.
− Lowcode bzw. Codeless Softwareentwicklung mit Web-APIs.
− Effiziente Ansätze zur „API-fizierung“ von Altanwendungen.
− Risiken bei über Web-APIs bezogenen KI-Algorithmen.
− Vor- und Nachteile von GraphQL-basierten Web-APIs.
− Elemente eines DevOps-orientierten API-Managements.
− Serverless bereitgestellte Web-APIs – Fiktion oder Wirklichkeit?
Der ursprünglich als Präsenzveranstaltung geplante Workshop wurde im Jahr 2020
erstmals online durchgeführt. Mehr als 40 Teilnehmer hatten sich im Rahmen der
1
Quelle: Zumerle, D. et al. 2019. API Security. What You Need to Do to Protect Your APIs [online].
Verfügbar unter https://www.gartner.com/en/documents/3956746/api-security-what-you-need-to-do-
to-protect-your-apis
Software Measurement News 26(2021)1Conference Report 11
virtuellen Konferenz zusammengefunden. Erstmals wurde die Veranstaltung von der
Bayer AG in Berlin gehostet.
2. Beiträge zum Workshop
Im Vorfeld wurde ein entsprechender Call for Paper innerhalb der Community
verteilt, auf dessen Basis 11 Beiträge für den Workshop ausgewählt wurden. Um
den speziellen Herausforderungen einer Online-Veranstaltung zu genügen, wurden
die Beiträge als Keynote, als 10minütige Themen-Pitches oder mit Hilfe parallel
bereitgestellter Poster präsentiert.
Anja Fiegler, Andreas Schmietendorf
Entwicklung smarter Anwendungen mit Hilfe cloudbasiert angebotener KI-
Algorithmen;
Niko Zenker, Daniel Paschek, Marvin Leine
Einsatz einer gewichteten Graphendatenbank zur Abbildung komplexer
Unternehmensarchitekturen;
Konrad Nadobny
Vergleich von Enterprise API-Management-Lösungen;
Steven Schmidt
Schaffung eines vertrauenswürdigen, öffentlichen WLAN -Herangehensweise
und Teilergebnisse;
Michael Petry, Volker Reers, Frank Simon
Reaktive, minimal destruktive API-Härtung am Beispiel von GraphQL;
Jens Borchers
Zero Trust-Architektur und -Kultur;
Daniel Kant, Andreas Johannsen
Exemplarische API-Schwachstellen bei IoT-Geräten auf der Grundlage von
OWASP API Security TOP 10;
Gabriel Landa, Sandro Hartenstein
Bitcoin Blockchain via Satelliten;
Kadir Ider
Effective Privacy Management Concepts: Increasing Privacy Control by
Reducing Complexity;
Software Measurement News 26(2021)112 Conference Report
Maximilian Müller, Matthias Dobkowicz, Andreas Johannsen, Allan Fodi
Konzeption eines Objektkonfigurators zur Erstellung von Auszügen einer
Objektbibliothek;
Sandro Hartenstein
Entwicklung vertrauenswürdiger Web-APIs.
3. Ergebnisse der Breackout-Diskussionen
Der Tradition des Workshops entsprechend galt es, ein World Cafe erstmals virtuell,
mit Hilfe von „Breack Out Sessions durchzuführen. Die Teilnehmer wurden zunächst
in drei Gruppen aufgeteilt und dann jeweils einem Diskussionsraum zugeteilt.
Jedem dieser Diskussionsräum war ein fester Moderator zugeteilt, welcher den
Austausch leitete und die Ergebnisse auf einem gemeinsamen Whiteboard
dokumentierte. Nach 15 Minuten wechselten die Gruppen den Diskussionsraum, so
dass sie sich nun zu einem weiteren Thema austauschen konnten. Dabei bauten sie
auf den Ergebnissen der vorherigen Gruppe auf. Nach weiteren 15 Minuten wurde
der Diskussionsraum abermals gewechselt.
Massive APIfizierung von Legacy Applikationen
Das Thema der massiven APIfizierung von Legacy Applikationen wurde kontrovers
diskutiert, wobei das Ergebnis in der Abbildung auf der folgenden Seite dargestellt
ist. Das Thema gliedert sich in die Teilbereiche Standardisierung, Vernetzung und
Verschlankung. Im Laufe der Diskussion wurde zudem herausgearbeitet, dass auch
Aspekte wie Kultur und Innovation in diesem Kontext eine große Rolle spielen. So
bedarf es einer offenen, kollaborativen Kultur mit dem Ziel, dass möglichst alle
Daten und Funktionalitäten als API angeboten und standardkonform implementiert
und dokumentiert werden (Open API). Die Zielvorstellung ist somit ein
Konnektivitäts-Ökosystem, in dem alle Akteure sich einfach und effizient
austauschen können. Systeme sind im Idealfall in Echtzeit integierbar und
ermöglichen ein Agieren ohne Medienbrüche und Inkonsistenzen. Die Motivation für
eine API-getriebene IT-Architektur im Allgemeinen und die dementsprechend
benötigte massive APIfizierung von Altsystemen im Speziellen begründet sich im
folgenden Sachverhalt:
Software Measurement News 26(2021)1Conference Report 13 Etablierung gemeinsamer Standards und Normen zur Reduktion der Komplexität. Auf dieser Grundlage lassen sich Standardlösungen einfacher und vor allem effizienter bereitstellen. Darüber hinaus bietet sich die Möglichkeit, historisch gewachsene Systemlandschaften zu entwirren (d.h. entkoppeln) und die Strukturen sukzessive zu modernisieren. In Bezug auf Legacy-Applikationen muss beachtet werden, dass die Systeme oftmals über komplexe, historisch gewachsene Businesslogiken verfügen, die nicht verloren gehen dürfen. Mithilfe eines API-Wrappers können diese zum Beispiel hinter einer API-Fassade verborgen werden, so dass das Altsystem modernisiert und endkoppelt werden kann. Die ursprüngliche Kernfunktion bleibt dabei erhalten, so dass es wie gehabt weiter betrieben werden kann. API-Wrapper können somit als Brückentechnologie genutzt werden, um monolithische Systeme zunächst mit einer Standardschnittstelle zu ertüchtigen und dann nach und nach aufzubrechen. Dies erleichtert nicht nur die Systemintegration, sondern ermöglicht auch einen Wandel weg von lokal optimierten Lösungen (Best of Breed) hin zu ganzheitlichen, integrierten Systemlandschaften (Best of Suite). Software Measurement News 26(2021)1
14                                          Conference Report

     Abbildung 1: Ergebnis der Diskussion

Software Measurement News                              26(2021)1
Conference Report 15 Die Akzeptanz einer API-getriebenen Transformation ist abhängig von greifbaren Verbesserungen. Aus technischer, betrieblicher und organisatorischer Sicht ist zunächst ein professionelles API-Management zum Durchsetzen der gemeinsamen Standards unerlässlich (API Governance). In Bezug auf Daten und Funktionalitäten müssen diese Standards auf fachlicher Ebene diskutiert und vereinbart werden. Diese gemeinsamen Standards, Regeln und Normen reduzieren im Nachgang die Komplexität und vereinfachen den späteren Austausch. Idealerweise werden dabei bereits existierende Industriestandards, wie zum Beispiel domänenspezifische Datenmodelle, implementiert. Vertrauen in Public WIFI-Infrastrukturen In diesem World Cafe wurden zentrale Fragen zur Einstellung der Diskussionsteilnehmer gegenüber der Vertrauenswürdigkeit öffentlicher WLANs diskutiert. Einstiegspunkt war dabei die Grundsatzfrage, inwiefern überhaupt öffentlichen WLANs vertraut wird. Das Feedback über die verschiedenen Diskussionsrunden hinweg war stark diversifiziert. Im Wesentlichen wird öffentlichen WLANs nicht vertraut. Häufige Antworten haben aber teilweise nach Anbieter bzw. angebotenem Serviceumfang unterschieden, oder die Entscheidung einer eigenen, kurzen Prüfung verschiedener Datensicherheitseigenschaften vorbehalten. Im Hinblick auf die Fragestellung zur Relevanz der Vertrauenswürdigkeit für die Nutzung des jeweiligen WLAN-Angebotes müsse nach Meinung der Teilnehmer grundsätzlich zwischen beruflicher und privater Verwendung unterschieden werden. Im privaten Kontext war die Auswirkung auf die tatsächliche Nutzung häufiger irrelevant, im beruflichen oder professionellen Kontext gab es jedoch starke Abhängigkeiten. Der dritte Diskussionsgegenstand bewegte sich im Bereich vertrauensschaffender Maßnahmen, welche der Service aufweisen müsste, um als relativ vertrauenswürdig zu gelten. Hierbei war in allen Diskussionsrunden der grundsätzliche Konsens erkennbar, dass sich Maßnahmen nicht auf eine rein technische Dimension beschränken dürfen. Kommunikative Aspekte zur transparenten Darstellung von Nutzungsrisiken und entsprechenden - gegebenenfalls betreiberseitigen – Lösungen sind hier sehr häufig genannt worden. Auch die Rolle des Staates als Aufklärer über diese Sachverhalte kam zum Tragen, ebenso wie eine Zertifizierung einer relativen Vertrauenswürdigkeit seitens einer unabhängigen Institution. Eine Anmeldung im öffentlichen WLAN mit einem durch den Betreiber gestellten Zertifikat auf dem eigenen Endgerät ist abhängig von der Anbieterreputation zur Etablierung einer verschlüsselten Kommunikation dabei weitläufig akzeptiert. Software Measurement News 26(2021)1
16                                                         Conference Report

Die abschließende Frage für die Teilnehmer des World Cafes befasste sich mit einer
potenziell gesteigerten Nutzungsrate öffentlicher WLANs bei eventueller Umsetzung
der zuvor diskutierten Maßnahmen und Eigenschaften. Hier war das Feedback
überwiegend positiv. Eine Anmerkung bestand darin dass ein Belohnungssystem für
die Nutzung eines sichereren Angebots einen zusätzlichen Anreiz darstellen könnte.

Herausforderungen beim KI-Bezug via Web-APIs

Das Angebot von webbasierten APIs, die KI-Algorithmen zugänglich machen, wächst
täglich. Aufgrund der zumeist cloudbasierten Bereitstellung dieser technischen
Hürden für einen Einsatz von Algorithmen der künstliche im Rahmen der Azure-
Plattform oder auch bei der IBM im Rahmen der Bluemix-Plattform. Die Bedenken
von Seiten der Anwender, entsprechende Angebote produktiv zum Einsatz zu
bringen, sind in Deutschland allerdings enorm. In anderen Regionen wie z.B. im
asiatischen oder auch nordamerikanischen Raum steht man dem Einsatz weitaus
unkritischer gegenüber. Dementsprechend profitieren innovative Lösungen im
Zusammenhang mit fachlichen Anwendungsszenarien, die eher durch den
Endanwender bzw. durch potentielle Kunden getrieben werden. Die eher
abwartende Haltung in Deutschland impliziert die Gefahr, den Anschluss zu
verlieren.

Die folgenden Ausführungen charakterisieren die wesentlichen Eckpunkte der
innerhalb des World Cafes durchgeführten Diskussion:

Die Erwartungen der Web-API-Consumer (d.h. Entwickler) sind zum einen eine hohe
Security-Grundabsicherung. In diesem Zusammenhang wird typischerweise auf die
Authentifizierung und Autorisierung, die netzwerkorientierte Verschlüsselung, das
Versionsmanagement sowie ein transparentes Vertragsmanagement Bezug
genommen. Zum anderen erwarten die Anwender spezielle Transparenz hinsichtlich
des konkret eingesetzten KI-Algorithmus. Die Nachvollziehbarkeit, Verständlichkeit,
Genauigkeit und das Vertrauen in die vortrainierten Modelle sind wichtige
Anforderungen der Nutzer. Sie können und sollten vom Service Provider adressiert
werden. Das Vertrauen in die trainierten Modelle und die Absicherung gegen „böses“
Training sollte von unabhängigen Dritten geprüft und mit Hilfe anerkannter Zertifikate
bestätig werden. In diesem Zusammenhang sollten sich auch Standards hinsichtlich
des API-Managements bzw. der Spezifikation (Beschreibung) etablieren.
Grundsätzlich wurde durch die Teilnehmer festgestellt, dass eine ausschließlich
technische Sicht auf die Vertrauenswürdigkeit von Web-APIs nicht ausreicht.
Darüber hinaus bedarf es einer Entmystifizierung eingesetzter KI-Algorithmen.

Software Measurement News                                                   26(2021)1
Conference Report                                                                             17

4. Tagungsband und weitere Informationen

Auch für das Jahr 2021 ist die Durchführung eines ESAPI-Workshops vorgesehen.
Aktuell gehen wir davon aus, das dieser in Köln (angefragter Gastgeber: Zurich
Versicherungsgruppe Deutschland, HS Köln) durchgeführt werden kann.
Weiterführende Informationen werden zeitnah unter der folgenden URL im Internet
bereitgestellt:

                         https://blog.hwr-berlin.de/schmietendorf/

 Abbildung 2: Tagungsband zum Workshop ([Schmietendorf/Nadobny 2020])

 Quelle: https://www.shaker.de/de/content/catalogue/index.asp?lang=de&ID=8&ISBN=978-3-8440-7515-1

Software Measurement News                                                                 26(2021)1
18 Conference Report
5. Quellenverzeichnis
[Schmietendorf/Nadobny 2020] Schmietendorf, A.; Nadobny, K. (Hrsg.): ESAPI 2020
4. Workshop Evaluation of Service-APIs, Berlin – 03. November 2020, 140 Seiten, in Berliner
Schriften zu modernen Integrationsarchitekturen, Shaker-Verlag, Düren, November 2020,
ISBN 978-3-8440-7515-1
Dank
Unser Dank gilt den Referenten und Teilnehmern, aber auch den Partnern (HWR
Berlin, OvG-Universität Magdeburg), Sponsoren (Bayer AG Berlin, Deutsche Bahn
AG, Delivery Hero) und Unterstützern im Programmkomitee, die eine solche
Veranstaltung ermöglicht haben. Ein herzlicher Dank geht auch an die beteiligten
Medienpartner SIGS DATACOM GmbH aus Köln und an den Shaker Verlag GmbH
aus Aachen.
Software Measurement News 26(2021)1Community Reports 19
Currently COSMIC News
I am delighted to announce that the number of countries with a COSMIC
representation has risen to 31 because of the addition of:
Cameroon
In Cameroon, COSMIC is represented by Donatien Moulla (donatien.moulla@cosmic-
sizing.org). For more information, visit cosmic-sizing.org/organization/local/cameroon
Jordan
In Jordan, COSMIC is represented by Khalid Al-Sarayreh (khalid.alsarayreh@cosmic-
sizing.org). For more information, visit cosmic-sizing.org/organization/local/jordan
Morocco
In Morocco, COSMIC is now represented by Ali Idri (ali.idri@cosmic-sizing.org). For
more information, visit cosmic-sizing.org/organization/local/morocco
Frank Vogelezang
Chairman
The COSMIC version 5.0 is now available
(see: www.cosmic-sizing.org/)
Part 1: Principles, definitions & rules* (17 pages)
Part 2: Guidelines* (17 pages)
Part 3: Examples of COSMIC concepts and measurements (28 pages)
Software Measurement News 26(2021)120 Community Reports Software Measurement 26(2021)1
Community Reports                                            21

    USE OUR APP IN YOUR LANGUAGE

                SoftwareExpert in the Google Play Store

CONTENTS
SoftwareExpert can be applied to quickly and easily determine
important project key data for the development of software
systems and can be used in German, English, French, Spanish and
Italian.

The software estimation is based on a Software size such as
(COSMIC/IFPUG) function points or Story points or Lines of Code or
Feature points etc.

             further information see in www.smlab.de

Software Measurement News                                 26(2021)1
22 News Papers
Purpose of Software Measurement
Harry M. Sneed
Technical University of Dresden
Ziviltechnik-Prentner, Vienna
1. Why measure software?
There are many reasons for wanting to measure software. Contrary to what many
users believe, it is not only to control the quality. Quality is only one of the properties
of a software system. There are also other properties such as size, complexity,
conformance, compatibility, adaptability and sustainability. All of these properties need
to be quantified if they are to be judged and compared. Planned features must be
compared with actual features in order to determine if the software fulfills its non-
functional requirements.
To determine what is done
What is meant by “done”? When is software done, i. e. finished? To answer that
question one needs numbers and not just subjective opinions. Of course it is good to
have an opinion, but that is not enough. There must be numbers to support that
opinion. One man’s opinion can be another man’s imagination. There must be some
way to distinguish between fact and fiction. This is where measurement comes into
play. Measurement brings objectivity into decision making. It delivers facts upon
which decisions can be based, for instance the decision as to whether to release a
software version or not.
To predict the costs of doing it
Another reason to measure software, one which is particularly important for user
management is to predict the costs of a potential project. In the case of smaller
projects where only a few people are involved, it may be possible to estimate the
costs of a project based on expert opinion or the combined predictions of project
participants, but with larger projects where many persons are involved this no longer
holds, The effort required has to be systematically calculated using some proven
estimation method. Such estimation methods rely on numeric data to calculate the
time and costs. Some may say that this is just another form of witchcraft, but this is
all we have in a world of uncertainty. This form of algorithmic cost calculation is only
as good as the numbers which go into it. If the method used to predict effort is based
on the size of the code then one must expect that size measurement, whether it is in
lines of code or in source statements, to be accurate. The same applies when
counting the number of data items processed as with the Data-Point method or the
number of process inputs and outputs as with the Function-Point method. The
elementary entities must be counted correctly if the cost prediction is to be reliable.
The larger the project is, the more important it is to measure accurately.
Software Measurement News 26(2021)1News Papers 23 To compare performance A further reason for wanting to measure software is to compare the productivity of the software producing teams. Our free market economy is based on competition. Teams and firms compete with one another to produce more software at less cost, or as Tom DeMarco once put it – more bang for your bucks. How can one know if a team is really earning its money, or if it is just spending its time? Team output, i.e. productivity, must be in some way compared with a bench mark. That productivity benchmark can be obtained from past performance. Software producers should keep records of how much software they have produced in the past and what effort was required to produce it. This is referred to as their productivity rate. They might also take the productivity rate from other service providers working under similar conditions to use as a benchmark. By comparing the current productivity of their teams with past productivity and with the productivity of foreign teams they can determine if their teams are working as they should be. If not, they can study the reasons why and come to a conclusion as to how to raise their productivity. In any case, productivity measurement is an essential prerequisite to any means of process improvement. To judge the quality of the software Finally, there is a reason to want to judge the quality of a software product. How good is a piece of software? How does it compare with other software of the same type? To answer these questions the quality of the software must be measured. Software quality is both static and dynamic. Static quality is the degree to which the code and the documents fulfill the static quality requirements. These requirements are the standards to be fulfilled. Once they are accepted and approved, it is only a question of checking them. Any violation of these standards, i.e. rules is considered to be a deficiency in the software, regardless of whether it seems to be meaningful or not. As long as the rules have been approved by a legitimate organizational unit, it is up to the projects to abide by them. Software standards are like traffic rules. If they are passed and approved by the local government then they apply to the territory under jurisdiction of that local government. Anyone passing through that territory is obliged to abide by them. There can be no exceptions. The same is with software rules. They must be followed by all those developing software within the jurisdiction of the local standards board. Standards are enforced by measuring the code and documents they apply to. Dynamic quality is the degree to which the software performs according to the specification. This is determined by testing. The software is executed and its performance measured. To be measured is the execution time, the amount of memory required, the code, data and functional coverage and the error rate. The software should execute within the time limits set and not use more memory than what is allowed. The code, data and functions should be covered to the extend specified. In the case of code that is the percentage of statements or branches executed. In the case of data that is the percentage of data values set or used. In the case of functions that is the ration of functions tested relative to functions specified. The number of errors detected should be below the maximum error limit set. The execution time, the coverage levels and the error rate are recorded, i.e. measured. Software Measurement News 26(2021)1
24 News Papers
These measurements are essential to assessing the dynamic quality of the software
in question. The software should only be released when it has fulfilled the minimum
quality criteria. Thus, as pointed out here, there are many good reasons for
measuring software, namely
to determine the degree to which it is done
to predict its costs
to ascertain the productivity of those developing it
to assess its quality.
There may be other reasons as well, but these are the main ones.
2 What software should be measured?
A software product is made up of different partial products, which are equivalent to
views of that product. There is the view point of the users, the view point of the
analysts, the view point of the architects, the view point of the programmers and the
view point of the testers. Users see the user interface and the instructions for using it;
analysts see the requirement specification; architects see the design model and its
documentation; testers see the test cases and the test documentation. Each of these
partial products has its own language and its own rules for using that language. They
also have their own measurements. Requirements specifications are normally made
in natural language, e.g. English or German. Design models are now made mostly in
UML, although there are alternative modelling languages such as ODL. Code can be
written in one of many programming languages ranging from Basic Assembler to Java
Script and PHP. Testware can be made with scripts, tables or mark-up languages like
XML. The biggest challenge to software measurement lies in processing so many
different languages, each with its own unique features.
Fortunately no one will have to deal with all of them. At any one user site only a
subset of the many languages will be used. There will be at most the local natural
language plus English, one modelling language most likely UIML, one or two
programming languages and perhaps a test language. The key objects to be
measured are
the requirement specification
the design model
the source code and
the test cases.
All of these partial products are objects of measurement. All of them have a size, a
complexity and a quality that can be expressed in terms of quantitative values such
as pages of documentation, lines of code and number of table entries. These are
examples of physical quantities. There are also logical quantities such as the number
or requirements, the number of design entities, the number of modules, the number of
statements and the number of test cases. In measuring software, one must
distinguish between physical and logical measurements. There is a big difference
between counting lines of code and counting statements, just as between counting
data values and counting data definitions. Those who measure software must be
aware of those differences.
Software Measurement News 26(2021)1News Papers 25
2.1 Requirement documents
Measuring a requirement document requires a model of the requirements. It must be
possible to count the model entities like processes, objects, use-cases and rules.
Currently, there is no generally accepted model for specifying requirements such as
UML for the system design. The burden of defining a requirement model is put on the
individual user. Whoever is measuring the requirements must take over that model
and define measurements for it. Not even the often cited function-points have a
generally accepted model behind them. So it means that requirement measurement
have only a local significance. They cannot be compared among different
organizations. Nevertheless requirements should be measured if only for comparison
of past and present projects. It is up to those responsible for their measurement to
define a model based on current requirement texts and to identify the model entities
within that text. Once they are identified, the entity types can be counted and
measurements made with those counts such as the number of business processes,
business objects and business rules. The important thing is that they are counted in
the same way in all of the requirement documents of that particular user organization.
These elementary counts can then be used to compute more complex metrics such
as function-points data-points, object-points and use-case points. These are the
metrics used to make cost calculations based on requirements. This is the foremost
goal of requirement measurement, but there are other goals as well such as
determining the completeness and consistency of the requirements, and assessing
the requirement quality.
Tab. 1: Sample of Size Measurement based on Requirement
Documentation
2.2 Design models
Measuring design models is much easier than measuring requirement documents
because they are formally defined, mostly in the form of an XMI schema. UML
models appear to the user as a series of interrelated diagrams but behind these
diagrams is an XMI schema which can be processed and parsed. The XML parser
can easily recognize the model entities and count them, entities such as classes,
interfaces, methods and data attributes. In the UML-2 language there are 13 different
Software Measurement News 26(2021)126 News Papers
entity types. Counting them makes it possible to compute metrics for design size,
complexity and quality. In this way it is possible to measure object points as well as
function points and to estimate effort based on these adjusted sizes. It is also
possible to compare design models and to judge the quality of the system design. If
the design is found to be faulty it is still possible to correct it before coding begins.
This is the main advantage of design measurement. It can also be used to calculate
the costs of coding and testing, but for calculating the overall costs of development, it
comes too late.
Tab. 2: Sample of Complexity Measurement based on Design
Documentation
2.3 Source Code
The source code is considered by naïve users to be the software per se. It is all that
matters and is all that is worth maintaining. This is a very narrow definition of
software. If the code is really all that matters, it makes no sense to document the
requirements or to create a design model. The fact is that if we only retain the source
code, there is nothing to test the source code against. Since we cannot compare it
with anything else, we have no way of determining whether it is right or wrong. We
are testing the code against itself. Besides our view of the software system is
restricted to this one perspective, namely to that of the coder. Users, analysts,
designers and testers are excluded from understanding the software. If they want to
understand it, they had best learn the programming language it is written in.
For some conniving coders this might be what they want. They don’t want anyone
else to understand what they are doing. This is definitely not good for the application
system and in the long run it is not good for the programmers. Their narrow view of
the system should be enhanced by other views at higher levels of abstraction. The
saying that one cannot see the forest because of the trees fits very well here. To truly
comprehend a complex software system one must view it from different perspectives.
Not only the programmers but also the analysts, designers data modelers and testers
must be able to understand the system and to follow its evolution. This and the need
for a base line to test against is reason enough to maintain the adjacent documents.
Software Measurement News 26(2021)1News Papers 27
Still, we need to be able to comprehend ant to measure the source code itself.
Measuring the source code means we have to model the structure of the code and to
count the code entities – statements, procedures, data declarations, parameters, etc.
With these counts we can then measure the code size, complexity and quality. The
literature is rich with metrics for measuring code. One must however collect the
numbers for feeding those metrics by parsing the code. The problem with that is there
are so many different programming languages and each must have its own parser.
Even within the same user organization there may be several languages used. To
estimate and trace the costs of software evolution, all of them have to be measured
according to the same rules. This is the greatest barrier to code measurement.
The positive aspect of code measurement is that almost every software property can
be derived from the code including such abstract properties as function-points and
object-points. Standards are now emerging for counting them and, since the
programming languages are formally defined, the counting algorithms can be
automated. There may be excuses for not measuring the requirement and the design,
but there is no excuse for not measuring the code. It is the first step to installing a
software measurement program.
Tab. 3: Sample of Quality Measurement based on the Source Code
2.4 Testware
Only recently has the testware of a system become an object of measurement. Up till
now test ware was considered to be an unmeasurable substance because it was not
definable. Thanks to the work of the testing community founded by Gelperin and
Hetzel and institutionalized in the ISTQB test ware has now become measurable. It
consists of the test cases and the procedures for executing them as well as the test
data and the procedures for generating and validating that. These procedures are
documented in the form of test scripts, test case tables, XML forms, test data tables
and assertions. In so far as these documents are at least semi formally defined, they
can be parsed and their contents measured. The first step is to define a set of test
case attributes common to most tests, attributes such as the parameters to and the
results from a test case, with value ranges, as well as the exception conditions.
Software Measurement News 26(2021)128 News Papers
The goal is to determine the size of the test procedures and the number of test cases
with their attributes. With this information, converted to test-points, it should be
possible to estimate the costs and time of testing a system before testing begins.
Once testing has begun, it becomes possible to document the progress of the test.
On the one hand the test coverage is recorded both for the functionality and the data.
Functional test coverage is measured in terms of number of functions tested relative
to the number of functions specified. Data coverage is measured by comparing the
number of data items defined with the number of data values generated. Code
coverage is based on the ratio of statements executed relative to the sum of all
statements. This data reveals the extent to which the target system has been tested.
It is up to the testers to install and to use the tools for recording the test coverage
measures.
Parallel to recording the test coverage, testers should also be recording the errors
that occur. Any time a result occurs which does not match the result specified in the
test case definition, an exception is triggered. These exceptions are recorded as
potential errors to be validated by the tester. Once they are validated by the
responsible tester, the potential errors become real errors and are placed in the
project error log. The error log becomes part of the test documentation along with the
test coverage reports, the test scripts and the test case specifications. The contents
of the test documentation become objects of measurement. In fact many counts and
metrics are already included in that documentation. So it is only a question of copying
and aggregating them.
3 How should software be measured?
Once it is clear what to measure, the next question is how to measure it. How to
measure is of course dependent on what we are measuring.
Software Measurement News 26(2021)1News Papers 29 Measuring a requirement document requires other metrics than measuring source code, but the measurement techniques are similar for all software artefacts, be it code, documents or testware. The artefacts are texts, diagrams or tables. Behind the formal diagrams – such as UML – are texts in some kind of markup language like XML. Also the tables can be converted to text. Whatever is in a text format can be converted scanned or parsed automatically. This leaves only the free form graphics to be measured manually. In the case of such diagrams one must visually examine the graphics and count the different graphic objects. Since this is a very time consuming activity, it is seldom done. Normally is too expensive to practice. That means that only software which can be automatically processed can be feasibly measured. This applies to source code, design models, test cases and requirement texts in so far as they are properly prepared. Only source code and standard design models can be measured with no preprocessing. Requirement texts and test cases have to be pre- processed. The prerequisite to measuring requirements is to mark up the requirement text. The requirement model entities must in some way be made recognizable. Either they are labeled from the beginning when writing the requirements or their identifiers are inserted into the finished text. One sample solution used by this author is to insert label lines before each text segment or table to which the label applies. (see Sample). A text parser should be able to recognize the markers and identify them as measurable entities. Besides the labels which mark the beginning of a model entity, there should also be some sort of delimiter to mark the end of that entity. Everything between the beginning marker and the end marker is considered to belong to that entity. The goal is to count the occurrences of each entity type as a means of measuring system size without rewriting the document. Without knowing the system size of a software system it will never be possible to estimate the costs of doing something with that system whether it is to develop it, to maintain it, to reengineer it or to convert it. In the case of a new development it may only be possible to measure the requirements. Therefore we will need requirement metrics. For maintenance, reengineering or conversion we can measure the source code. There are now well established techniques for measuring source code. We need only a parser for that particular language which recognizes specific language elements such as lines of code statements, data objects, procedures, modules, etc. These have to be counted and weighed. Many of the same elements can be found in the design model, only at a higher level of abstraction. In an UML-XMI schema each entity type is identified. The same applies to the test case schema. The problem there is that there is no universal standard for naming the test entities. The user has to define requirement and test entities for himself. This can be done with a test entity table. As already pointed out the main barrier to a complete measurement of all software artefacts from the requirements to the testware is the lack of a universal requirement model. For the time being users must help themselves by defining their own model in the form of a domain specific language which can be processed and measured. Software Measurement News 26(2021)1
30 News Papers
4 Conclusions on Software Measurement
It has been stated before that without measurement there can be no engineering.
Measurement is a condition sine qua non to any engineering discipline. This applies
also to software engineering, and what is more to requirements engineering. Most of
the currently used software artefacts can already be measured. Even the
requirements can be measured if they are put into at least a semiformal model with
recognizable, well defined entities and relationships. With the data gathered from the
documents, the code and the testware it is possible to fulfil the goals of software
measurement at all levels of abstraction:
requirement level
design level
code level and
test level,
namely to
predict future project costs
determine current project status and
assess the quality of products.
5 References on Software Measurement
Ebert, C., Dumke, R, Bundschuh, M., Schmietendorf, A.(2005): Best Practices in Software
Measurement, Springer Verlag, Berlin.
Ebert, C., Dumke, R.(2007): Software Measurement, Springer Verlag, Berlin.
Sneed, H., Seidl, R. (2010): Software in Zahlen, Hanser Verlag, München
Software Measurement News 26(2021)1News Papers 31
Large Scale Software Systems
and Their Project Indicators
Reiner Dumke, Anja Fiegler, Cornelius Wille
University of Magdeburg, Microsoft Germany,
and Technical University of Applied Science Bingen, Germany
1 Introduction
The following paper considers the large scale software systems that are used of us
every day. Software permeates our lives to an ever greater extent, as already
expressed by pervasive computing. For the most part, software systems are available
constantly and everywhere (as ubiquitous computing) and influence us in a
permanent way.
Especially in the commercial sector, the relationships and dependencies between
software systems continue to increase, as can be clearly seen, for example, in the
Gallery of e-Business Systems by R. Neumann [15].
On the other hand, the consequences of poor software quality with regard to a
software system or its development and application process are often dangerous and
sometimes dramatic (see the sufficiently well-known collection of software application
errors by P. Neumann [14]).
This makes it all the more important to ensure the quality and controllability of
extensive software systems. For this purpose, there are extensive quality criteria and
measures that signal the possibility of quality deficiencies or can also identify them
from the experience of empirical software engineering.
The estimation of important project indicators in this context is supported by different
tools. In this paper, the estimations of these essential project data are based of our
SoftwareExpert App (available in the Google Play Store) (see [4] and [6]). The
estimation could be select from a list of authors for a special kind of project metrics or
you can use all shown metrics building the average values. In our paper we have
chosen the average metrics values (the project costs excluded).
The way our app is used, especially for estimating important project and product
features, is illustrated in the following figure. It shows that for the application of the
estimation formulas, a scope measure such as Lines of Code, Story Points, Feature
Points and others are necessary to perform the respective estimations. For this, a
conversion into the scope measure of this app (the COSMIC Function Points) is only
necessary at the beginning (see figure 1).
Software Measurement News 26(2021)132 News Papers
Fig.1: Software Size Conversion with our SoftwareExpert App
Especially for the estimation in our app, we have used the already very extensive
literature collection of our community, such as [1], [2], [5], [7], [8], [11], [12], [13], [16],
[18], [19] and many other more. There is also the possibility to select certain preferred
estimation or to define your own estimation formula or estimation factor in out app.
2 Considered Software Systems
Our analysis is based on a review by Desjardins [3] of very large software systems
and their size in lines of code. We have selected some of these huge software
systems, as they mostly accompany us in our daily lives.
We use our smartphones every day, marvel at flights into space, edit our videos and
photos, file with modern aeroplanes, communicate via Facebook, dream of
autonomous driving and Google daily for terms, topics or localities in the world. All
these software systems surround us constantly, and most of them expect a high level
of reliability.
The following table shows the selected systems, their scope in Lines of Code and the
CFPs (COSMIC Function Points) already converted by our app, which are the basic
scope measure for applying the estimates.
Software Measurement News 26(2021)1News Papers 33
Software System Lines of Code COSMIC Function Points
Our SoftwareExpert app 15 000 367
Average iPhone app 40 000 980
Space Shuttle Software 400 000 9800
CESM Climate Model 1 200 000 29400
Hubble Space Telescope 2 000 000 49000
Photoshop C.S. 6 4 000 000 98000
Windows NT 3.1 4 200 000 102900
HD DVD Player on XBox 4 500 000 110250
Google Chrome 5 300 000 129850
Boeing 787 13 000 000 318500
F-35 Fighter jet 22 000 000 539000
Microsoft Office 2013 44 000 000 1078000
Facebook 62 000 000 1519000
Mac OS X “Tiger” 84 000 000 2058000
Car Software 100 000 000 2450000
Google 2 000 000 000 49000000
Tab. 1: Chosen Large Scale Software Systems from [3]
3 Measurement and Estimation Intentions
As a measurement result, we have already taken the software size as a given (here
we have also immediately converted the LOC into the CFP for the application of our
app).
For the estimates we can select the following two metrics or measures [4]:
1. Product measures: Of course, this includes the software size, the required
test cases, the documentation size, and the product defects (assuming
professional development of the systems).
2. Process and project measures: For this, we can use the project data known
from the literature on the required team size, development effort, testing effort
and documentation effort, project duration, productivity and project risk.
The following table shows an example of our SoftwareExpert application
characterizing the DVD player software.
Software Measurement News 26(2021)134 News Papers
Fig. 2: Example of Estimated Project Data using our SoftwareExpert App
For the estimation of the very large software systems considered here, it is
recommended to use the tablet version of our app.
4 Measurement and Estimation Results
Of course, it is not a surprise that small examples leads to small project data and
large ones to big data. Furthermore, the examples have different motivations and
intentions.
But, some estimations could be interesting and meaningful. Note, the size based
estimation don’t differ between the kind of system (real-time or business etc.).
In following we show some tables and leave the interpretation to the reader for his
own needs (PM means personal month). We have added the estimation results of our
SoftwareExpert app itself in order to characterize the quality and project data of the
measurement tool.
Software Measurement News 26(2021)1News Papers 35
Software System Team Size Documentation Size Estimated Number
(in pages) of Errors
Our SoftwareExpert app 6 6937 67
Average iPhone app 16 18524 180
Space Shuttle Software 155 185266 1807
CESM Climate Model 465 555803 5422
Hubble Space Telescope 775 926338 9038
Photoshop C.S. 6 1550 1852678 18077
Windows NT 3.1 1628 1945313 18981
HD DVD Player on XBox 1744 2084264 20337
Google Chrome 2054 2454800 23952
Boeing 787 5039 6021209 58752
F-35 Fighter jet 8527 10189730 99427
Microsoft Office 2013 17054 2037948 198855
Facebook 24031 2871654 280204
Mac OS X “Tiger” 32558 3890628 379632
Car Software 38759 4631700 451943
Google 775180 92634000 9038866
Tab. 2: Chosen Large Scale Software Systems and their required team size,
documentation size and their potential defectiveness
Team size and the documentation size are classic orientations that are primarily
intended to illustrate a respect for the complexity of scope in these software systems.
However, special attention should be paid to the Number of errors contained in the
software system, especially under the condition of a professional development of
these systems. This does not mean that the software developers or programmers did
a bad or inadequate job of development, but is mainly due to the complexity of these
software systems.
From theory we know that a (correct) specification model M as algorithms A written in
a modelling language ML results in a programme P in a programming language PL
during implementation compiled with an (optimizing) compiler C, using a (class/asset)
library B, running of a chosen operating system O in a server grid G, using some
services S of a cloud etc., i.e. as a simplified formula
S(A)ML →reification PPL →optimizing PC,B →execution O(P)G,S (eq. 3.1)
Software Measurement News 26(2021)136 News Papers
This concise presentation is also necessary in theory in order to fundamentally
consider the problems of verifiable transfer of a specification into a programme
implemented in a special programming language (such as the reification from
specification to formal design and finally to formal implementation [9]).
The complexities analysed here consider, for example, the processing effort (whether
polynomial or exponential) or even the realisability in general (as non-determinism or
non-feasibility) etc. The main forms of complexity are summarised in the Rogers
Gallery of Complexity (see in [10]).
In practice, however, there are other features or influences on complexity
characterised by empirical software engineering. Consequently, the overall
implementation task above is:
A programme P developed by the developer W with the training A and
the experience E of the department I of the company F in the
programming language L with the programme library B in the
development time T and the development methodology M to the
current (modern) paradigm G, the test procedure V, with the hardware
H from the manufacturer R from an underlying algorithm S with the
complexity K and a proven quality Q for the customer C, and thus
S →W,A,E,I,F,L,B,T,M,G,V→ P →H,R,K,Q,C O(P) (eq. 3.2)
Capers Jones has summarised these further complexity features, among others, in a
list of 24 types of complexity [11]. Of course, the complexities corresponding to (eq.
3.1) belong to it, such as Algorithmic complexity, Computational complexity and
Problem complexity. Furthermore, complexities such as Code complexity, Data
complexity and Flow complexity are already involved.
However, such complexities as Cyclomatic complexity, Combinatorial complexity,
Diagnostic complexity, Entropic complexity, Essential complexity, Fan complexity,
Function point complexity, Graph complexity, Halstead complexity, Information
complexity , Logical complexity, Mnemonic complexity, Organizational complexity,
Perceptional complexity, Process complexity, Semantic complexity, Syntactic
complexity and Topological complexity are relevant could be identified by any metrics
or measures and could apply to all components as W, E, M, G etc.
Hence, the consideration of the number of errors in Table 2 should therefore on the
one hand also take into account the complexity of this extensive software, but on the
other hand should also be understood as an indication of the "only" achievable
quality.
Software or programme errors are the price to pay for the challenge
of incorporating and mastering high complexities.
The next table summarises the respective estimated efforts of the software
systems considered.
Software Measurement News 26(2021)1News Papers 37
Software System Development Test Effort Documentation
Effort (in PM) (in PM) Effort (in PM)
Our SoftwareExpert app 15 6 4
Average iPhone app 41 16 11
Space Shuttle Software 412 157 108
CESM Climate Model 1235 470 323
Hubble Space Telescope 2058 784 539
Photoshop C.S. 6 4116 1568 1078
Windows NT 3.1 4321 1646 1131
HD DVD Player on XBox 4630 1764 1213
Google Chrome 5454 2077 1428
Boeing 787 13377 5096 3503
F-35 Fighter jet 22638 8624 5929
Microsoft Office 2013 45276 17248 11858
Facebook 63798 24304 16709
Mac OS X “Tiger” 86436 32928 22638
Car Software 102900 39200 26950
Google 2058000 784000 539000
Tab. 3: Chosen Large Scale Software Systems and their Development, Test
and Documentation Effort (PM means personal month)
The large expenditure figures are of course based on the assumption of a typical
(classic) team size and the considerable effort required for (classic) detailed
documentation of all project processes.
Of course, the entire Google development did not take 170000 years. These efforts
are rather to be seen as the challenge that the respective software developers or
providers face and have to overcome.
Also, we did not produce the usual 6000 pages of documentation for our app either.
Finally, the last table shows the necessary test cases for a complete test of the
system, the usual project duration and the so-called respective risk factor
according to Jones [12].
Software Measurement News 26(2021)1Sie können auch lesen