Christopher Pollin (Universität Graz, Institut Zentrum für Informationsmodellierung) "Dashboardfizierung" Historischer Rechnungsbücher - BBAW
←
→
Transkription von Seiteninhalten
Wenn Ihr Browser die Seite nicht korrekt rendert, bitte, lesen Sie den Inhalt der Seite unten
Christopher Pollin (Universität Graz, Institut Zentrum für
Informationsmodellierung)

„Dashboardfizierung“ Historischer Rechnungsbücher
Ontologiebasierte Informationsvisualisierung für historische Daten

Virtuelles Digital Humanities Kolloquium der Berlin-Brandenburgischen Akademie der
Wissenschaften ; (Berlin) : 2021.05.07

Persistent Identifier: urn:nbn:de:kobv:b4-opus4-35173

Die vorliegende Datei wird Ihnen von der Berlin-Brandenburgischen Akademie der Wissenschaften unter einer
Creative Commons Namensnennung 4.0 International Lizenz zur Verfügung gestellt.
“Dashboardfizierung” Historischer
Rechnungsbücher
   Ontologiebasierte Informationsvisualisierung für
   historische Daten

                         Christopher Pollin
                         Zentrum für Informationsmodellierung - Austrian
                         Centre for Digital Humanities
                         07.05.2021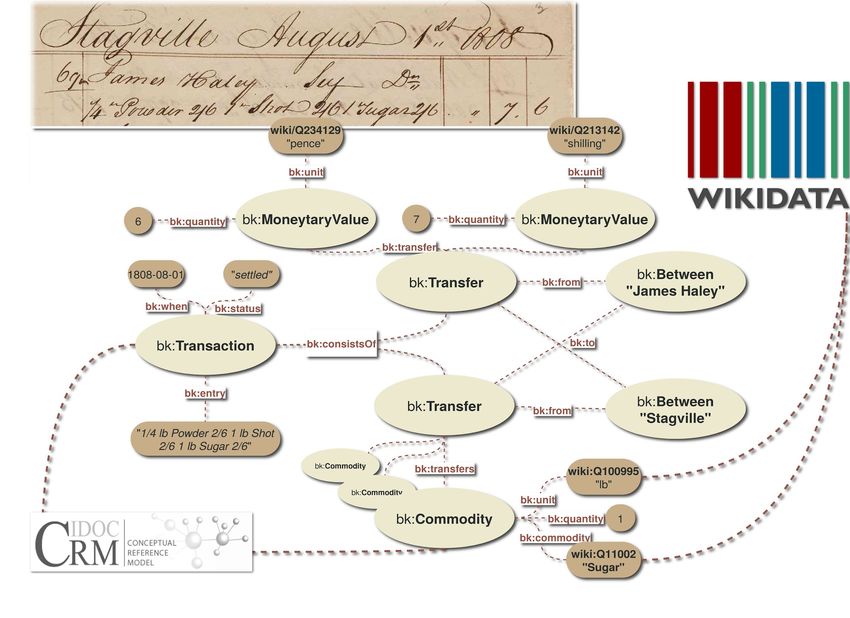
Motivation
Ten years ago the research focus in semantic portal development was on data
harmonization, aggregation, search, and browsing [...]. At the moment, the rise of
Digital Humanities research has started to shift the focus to providing the user with
integrated tools for solving research problems in interactive ways [...]
    Hyvönen, Eero. (2019). Using the Semantic Web in digital humanities: Shift from data publishing to data-analysis and serendipitous knowledge
    discovery. Semantic Web. 11. 1-7. 10.3233/SW-190386.

[The Semantic Web] as an inherently application-driven field, this consolidation will have
to happen across its sub-fields, resulting in application-oriented processes that are
well-documented as to their goals and pros and cons, and which are accompanied by
easy-to-use and well-integrated tools supporting the whole process.
    Hitzler, P. (2021). A review of the semantic web field. Communications of the ACM, 64(2), 76-83.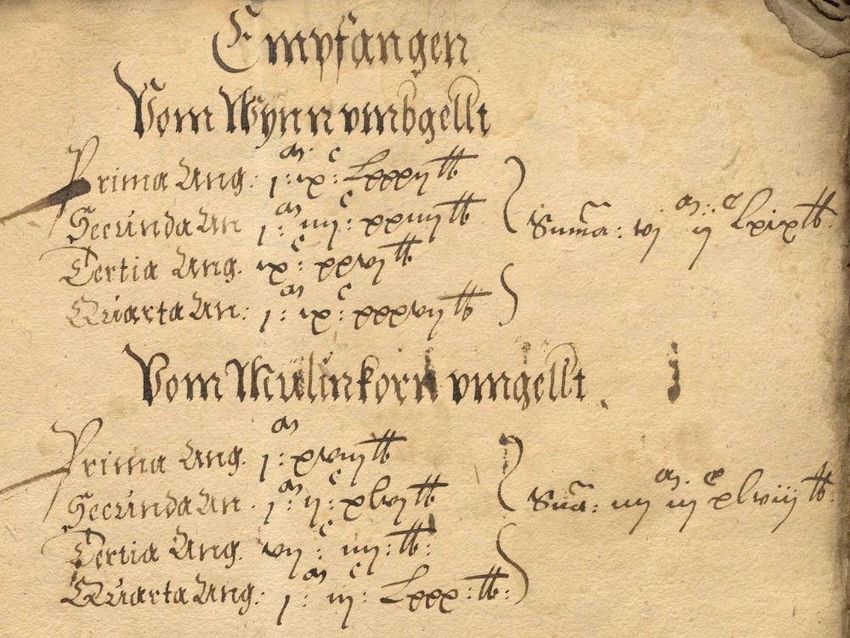
DEPCHA - Digital Edition Publishing Cooperative for Historical Accounts

  Historische Daten       Bookkeeping Ontology               Dashboard

                  User Stories          Ontology - InfoVis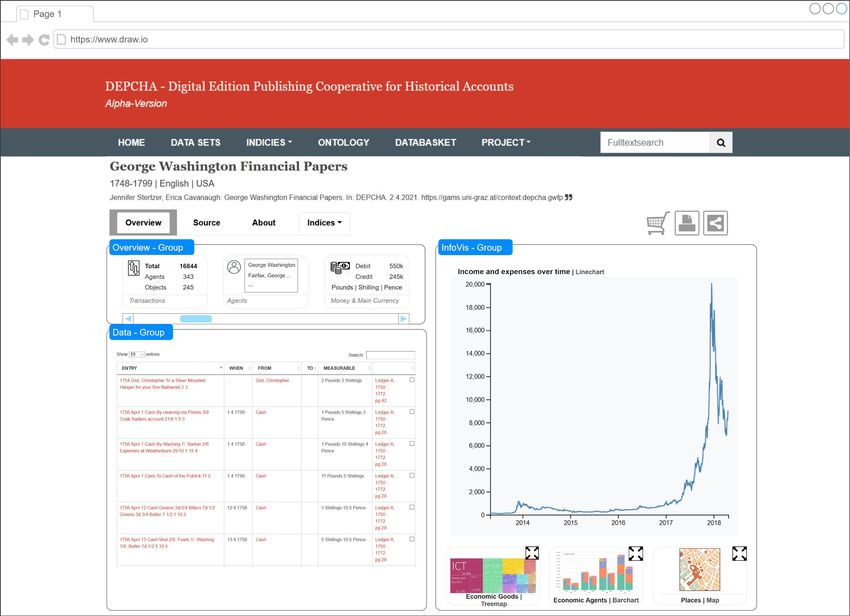
Die Domäne: Transaktionen in historischen Rechnungsunterlagen

                      bk:Money        bk:Money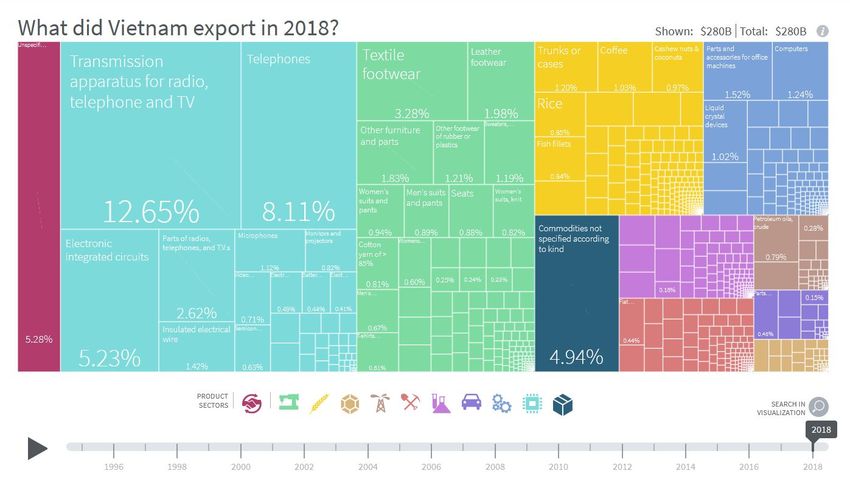
DEPCHA - Workflow
                                     Information
                                     Visualisation

                                   Search & Discovery

                    BOOKKEEPING
                     ONTOLOGY

                                    Self-organisation

         Prototyp
         gams.uni-graz.at/depcha
Dashboard?
A “faceted analytical display” is a
set of interactive charts (primarily
graphs and tables) that simultaneously
reside on a single screen, each of
which presents a somewhat different
view of a common dataset, and is
used to analyze that information.

Few, S., & Edge, P. (2007). Dashboard confusion revisited.   Janes, A., Sillitti, A., & Succi, G. (2013). Effective dashboard
Perceptual Edge, 1-6.                                        design. Cutter IT Journal, 26(1), 17-24.
Informationsvisualisierung (InfoVis)
Computer-based visualization systems provide visual representations of
datasets designed to help people carry out tasks more effectively.
[...]
Vis designers must take into account three very different kinds of resource
limitations: those of computers, of humans, and of displays.

Munzner T. (2014): Visualization Analysis and Design, S.1.
Munzner T. (2014): Visualization Analysis and Design, S.17.
Data                                                            Visual Form
                                                                                                                                                                         Task
                                                                          Visual
 Raw Data                         Data Table                                                                     Views
                                                                        Structures

                 Data                                 Visual                               View
            Transformation                           Mappings                         Transformations
                                                                                                                                            Human Interaction

Referenzmodell der Informationsvisualisierung nach Card et al.
  ●   Card et al. (1991): Readings in Information Visualization: Using Vision to Think. Morgan Kaufmann, 02 Feb 1999.
  ●   Reiterer, H. / JETTER H. (2013): Informationsvisualisierung. In: Kuhlen et. al: Grundlagen der praktischen Information und Dokumentation : Handbuch zur Einführung in die
      Informationswissenschaft und - praxis. 6. Berlin, S. 192-206.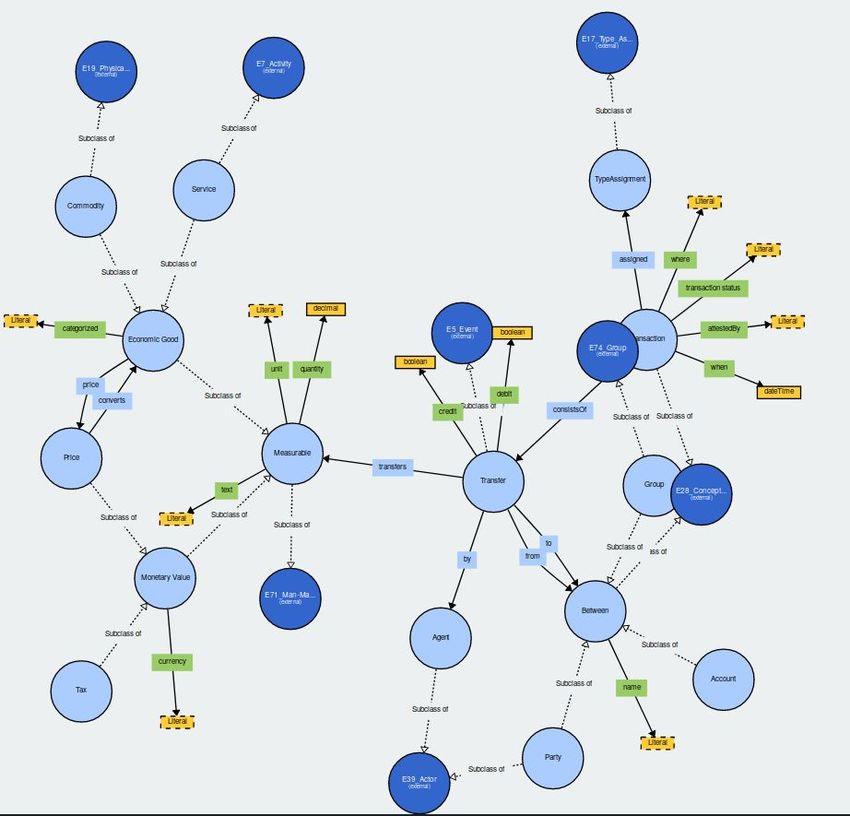
Zoomable Treemap Bar Chart
https://bl.ocks.org/cmgiven/4541f6de7b6fbef482aaa43f3a71f8d4
Wie kann “Wissen” innerhalb einer
Knowledge Base genutzt werden, um
(möglichst) generisch, aber user- bzw.
domänenspezifische
Informationsvisualisierungen für historische
(geisteswissenschaftliche) Information zu
implementieren?
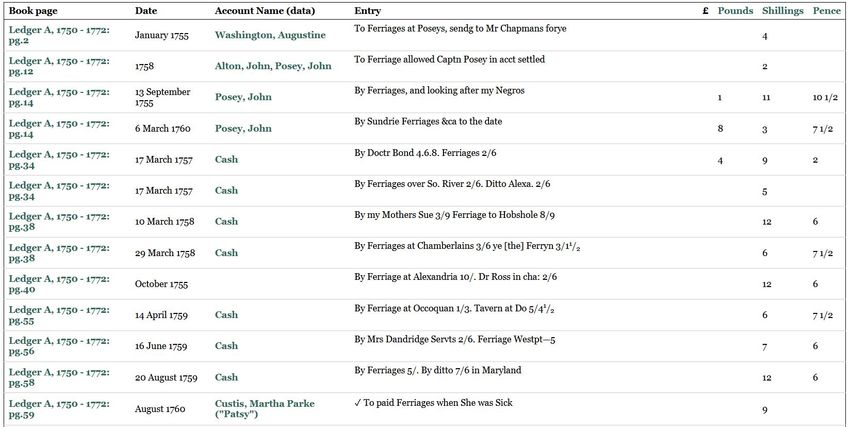
George Washington Financial Papers (1748-1799)
                                             Geschäfts- und Haushaltsakten des US-Präsidenten George Washington
  User Story
                                 Transaktionen zu “Ferriages”

STERTZER, Jennifer: Working with the Financial Records of George Washington: Document vs. Data. DigitalStudies/le Champ Numérique, 2014.
doi.org/10.16995/dscn.57. http://financial.gwpapers.org/
Epic
Als Historiker*in möchte ich Einnahmen/Ausgaben mit Bezug auf bestimmte
Wirtschaftsobjekte analysieren.
User Story 1
Als Wirtschaftshistoriker*in möchte ich Kosten für den Transport (T) von
Gütern und Personen im 18. Jahrhundert in den USA analysieren.
User Story 1.1 User Story 1.4
Ich möchte eine Aggregation aller Ich möchte nach einzelnen
Einnahmen, die durch T entstanden Wirtschaftssubjekten und deren
sind. Beteiligung an T filtern
User Story 1.5
User Story 1.2
Ich möchte Kategorien von T und
… eine Aggregation aller Ausgaben
deren zeitliche Veränderung über Jahre
durch T
untersuchen.
User Story 1.3
Ich möchte Einnahmen und Ausgaben User Story 1.6
für Teilbereiche im Bereich T ...
aggregieren.User Story 1.3
Ich möchte Einnahmen und
Ausgaben für Teilbereiche im
Bereich T aggregieren.
User Story 1.5
Ich möchte Kategorien von T
und deren zeitlichen
Veränderung über Jahre
untersuchen.
The Atlas of Economic Complexity. https://atlas.cid.harvard.edu/exploreUser Story 1.x
User Story 1.x
Ich möchte Ausgaben nach
Ich möchte die Entwicklung der
bestimmten Unterkategorien über die
Einnahmen untersuchen.
Zeit hinweg vergleichen.ProWD: Ein Werkzeug zum Erkennen von Datenlücken in Wikidata https://prowd.id Ramadhana, N. H., Darari, F., Putra, P. O. H., Nutt, W., Razniewski, S., & Akbar, R. I. (2020). User-Centered Design for Knowledge Imbalance Analysis: A Case Study of ProWD. In VOILA Workshop co-located with ISWC.
Von Daten zu Dashboard | InfoVis                            JavaScript Frontend
Grafana                                     d3.js
https://grafana.com/                        https://d3js.org/

Metabase                                    Plotly JavaScript
https://www.metabase.com/                   https://plotly.com/javascript/
                                            ….
Visual.is
https://visual.is/

metaphactory                                Vega – A Visualization Grammar
https://metaphacts.com/                     https://vega.github.io/vega/

      Late Hokusai Project. ResearchSpace   VISO – the Visualisation Ontology
                                            http://purl.org/viso

                                            RVL – an RDF(S)/OWL Visualisation
                                            Language
                                            http://purl.org/rvl
 Knowledge Base Management                                      Mapping InfoVis
Zusammenfassung und Plan...
❖ Datensätze und User Stories akquirieren → Weiterentwicklung des Modells
❖ Informationsvisualisierungen auf Basis der User Stories entwickeln
❖ Was braucht es noch im Frontend und Backend?
❖ Mapping: Wissensbasis → Informationsvisualisierungen
❖ Implementierung
❖ … wie ist das dann eigentlich mit Unschärfe, Vagheit, Unvollständigkeit etc. !?
… und wie mit dem Anschein von Objektivität und Absolutheit, der durch ein
Dashboard/Informationsvisualisierungen entsteht umgehen.Literatur 1
● Few, S., & Edge, P. (2007). Dashboard confusion revisited. Perceptual Edge, 1-6.
http://mail.perceptualedge.com/articles/visual_business_intelligence/dboard_confusion_revisited.pdf.
● Janes, A., Sillitti, A., & Succi, G. (2013). Effective dashboard design. Cutter IT Journal, 26(1), 17-24.
https://www.researchgate.net/profile/Alberto-Sillitti/publication/286996830_Effective_dashboard_design/links/57c699e208aec24de0414df
1/Effective-dashboard-design.pdf
● Hyvönen, Eero. (2019). Using the Semantic Web in digital humanities: Shift from data publishing to data-analysis and serendipitous
knowledge discovery. Semantic Web. 11. 1-7. 10.3233/SW-190386.
● Hitzler, P. (2021). A review of the semantic web field. Communications of the ACM, 64(2), 76-83.
https://cacm.acm.org/magazines/2021/2/250085-a-review-of-the-semantic-web-field/fulltext#R27
● Ramadhana, N. H., Darari, F., Putra, P. O. H., Nutt, W., Razniewski, S., & Akbar, R. I. (2020). User-Centered Design for Knowledge
Imbalance Analysis: A Case Study of ProWD. In VOILA Workshop co-located with ISWC. http://ceur-ws.org/Vol-2778/paper2.pdf
● Ehrlinger, L., & Wöß, W. (2016). Towards a Definition of Knowledge Graphs. SEMANTiCS (Posters, Demos, SuCCESS), 48, 1-4.
http://ceur-ws.org/Vol-1695/paper4.pdf
● Haase, P., Herzig, D. M., Kozlov, A., Nikolov, A., & Trame, J. (2019). metaphactory: A platform for knowledge graph management. Semantic
Web, 10(6), 1109-1125.
● Pollin, C. (2019). Digital Edition Publishing Cooperative for Historical Accounts and the Bookkeeping Ontology. In RODBH (pp. 7-14).
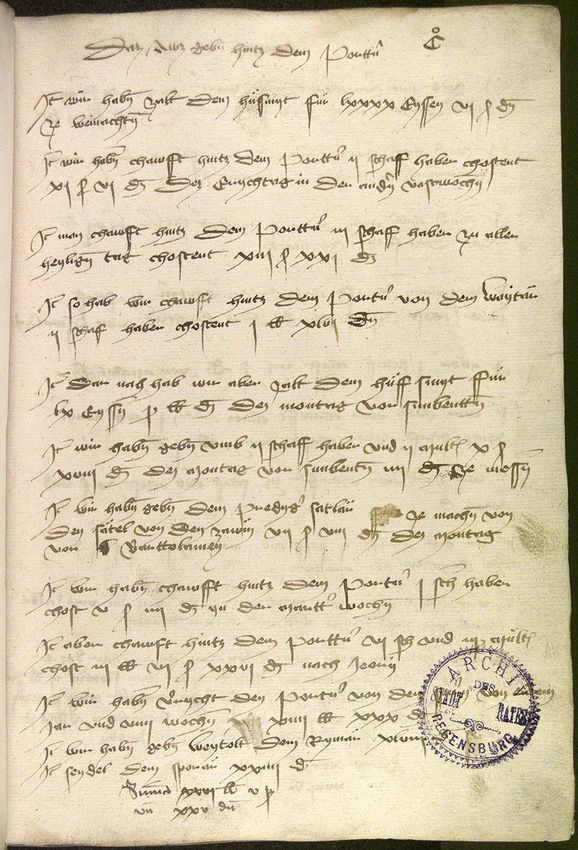
● Vogeler, G. (2015). Warum werden mittelalterliche und frühneuzeitliche Rechnungsbücher eigentlich nicht digital ediert. Grenzen und
Möglichkeiten der Digital Humanities, 307-328.
● Pollin, C. Digitale, formale Methoden und Modelle in den Geschichtswissenschaften. Am Beispiel digital editierter historischer
Rechnungsbücher (Doctoral dissertation, Karl-Franzens-Universität Graz).
● Anderson, C., Eide, O., Orlowska, A., Pindl, K., Tomasek, K., & Vogeler, G. (2016). Modeling semantically Enhanced Digital Edition of
Accounts (MEDEA) for Discovery and Comparison on the Semantic Web.
● Feilmayr, C., & Wöß, W. (2016). An analysis of ontologies and their success factors for application to business. Data & Knowledge
Engineering, 101, 1-23, https://doi.org/10.1016/j.datak.2015.11.003.
● Satyanarayan, A., Moritz, D., Wongsuphasawat, K., & Heer, J. (2016). Vega-lite: A grammar of interactive graphics. IEEE transactions on
visualization and computer graphics, 23(1), 341-350.
● Polowinski, J. (2017). Ontology-Driven, Guided Visualisation Supporting Explicit and Composable Mappings.
nbn-resolving.de/urn:nbn:de:bsz:14-qucosa-229908.Literatur 2
● Fluit, C., Sabou, M., & Van Harmelen, F. (2006). Ontology-based information visualization: toward semantic web applications. In Visualizing
the semantic web (pp. 45-58). Springer, London.
https://www.researchgate.net/publication/237419493_Ontology-Based_Information_Visualization_Toward_Semantic_Web_Applications
● Hoang, D. T. A., Nguyen, T. B., & Tjoa, A. M. (2012, October). Dashboard by-example: A hypergraph-based approach to on-demand data
warehousing systems. In 2012 IEEE International Conference on Systems, Man, and Cybernetics (SMC) (pp. 1853-1858). IEEE.
https://publik.tuwien.ac.at/files/PubDat_211630.pdf
● Gitanjali, J., Kuriakose, M., & Kuruba, R. (2014). Ontology and hyper graph based dashboards in data warehousing systems. Asian Journal
of Information Technology, 13(8), 412-415.
https://www.semanticscholar.org/paper/Ontology-and-Hyper-Graph-Based-Dashboards-in-Data-Gitanjali-Kuriakose/e67dbd2652e0edc3b
2d71c0eb57adaafc8b0030b
● Díaz, A. R., Benito-Santos, A., Dorn, A., Abgaz, Y., Wandl-Vogt, E., & Therón, R. (2019). Intuitive ontology-based sparql queries for rdf data
exploration. IEEE Access, 7, 156272-156286. https://ieeexplore.ieee.org/document/8873596
● Borland, D., Christopherson, L., & Schmitt, C. (2019). Ontology-Based Interactive Visualization of Patient-Generated Research Questions.
Applied clinical informatics, 10(3), 377.https://www.thieme-connect.com/products/ejournals/abstract/10.1055/s-0039-1688938
● Mewes, T. (2018): Konzeption und prototypische Implementierung einesweb-basierten Dashboards zur Softwarevisualisierung.
Masterarbeit. https://core.ac.uk/download/pdf/226136558.pdf
● Po, L., Bikakis, N., Desimoni, F., & Papastefanatos, G. (2020). Linked Data Visualization: Techniques, Tools, and Big Data. Synthesis
Lectures on Semantic Web: Theory and Technology, 10(1), 1-157. dx.doi.org/10.2200/S00967ED1V01Y201911WBE019
● Salinas, E., Cueva, R., Paz, F.: A systematic review of user-centered design. In: Techniquesin International Conference on HCI. pp. 253–267
(07 2020)
● Sinclair, S., Ruecker, S., & Radzikowska, M. (2013). Information visualization for humanities scholars. Literary Studies in the Digital Age-An
Evolving Anthology.
https://www.researchgate.net/profile/Implementing-New-Knowledge-Environments-inke/publication/273450219_Information_Visualization_
for_Humanities_Scholars/links/5501fd4b0cf24cee39fb281f/Information-Visualization-for-Humanities-Scholars.pdfMaterialien
Ontologie
An ontology is a formal, explicit
specification of a shared
conceptualization that is
characterized by high semantic
expressiveness required for
increased complexity.

Feilmayr, C., & Wöß, W. (2016). An analysis of ontologies and their
success factors for application to business. Data & Knowledge
Engineering, 101, 1-23,
https://doi.org/10.1016/j.datak.2015.11.003.
Wheaton Daybook
1828-1859
[Tomasek, Bauman]

                                                            Jahresrechnungen der
Stagville Slave                                             Stadt Basel
Ledger 1792-1799                                            1535-1610
[Brumfield,
Agbe-Davies]

George                                                      StadtA
Washington                                                  Regensburg,
Financial Papers    BOOKKEEPING ONTOLOGY                    Cameralia 3
1792-1799
[Stertzer]          gams.uni-graz.at/o:depcha.bookkeeping
                    github.com/GVogeler/bookkeeping
                    [Georg Vogeler]
metaphactory [...] a platform for building knowledge graph management applications. [...] providing a rich and customizable user interface, and enabling rapid building of use case-specific applications. Haase, P., Herzig, D. M., Kozlov, A., Nikolov, A., & Trame, J. (2019). metaphactory: A platform for knowledge graph management. Semantic Web, 10(6), 1109-1125.
Generische Linked Data Visualisierung vs. User-Centered Design

                https://tinyurl.com/nkzyb5pd

Salinas, E., Cueva, R., Paz, F.: A systematic review of user-centered design. In:
Techniquesin International Conference on HCI. pp. 253–267 (07 2020)
Projekt Six Degrees of Francis Bacon
sozialen Netzwerken im frühneuzeitlichen Großbritannien, 1500-1700
Forschungsfragen:
● For instance, how can visualizations represent the uncertainty,
vagueness, and debate that are central to humanities inquiry?
● How can designers use visualizations to coordinate quantitative
measures and human judgements?
● What are principled ways of reducing the complexity of social
relations to visual form?
● How can a web interface be part of an ongoing scholarly
knowledge project?
● And how might qualitative categories such as identity and group
belonging be presented alongside quantitative measures?Sie können auch lesen