Sixt Leasing SE Hauptversammlung 2019 - München 3. Juni 2019

Die Seite wird erstellt Toni Fiedler
 
WEITER LESEN
Sixt Leasing SE Hauptversammlung 2019 - München 3. Juni 2019
Sixt Leasing SE
Hauptversammlung 2019

                           München
                        3. Juni 2019
Sixt Leasing SE Hauptversammlung 2019 - München 3. Juni 2019
Disclaimer
  This presentation contains certain forward-looking statements relating to the business, financial performance and results of the Sixt Leasing SE (together with its
  subsidiaries, the “Company”) and/or the industry in which the Company operates. Forward-looking statements, regardless if made orally or in writing, concern future
  circumstances and results and other statements that are not historical facts, sometimes identified by the words “believes,” “expects,” “predicts,” “intends,” “projects,”
  “plans,” “estimates,” “aims,” “foresees,” “anticipates,” “targets,” and similar expressions. Forward-looking statements, including assumptions, opinions and views of
  the Company or cited from third party sources, are solely opinions and forecasts which are uncertain and subject to risks. Actual events may differ significantly from
  any anticipated development due to a number of factors, including without limitation, changes in general economic conditions, in particular economic conditions in
  the Company’s target markets, changes affecting interest rate levels, changes in competition levels, changes in laws and regulations, environmental damages, the
  potential impact of legal proceedings and actions and the Group’s ability to achieve operational synergies from past or future acquisitions. The Company does not
  guarantee that the assumptions underlying forward-looking statements, regardless if made orally or in writing, are free from errors nor does it accept any
  responsibility for the future accuracy of opinions or any obligation to update the statements in this presentation to reflect subsequent events. Forward-looking
  statements are made only as of the date hereof. Neither the delivery of this presentation nor any further discussions of the Company with any of the recipients
  thereof shall, under any circumstances, create any implication that there has been no change in the affairs of the Company since such date. Consequently, the
  Company does not undertake any obligation to review, update or confirm investors' expectations or estimates or to release publicly any revisions to any forward-
  looking statements to reflect events that occur or circumstances that arise in relation to the content of the presentation.
  Furthermore, a totally different performance can ensue from an unexpected slump in demand or economic stagnation in our key market Germany and/or in other
  Western European markets. The actual development can differ materially from the forecasts made in this presentation, in case one of the aforementioned risks or
  other risks not mentioned here should materialize and/or the assumption on which we have based our forecasts and prospects turn out to be wrong.
  This presentation contains summary information only and does not purport to be comprehensive and is not intended to be (and should not be used as) the basis of
  any analysis or other evaluation. In addition, the information in this presentation is subject to change. No representation or warranty (express or implied) is made as
  to, and no reliance should be placed on, any information, including projections, estimates, targets and opinions, contained herein, and no liability whatsoever is
  accepted as to any errors, omissions or misstatements contained herein.
  The presentation is furnished to you solely for your information and may not be reproduced or redistributed, in whole or in part, to any other person.
  By accepting this presentation you acknowledge the foregoing.
Sixt Leasing SE Hauptversammlung 2019 - München 3. Juni 2019
DRIVE>2021 Highlights 2018:
Schwerpunkt auf Verbesserung des Rendite-Risiko-Profils

            D                            R                   R                     R
      ONLINE RETAIL WIRD                 50% WENIGER      DIESELRISIKO IM NEU-   MEHR VERMARKTUNG
      #1 GESCHÄFTSFELD                  EURO-4/5 DIESEL   GESCHÄFT GESENKT          INS AUSLAND

            R                            I                   V                     E
         ERSTE EIGENE                  MANAGEMENT TEAM      1 MRD. EURO DIP        UNABHÄNGIGE
       STATION ERÖFFNET                   ERWEITERT           AUFGELEGT1)         REFINANZIERUNG

                                                                                                    3
    1) DIP = Debt Issuance Programme
Sixt Leasing SE Hauptversammlung 2019 - München 3. Juni 2019
Vertragsbestand per Ende 2018 ungefähr auf Vorjahresniveau –
Online Retail seit 2018 nach Vertragszahlen größtes Geschäftsfeld

    VERTRAGSBESTAND NACH GESCHÄFTSFELDERN [in ‘000]1)

                                                                               CAGR2)                                                                              Veränderung
                                                                                         +7%                 132,9                                                2018 ggü. 2017
                                                                                                                                   129,7
                                                                                        113,6
                                                                  103,2                                       48,1                  43,0                    33%       -10,5%
                                              97,4
                                                                                         47,5
                                                                   48,3
                     Flottenleasing           50,2
                                                                                                              39,4                  42,0                    32%       +6,6%
                                                                                         38,7
                                                                   33,8
              Flottenmanagement               31,4
                                                                                                              45,4                  44,7                    35%       -1,6%
                                                                   21,1                  27,4
                                              15,8
                       Online Retail
                                             2014                 2015                  2016                 2017                  2018

                                                                                                                                                                                   4
    1) Inkl. Leasingverträge, Flottenmanagementverträge, Serviceverträge und Bestellbuch (Verträge, bei denen das Fahrzeug noch nicht ausgeliefert wurde)
    2) CAGR = Compound Annual Growth Rate = Durchschnittliche jährliche Wachstumsrate
Umsatz und Vorsteuerergebnis im GJ 2018 gestiegen – Operative
Umsatzrendite mit 6,4% annähernd auf Vorjahresniveau

    UMSATZ [in Mio. EUR]                  VORSTEUERERGEBNIS (EBT) [in Mio. EUR]
                                                   Operative
                           8,3%                Umsatzrendite1)
                                                                           6,5%                            6,4%
                                  805,8
                   744,0
                                                                                          2,8%
      Verkaufs-                   325,3                                    29,7                            30,5
                   289,6                               Flotten-
         erlöse                                                             4,1                            4,4
                                                   management
                           5,7%

      Operativer                  480,5                   Leasing          25,6                            26,1
        Umsatz
                   454,4

                   2017           2018                                    2017                             2018
                                                                                                                  5
                                          1) Verhältnis von Vorsteuerergebnis (EBT) zu operativem Umsatz
Sixt Leasing setzt auch für 2018 die attraktive Dividendenpolitik fort –
Dividendenrendite bei 4,2%

    DIVIDENDE JE AKTIE [in EUR]        DIVIDENDENRENDITE1)
                                        Ausschüttungs-
                                                                         47%                             45%
                                               quote2)

             0,48         0,48                                                                          4,2%

                                                                       2,5%

             2017         2018                                          2017                            2018
                                                                                                               6
                                       1) Basierend auf dem Xetra-Jahresschlusskurs der Sixt Leasing-Aktie
                                       2) Im Verhältnis zum Konzernüberschuss
Leasingvermögen von knapp über 1,2 Mrd. Euro –
Solide Eigenkapitalquote von 15,6%

    BILANZSUMME [in Mio. EUR]               EIGENKAPITAL [in Mio. EUR]
           Netto-
                    1.054           1.020   Eigenkapitalquote   14,2%          15,6%
    verschuldung

                            -3,5%
                    1.443           1.393                               5,7%
        Sonstige    224             188                                        217
                            -1,2%
                                                                205

        Leasing-
       vermögen
                    1.219           1.204

                    2017            2018                        2017           2018
                                                                                       7
Wir gehen zehn Handlungsfelder an, um unser Geschäftsmodell
strategisch weiterzuentwickeln: Produkte und Kundenerlebnis

                                HEUTE                                         MORGEN

   D             Fahrzeugleasing mit fester Laufzeit und
                                                                       Flexible Fahrzeugnutzung
                            Kilometerzahl

   PRODUKTE                  Nur Neuwagen                               Gebrauchtwagenleasing

              Serviceprodukte als Teil des Leasingvertrages   Serviceprodukte eigenständig und nach Bedarf

   D
               Kundendienst überwiegend über Callcenter           App-basierte Self-Service-Funktionen
   KUNDEN-
   ERLEBNIS                                                    Auslieferung/Rücknahme auch über eigene
               Auslieferung/Rücknahme über Drittanbieter
                                                                               Stationen

                                                                                                             8
Wir gehen zehn Handlungsfelder an, um unser Geschäftsmodell
strategisch weiterzuentwickeln: Segmente & Märkte und Prozesse

                               HEUTE                                     MORGEN

   I     R
                  Fokus auf mittlere und große Flotten      Spezielles Angebot für kleinere Flotten

   SEGMENTE
                          Flottenmanagement                        Unternehmensmobilität
   & MÄRKTE

                        Fokus auf Deutschland               Schrittweise internationale Expansion

   D
               Noch viele manuelle und analoge Prozesse    Digitale Prozesse für Kunden und intern
   PROZESSE
                                                          Mehr Synergien/Zusammenarbeit zwischen
                 Geschäftsfeld-bezogene Ausrichtung
                                                                      Geschäftsfeldern

                                                                                                      9
Für 2019 leichter Anstieg des Konzernvertragsbestands erwartet –
Ergebnis durch Investitionen in Wachstum und Digitalisierung belastet

                                        2018                                        2019

     Konzernvertragsbestand      129.700 Verträge                              Leichter Anstieg

       Operativer Umsatz         480,5 Mio. Euro                        Ungefähr auf Vorjahresniveau

     Vorsteuerergebnis (EBT)      30,5 Mio. Euro                        Ungefähr auf Vorjahresniveau

                               Geschäftsentwicklung im ersten Halbjahr 2019 voraussichtlich deutlich
                                schwächer als im ersten Halbjahr 2018 und zweiten Halbjahr 2019

                                                                                                       10
Q1 2019: Rückgang von Vertragsbestand, operativem Umsatz
und Vorsteuerergebnis im Rahmen der Erwartungen

 VERTRAGSBESTAND [in ‘000]1) UMSATZ [in Mio. EUR]                                                                                                   VORSTEUERERGEBNIS [in Mio. EUR]
                                                                                                                                                        Operative
                                                                                                               15,2%                                Umsatzrendite2)
                                                                                                                                                                         6,7%               5,9%
                                 -3,1%
                 129,7                                                                                                         232,7
                                                 125,6
                                                                                               201,9
 Flotten-                                                                                                                                                                         -12,7%
 leasing
                  43,0                            41,4                                                                                                                    8,0
                                                                            Verkaufs-
                                                                                                                               113,0                         Flotten-
                                                                                                81,6                                                                      1,0                7,0
                                                                               erlöse                                                                    management
                                                                                                                                                                                             0,8
 Flotten-                                                                                                      -0,6%
  mgmt.
                  42,0                            41,8

                                                                                                                                                             Leasing      7,0
                                                                           Operativer                                                                                                        6,2
                                                                             Umsatz
                                                                                               120,3                           119,7
  Online
  Retail
                  44,7                            42,4

              Q4 2018                         Q1 2019                                       Q1 2018                         Q1 2019                                     Q1 2018            Q1 2019
                                                                                                                                                                                                     11
 1) Inkl. Leasingverträge, Flottenmanagementverträge, Serviceverträge und Bestellbuch (Verträge, bei denen das Fahrzeug noch nicht ausgeliefert wurde)
 2) Verhältnis von Vorsteuerergebnis (EBT) zu operativem Umsatz
Mittelfristausblick: Sehr starkes Wachstum der Geschäftsfelder
Online Retail und Flottenmanagement bis 2021 erwartet

                                                                                                    2021                                                    Veränderung ggü. 2018

      Konzernvertragsbestand1)                                                        ~ 200.000 Verträge                                                           ~ 50%

              Operativer Umsatz                                                          ~ 650 Mio. Euro                                                           ~ 35%

       Vorsteuerergebnis (EBT)                                                           40-45 Mio. Euro                                                           ~ 40%

                                                                                                                                                                                    12
    1) Inkl. Leasingverträge, Flottenmanagementverträge, Serviceverträge und Bestellbuch (Verträge, bei denen das Fahrzeug noch nicht ausgeliefert wurde)
Maßnahmen aus dem Strategieprogramm DRIVE>2021 sollen deutliches
Wachstum von Verträgen und Ergebnis unterstützen
     Schematische Darstellung des Wachstums von                                                                                                             ~ 200.000
     Konzernvertragsbestand1) und Vorsteuerergebnis (EBT) bis 2021                                                                                           Verträge

                                                                                                                                        INTERNATIO-           EBT
                                                                                                                                        NALISIERUNG          40-45
                                                                                                                                                            Mio. EUR
                                                                                         WACHSTUM
                                                                                          SERVICE-
                                                                                         GESCHÄFT
                                     WACHSTUM
      129.700                      LEASINGFLOTTE
       Verträge                     DEUTSCHLAND
          EBT
          30,5
      Mio. EUR
                                                               PROZESS- UND KOSTENOPTIMIERUNG

         2018                                                                                                                                                 2021
                                                                                                                                                                        13
    1) Inkl. Leasingverträge, Flottenmanagementverträge, Serviceverträge und Bestellbuch (Verträge, bei denen das Fahrzeug noch nicht ausgeliefert wurde)
Flottenleasing: Fokus auf Ausbau des Geschäfts mit kleineren Kunden
und weitere Diversifizierung des Kundenportfolios

                                                                                                        LOCAL SALES TEAM IN 5 REGIONEN AUFGEBAUT,
                                                                                                         UM KLEINERE FIRMENKUNDEN ZU BETREUEN
                                  < 10 Jahre
                                          5%
             10-15 Jahre
                                18%
                                                                               > 20 Jahre
                                                                      38%

                                           18 JAHRE

                                       39%
                 15-20 Jahre

                    DAUER DER BEZIEHUNG MIT
                    DEN 10 GRÖSSTEN KUNDEN1)

                                                                                                                                                    14
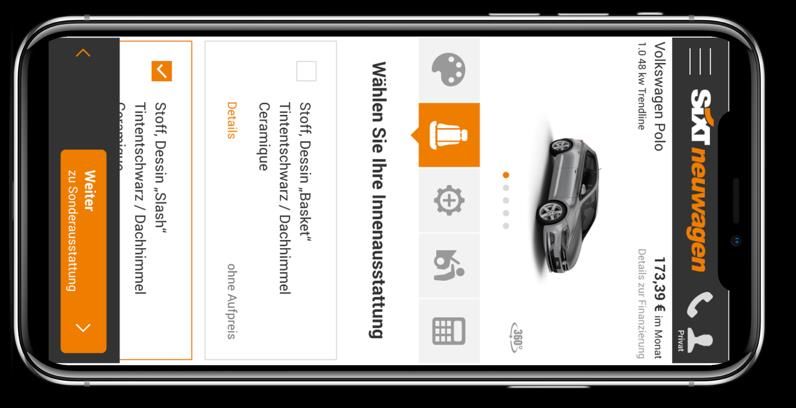
    1) Stand: 31.12.2018; auf Basis von Fahrzeugverträgen in Deutschland (ohne Bestellbuch und Serviceverträge)
Online Retail: Fokus auf Digitalisierung, Verbesserung des
Kundenerlebnisses und kundengruppenspezifische Angebote

                                                      Finanzierung des Traumautos
                                                      mittels Leasing/Vario-Finanzierung

                                   Autofan

                                                      Spezielle Kampagnenangebote
                                                      zu sehr attraktiven Preisen

                              Schnäppchenjäger

                                                      Sorgenfrei mit All-Inclusive-Paket
                                                      + erweiterter Flexibilität

                             Sicherheitsorientierte
                                    Käufer
                                                                                           15
Flottenmanagement: Fokus auf Europa-Expansion, Digitalisierung und
Einbindung innovativer Mobilitätskonzepte

                                                           We shape the Future of Corporate Mobility.

                  UK
                                 NL
                               NL
                                           DE

                                                  AT
                          FR          CH        AT

                                                IT
      ES

                                Bestehende
           Inlandsmarkt                                  Neue Zielländer
                                Auslandsgesellschaften                                                  16
Sie können auch lesen