Der Blick aus dem All in das System Erde The View into System Earth from Space - Chapter 02
←
→
Transkription von Seiteninhalten
Wenn Ihr Browser die Seite nicht korrekt rendert, bitte, lesen Sie den Inhalt der Seite unten
Kapitel 02
Der Blick aus dem All
in das System Erde

                   Chapter 02
The View into System Earth
                from Space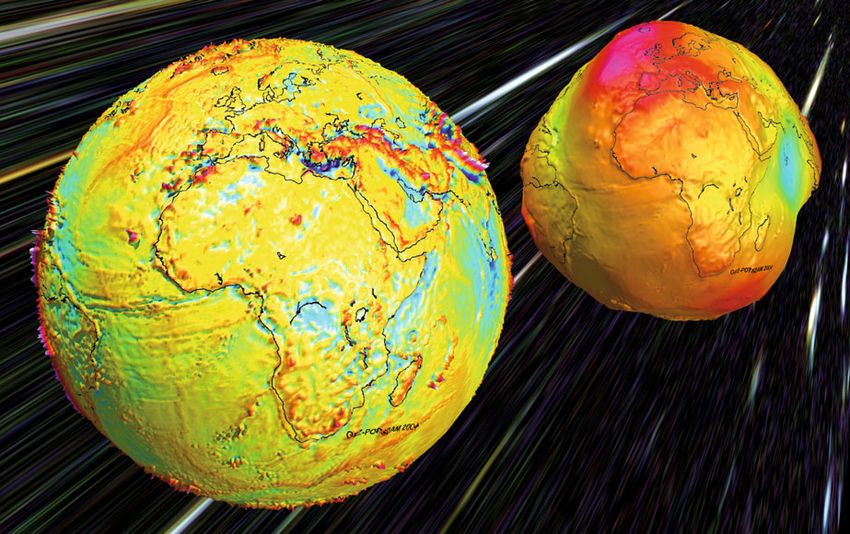
18      02 Der Blick aus dem All in das System Erde

       ine Fotografie der Erde, aufgenommen von einem        vor, die Erde wäre in ihrem Innern vollständig gleich-

E      Satelliten oder aus einer Raumstation in erdnaher
       Umlaufbahn, kommt uns heute völlig normal vor.
Als in den 1960er Jahren die ersten Aufnahmen unseres
                                                             mäßig aufgebaut. Aufgrund der Erdrotation zerrt die
                                                             Fliehkraft die Erdmasse von der Rotationsachse weg,
                                                             und zwar am stärksten am Äquator und am geringsten
Planeten aus größerer Distanz gemacht wurden und den         an den Polen. Das führt dazu, dass die Kugelform ein
Blick auf diesen Solitär im Weltraum auch für uns Erd-       wenig deformiert wird und die Erde sich am Äquator
bewohner ermöglichten, war das jedoch eine Sensation.        ausdehnt. Tatsächlich existiert diese von Newton und
Auch heute noch haben Bilder der Erde aus dem Welt-          Huygens postulierte Polabflachung der Erde: Der mitt-
raum eine hohe Faszination und einen besonderen              lere Erddurchmesser beträgt 12 740 Kilometer, aber die
ästhetischen Reiz. Aber die Erdbeobachtung aus dem All       Nord-Süd-Achse ist um rund 42 Kilometer kürzer als
dient nicht in erster Linie der kontemplativen Betrach-      die Ost-West-Achse am Äquator. Die Erde ist also in
tung. Satelliten sind heute ein Universalwerkzeug der        erster Näherung ein Rotationsellipsoid.
Forschung, und auch die Geowissenschaften kommen                Damit aber nicht genug. Newtons Gravitationsgesetz
längst nicht mehr ohne sie aus. Sie erlauben uns nicht       besagt, dass die Kraft, mit der der fallende Apfel in
nur einen Blick auf die Erde, sondern einen Einblick in      Richtung Massenmittelpunkt beschleunigt wird, direkt
das System Erde.                                             von der Größe der Masse und dem Abstand vom Mas-
    Es gehört zum Menschen, dass er versucht, seine          senmittelpunkt abhängt. Das bedeutet auf unseren
nähere und fernere Umgebung zu erforschen. So war die        Planeten angewandt, dass die Gravitationsbeschleuni-
Vorstellung von der Erde als einer flachen Scheibe für       gung variabel ist. An der Oberfläche des Rotationsellip-
frühe menschliche Gesellschaften sicherlich zur Orien-       soids wirkt aufgrund der Massenanziehung eine Gravi-
tierung in ihrem Lebensraum ausreichend. Dennoch             tationsbeschleunigung in Richtung des Mittelpunkts
wurde dieses Bild schnell durch astronomische Beobach-       von 9,81 m/s2, die zum Pol hin auf 9,83 m/s2 zunimmt.
tungen ergänzt, auch wenn die geozentrische Sichtweise       Berücksichtigt man noch die der Erdanziehung entgegen
zunächst nicht in Frage gestellt wurde. Die Kugelgestalt     gerichtete Zentrifugalbeschleunigung von –0,03 m/s2 am
der Erde ist den Menschen spätestens seit Pythagoras         Äquator, so ergibt sich eine Schwerebeschleunigung
(*540 v. Chr.) bekannt. Die Größe dieser Kugel errech-       (oder kurz Schwere) von 9,78 m/s2 am Äquator. An den
nete Eratosthenes (*276 v. Chr.) bereits mit einem           Polen fallen Gravitation und Schwere zusammen. Eine
Umfang von 252 000 Stadien, was etwa 40 000 km ent-          Waage zeigt demnach am Pol für einen normal gewichti-
spricht. Mit dem Beginn der modernen Naturwissen-            gen Menschen etwa 350 g mehr an als am Äquator, das
schaften im 17. Jahrhundert änderte sich der Blick radi-     heißt die Schwere ändert sich auf der Ellipsoidoberfläche
kal. Vorbereitet durch Kepler und vollendet durch            mit der geographischen Breite.
Galileo, rückte die neue Weltsicht den Menschen aus
dem Zentrum des Alls, die Erde wurde zu einem Plane-
ten neben anderen. Dessen Kugelform stellte die klassi-
sche Trigonometrie der Fläche vor neue Aufgaben. Der         Beulen und Dellen auf der Ellipse:
holländische Astronom und Mathematiker Willebrord            die „Potsdamer Kartoffel“
van Roijen Snell, genannt Snellius, löste 1616 das Prob-
lem der Triangulation auf Kugeloberflächen und legte         Machen wir ein Experiment: Wir stellen Wind und Wet-
damit die mathematische Grundlage der wissenschaft-          ter ab und beseitigen den Mond und die Sonne. Auch die
lichen Geodäsie. Schließlich konnten Newton und Huy-         Kontinente denken wir uns weg. Auf einer solchen was-
gens 1687 bzw. 1690 zeigen, dass die Erde aufgrund ihrer     serbedeckten Erde gäbe es also keine Wellen und auch
Eigenrotation eine Ellipsoidform hat. Aber erst heute        keine Gezeiten. Dann sollte der Meeresspiegel eigentlich
besitzen wir mit Satelliten ein Werkzeug, das uns erlaubt,   ebenmäßig flach sein. Tatsächlich aber weist eine solche
diese Gestalt der Erde bis ins Detail zu untersuchen.        Erde Täler und Berge auf der Wasseroberfläche auf.
                                                             Diese entstehen aufgrund von Massenunterschieden,
                                                             genauer gesagt von Dichteunterschieden im Erdkörper.
                                                             Angetrieben durch die enorme Hitze im Erdkern und
Gewicht auf einer rotierenden                                den radioaktiven Zerfall von Elementen im Erdmantel
Ellipse                                                      bewegt sich im Mantel zähflüssiges Gestein: Heißes
                                                             Magma, also Material geringer Dichte steigt nach oben,
                                                             während kälteres und dadurch dichteres Material an
Für das menschliche Auge ist die Erde ein perfekt runder     anderer Stelle nach unten absinkt. Dieser wärmebe-
Körper. Aber wie rund ist sie wirklich? Stellen wir uns      dingte Gesteinstransport führt zu einer ungleichmäßi-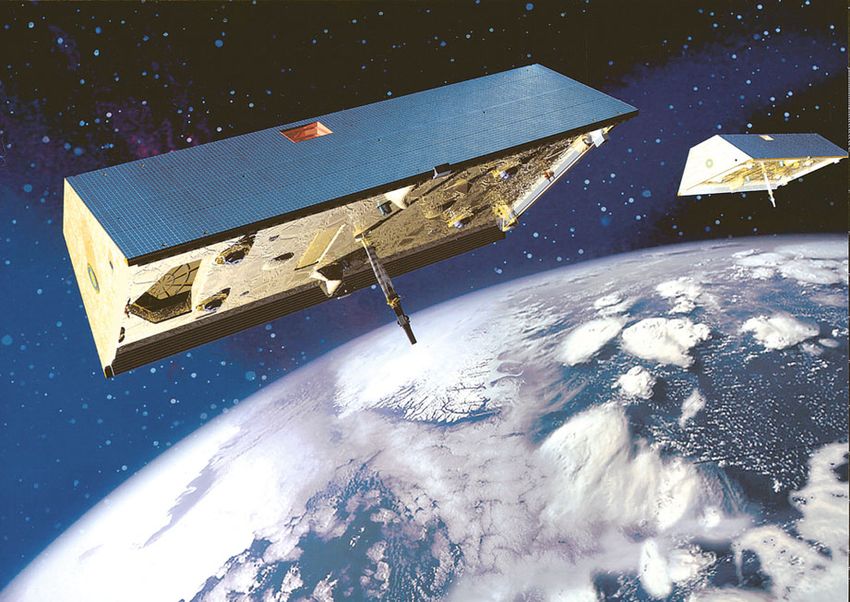
02 The View into System Earth from Space               19

        hotography of the Earth from a satellite or a space    expansion at the equator. This polar flattening of the

P       station on a low-Earth orbit seems completely
        normal to us nowadays. But when the first pho-
tographs of our planet were taken in the 1960s, it caused
                                                               Earth postulated by Newton and Huygens really exists:
                                                               the average diameter of the Earth is 12 740 kilometres,
                                                               but the north-south axis is around forty-two kilometres
a sensation because we, the inhabitants of Earth, were         shorter than the east-west axis at the equator. As a first
able to view this solitaire in space for the first time from   approximation, the Earth is therefore a rotational ellip-
a greater distance. Photographs of the Earth are still         soid.
extremely fascinating and have a particular aesthetic              But that’s not all. Newton’s law of gravity states
appeal. However, observation of the Earth from space is        that the force with which a falling apple is accelerated
not primarily intended for contemplative examination.          towards the centre of mass directly depends on the size of
Modern satellites are a universal research tool and have       the mass and the distance from the centre of mass.
become indispensable to the geosciences. They not only         Applied to our planet, this means that gravitational
give us a view of the Earth, but also permit an insight        acceleration is variable. On the surface of the rotational
into System Earth.                                             ellipsoid, mass attraction causes a gravitational accelera-
    Humans have an inherent desire to research their           tion towards the centre of 9.81 m/s2, which increases to
immediate and wider environment. The idea of the               9.83 m/s2 at the poles. If we addionally take into account
Earth as a flat disc was sufficient for early human soci-      the centrifugal acceleration of –0.03 m/s2 at the equator,
eties to orient themselves within their environment.           which acts in the opposite direction to the Earth’s attrac-
Nevertheless, this concept was quickly corrected with          tion, the gravitational acceleration (or simply “gravity”)
astronomical observations, even though the geocentric          at the equator is 9.78 m/s2. At the poles, gravitation and
point of view initially remained unquestioned. Humans          normal gravity have the same value. Accordingly, weigh-
have been aware of the sphericity of the Earth since           ing scales at the poles show a person of average weight
Pythagoras (*540 BC), at the latest. Eratosthenes (*276        is around 350 g heavier than at the equator, i.e. gravity on
BC) calculated that this sphere had a circumference of         the ellipsoidal surface changes with geographic latitude.
252 000 stades, the equivalent of around 40 000 km.
With the beginning of modern natural sciences in the
seventeenth century, our understanding of the Earth
changed radically. Prepared by Kepler and completed by         Bumps and dents on the ellipse:
Galileo, the new view of the world pushed humankind            the “Potsdam Potato”
out of the centre of the universe, and the Earth became
just one planet among others. Its spherical shape pre-         Let’s do an experiment: we turn off the wind and
sented new tasks for classical trigonometry. In 1616, the      weather and remove the moon and sun. Then we imag-
Dutch astronomer and mathematician Willebrord van              ine the continents aren’t there either. On such a water-
Roijen Snell solved the problem of triangulation on            covered Earth there would be no waves and no tides, so
spherical surfaces. Snellius, as he was also called, there-    the sea level should be uniformly flat. But in reality, the
fore laid the mathematical foundation of scientific            surface of the water on such an Earth would still have
geodesy. Newton and Huygens, in 1687 and 1690 respec-          valleys and mountains. These are caused by differences
tively, were able to show that the Earth has an ellipsoid      in mass or, to be more precise, by differences in densities
shape due to its autorotation. But only today, with satel-     inside the Earth. Driven by the enormous heat in the
lites, we have a tool that allows us to examine this shape     core and the radioactive decay of elements in the man-
of the Earth in detail.                                        tle, viscous rock is flowing within the mantle. Hot
                                                               magma (low-density material) rises while colder, and
                                                               therefore denser, material sinks elsewhere. This heat-
Weight on a rotating ellipse                                   induced rock transport leads to an uneven mass distri-
                                                               bution within the Earth which, according to Newton,
                                                               results in a varying gravitational force. This is com-
To the human eye, the Earth is a perfectly round body.         pounded by the layered structure of the Earth. At the
But how round is it really? Let us imagine that the inte-      transition zones between the layers, from the centre to
rior of the Earth has a completely homogeneous struc-          the outer core and the mantle through to the crust, there
ture. Due to the Earth’s rotation, a centrifugal force pulls   are irregularly distributed density changes and varying
the Earth’s mass away from its rotational axis. This effect    density distribution within the layers. This means that
is greatest at the equator and least at the poles, which       the Earth’s force of attraction is not the same every-
leads to slight deformation of the spherical shape and         where; it varies with space and time.
20       02 Der Blick aus dem All in das System Erde

gen Massenverteilung im Erdkörper, die nach Newton                phischen Höhen – als Normal Null oder mittlerer Mee-
zu unterschiedlicher Anziehungskraft führt. Hinzu                 resspiegel bekannt. Die Abweichungen zum Ellipsoid
kommt der Schalenaufbau der Erde: An den Übergangs-               werden als Geoid-Undulationen bezeichnet. Das Geoid
zonen zwischen den Schalen vom Zentrum über den                   weist Beulen und Dellen mit Abweichungen von bis zu
äußeren Erdkern und den Erdmantel bis zur Erdkruste               hundert Meter nach oben und unten auf. Die unregel-
gibt es unregelmäßig verteilte Dichtesprünge und inner-           mäßige Form ließ diese Geoid-Darstellung als „Potsda-
halb der Schalen einen variierenden Dichteverlauf. Dar-           mer Schwerekartoffel“ (Potsdam gravity potato, 䉴 Abb.
aus folgt: Die Erdanziehungskraft ist nicht überall               2.2) weltbekannt werden.
gleich, sie variiert räumlich und zeitlich.                          Wie bei jeder Äquipotenzialfläche steht die Lotrich-
   Die Massenungleichheiten erzeugen folglich Abwei-              tung überall exakt senkrecht auf dem Geoid (䉴 Abb.
chungen von der Idealfigur des Rotationsellipsoids. Es            2.3), und trotz der Beulen und Dellen und der unter-
ergibt sich eine Fläche, auf der die Kräfte überall im            schiedlichen Schwere auf der Geoidoberfläche fließt hier
Gleichgewicht sind, eine sogenannte Äquipotenzialflä-             kein Wasser. Auch die Schwerewerte an der Erdober-
che. Der resultierende Körper wird als Geoid bezeichnet,          fläche variieren um die Normalwerte des Rotationsellip-
seine Oberfläche ist – als Bezugsfläche für alle topogra-         soids. Diese Ausschläge, die man als Schwereanomalien

2.2 Die „Potsdamer Kartoffel“: Der Planet Erde als Geoid (hinten) – die Abweichung der Äquipotenzialfläche des Erdschwerefel-
des gegenüber dem Rotationsellipsoid in stark überhöhter Darstellung. Südlich von Indien findet sich ein 109 Meter tiefes Tal,
nördlich von Papua-Neuguinea ein 95 Meter hoher Berg auf der Meeresoberfläche. „Normalnull“ weist also rund 200 Meter Diffe-
renz vom gemeinsamen Massenmittelpunkt auf. Die Anomalien des Schwerefeldes der Erde (vorn) sind Abweichungen von der
Normalschwere auf dem Rotationsellipsoid. Deutliche Gravitationsanomalien zeichnen sich unter anderem am Himalaja, aber
auch im östlichen Mittelmeer ab.
2.2 The “Potsdam Potato”, planet Earth as a geoid (rear) – a highly exaggerated representation of the deviation of the equi-
potential surface of the Earth’s gravity field compared to the rotational ellipsoid. To the south of India there is a valley
109 metres deep, to the north of Papua New Guinea there is a mountain 95 metres high on the surface of the sea. “Mean
sea level” thus differs by around 200 metres from the common centre of mass. The anomalies in the Earth’s gravity field (front)
are deviations from normal gravity on the rotational ellipsoid. There are clear gravitational anomalies in the Himalayas and in
the Eastern Mediterranean.
02 The View into System Earth from Space                 21

    These inequalities of mass produce deviations from           Satellites measure gravity
the idealised shape of a rotational ellipsoid. They lead to
a surface on which the forces are in equilibrium, a so-          It was Friedrich Robert Helmert who around 1880 for-
called equipotential surface. The resulting body is called       mulated the modern definition of geodesy by linking
a geoid; its surface is used as a reference surface for all      methods for measuring the Earth’s shape with those for
topographic elevations and is called the vertical refer-         analysing the terrestrial gravity field. This modern
ence datum or the global mean sea level. Deviations              approach of geodesy led to the Potsdam absolute value
from the ellipsoid are called geoid undulations. The             for the Earth’s force of attraction, which became the
geoid has dents and bumps on it, with deviations of up           worldwide reference value. Known as the “Potsdam
to one hundred metres, plus and minus, from the ide-             gravity value”, it retained this function from 1909 until
alised ellipsoid. Its irregular shape led to this geoid rep-     1971.
resentation becoming known worldwide as the “Pots-                   Today’s observation of the Earth’s gravity field with
dam gravity potato” (䉴 Fig. 2.2).                                the help of satellites is based on Helmert’s approach. If
    As with every equipotential surface, the local vertical      the Earth were a sphere with uniformly layered mass,
direction (local plumb line) is precisely perpendicular          satellites orbiting the Earth would fly along an elliptical
everywhere on the geoid (䉴 Fig. 2.3). Despite the dents          orbit. Deviations of the Earth’s surface from a perfect
and bumps and differing gravity on the geoid’s surface,          sphere and irregularities of the density distribution
water does not flow on it. The gravity values on the             inside the Earth alter the satellite’s orbit. The Earth’s
Earth’s surface also vary about the normal values on the         force of attraction acting on an orbiting satellite varies;
rotational ellipsoid. These deviations, called gravity           it is sometimes stronger, sometimes weaker and as a
anomalies, reach a maximum of 500 mgal, equal to 5 ×             result, the satellite flies higher or lower, faster or slower.
10–3m/s2, i. e. 500 millionths of normal gravity. Geoid          These perturbations of the satellite’s orbits can be mea-
undulations and gravity anomalies represent the irregu-          sured from ground stations or other satellites. Analysis
lar structure of the gravity field along the surface of the      of these observations allows conclusions to be drawn
Earth. How can we measure this?                                  regarding the underlying gravitational field. The accu-
                                                                 racy and resolution of a gravitational field derived exclu-
                                                                 sively from satellite orbital perturbations are limited by
                                                                 the distribution of the satellite’s orbits in near-Earth
                                                                 space, by the quality and frequency of the orbit observa-
                                                                 tions and, above all, by the altitude of the satellite. The
                                                                 higher a satellite flies, the less its orbit is disturbed by
                                                                 variations in the Earth’s gravitational field, but this is
                                                                 associated with an increasing loss of information. Geo-
                                                                 scientists want therefore the satellite flight path to be as
                                                                 low as possible; however, this reduces the mission life
                                                                 time because low-flying satellites are decelerated by fric-
                                                                 tion in the high atmosphere.
                                                                     Highly precise determination of the Earth’s force of
                                                                 attraction is a central issue in geosciences. It affects
                                                                 questions of basic research and also has practical appli-
                                                                 cations.

                                                                 CHAMP and GRACE
2.3 Different masses exert different forces of attraction. The
forces on the surface of the geoid adjust so that they always
                                                                 One of the most successful geoscience space missions
act perpendicular to the surface. In this way, mountains and     was CHAMP (CHAllenging Mini satellite Payload,
valleys result on the surface of the sea.                        䉴 Fig. 2.1). This satellite was used to measure the Earth’s
                                                                 gravity field, magnetic field, and atmospheric parame-
2.3 Unterschiedliche Massen üben unterschiedliche Anzie-
hungskraft aus. Auf der Geoid-Oberfläche stellen sich die        ters. CHAMP was a small geoscience satellite that was
Kräfte so ein, dass sie stets senkrecht zur Oberfläche wirken.   shot into a low-Earth orbit by a COSMOS rocket fired
So entstehen Berge und Täler auf der Meeresoberfläche.           from the Plesjezk Cosmodrome in Russia in June 2000.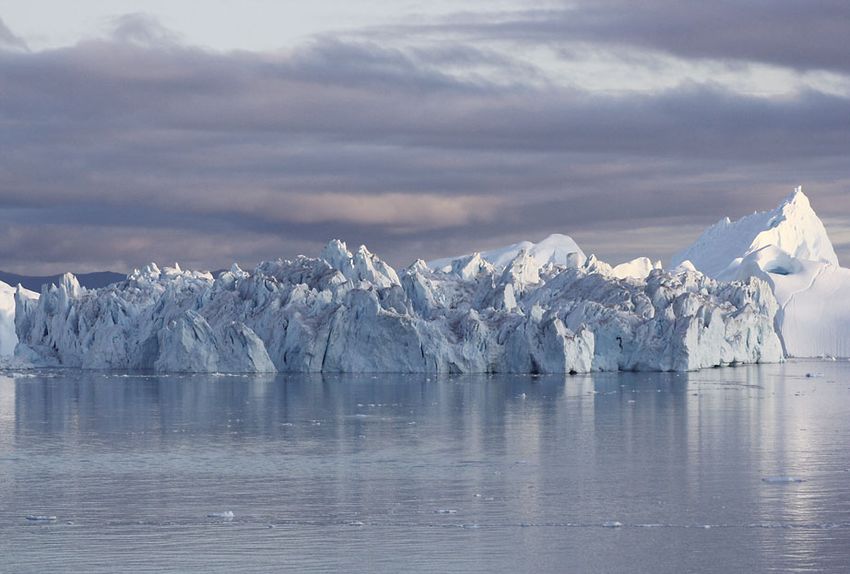
22      02 Der Blick aus dem All in das System Erde

bezeichnet, erreichen maximal 500 mGal, das sind             CHAMP und GRACE
5 × 10⁻³ m/s2, also 500 Millionstel der Normalschwere.
Geoid-Undulationen und Schwereanomalien repräsen-
tieren die unregelmäßige Struktur des Schwerefelds ent-      Eine der erfolgreichsten geowissenschaftlichen Raum-
lang der Erdoberfläche. Wie kann man das messen?             fahrtmissionen war CHAMP (CHAllenging Mini Satel-
                                                             lite Payload, 䉴 Abb. 2.1). Dieser Satellit diente zur Mes-
                                                             sung des Erdschwerefeldes, des Erdmagnetfelds und zur
                                                             Messung atmosphärischer Parameter. CHAMP war
Satelliten messen die Schwerkraft                            ein geowissenschaftlicher Kleinsatellit, der im Juni 2000
                                                             von dem russischen Kosmodrom Plesetsk mit einer
Es war Friedrich Robert Helmert, der gegen 1880 die          COSMOS-Rakete in eine niedrige Erdumlaufbahn mit
moderne Definition der Geodäsie formulierte, indem           einer Anfangsflughöhe von 452 Kilometern geschossen
er die Methoden zur Messung der Erdgestalt mit der           wurde. Die kreisförmige Bahn des Satelliten führte über
Analyse des irdischen Schwerefeldes verband. Dieser          die Pole. Die Erde dreht sich bei einer solchen Bahn
moderne Ansatz der Erdvermessung führte dazu, dass           unter dem Satelliten durch, sodass nach einer gewissen
der Potsdamer Absolutwert der Erdanziehungskraft als         Zahl von Überflügen die gesamte Erdoberfläche abge-
„Potsdamer Schwerewert“ zum weltweiten Referenzwert          deckt wird. Mit dem GPS-Empfänger an Bord von
wurde und diese Funktion von 1909 bis 1971 hatte.            CHAMP wurde die Bahn lückenlos vermessen. Das
    Die heutige Beobachtung des Erdschwerefeldes mit-        reichte aber noch nicht für die erwünschte Präzision der
hilfe von Satelliten gründet auf dem Helmertschen            Bahnbestimmung aus, denn die dünnen Reste der
Ansatz. Erdumkreisende Satelliten würden, wenn die           Atmosphäre in dieser Höhe, die Sonnenstrahlung und
Erde eine Kugel mit gleichmäßig geschichteter Masse          die von der Erde reflektierte Strahlung bremsen erdnahe
wäre, auf einer Ellipsenbahn fliegen. Die Abweichungen       Satelliten ab. Deshalb erfasste bei CHAMP, erstmals
der Erdoberfläche von der Kugelform und die Unregel-         bei einer solchen Satellitenmission, ein dreiachsiger
mäßigkeiten der Dichteverteilung im Erdinneren führen        Beschleunigungsmesser im Schwerpunkt des Satelliten
zu Veränderungen der Satellitenbahn: Ein Satellit wird       diese Störbeschleunigungen direkt.
auf seiner Umlaufbahn mal stärker, mal schwächer                 Der Erfolg von CHAMP führte dazu, dass 2002 eine
angezogen und fliegt folglich mal tiefer, mal höher, mal     weitere Schwerefeldmission auf den Weg gebracht
schneller, mal langsamer. Diese Bahnstörungen der            wurde. Das Satellitenpaar GRACE (Gravity Recovery
Satellitenumläufe können von Bodenstationen oder             And Climate Experiment, 䉴 Abb. 2.5) wurde mit einer
anderen Satelliten gemessen werden. Aus der Analyse          russischen ROCKOT-Rakete ebenfalls vom Startplatz
dieser Beobachtungen lässt sich auf das zugrunde lie-        Plesetsk aus gestartet. Die ganz ähnlich wie CHAMP
gende Schwerefeld schließen. Die Genauigkeit und die         konstruierten Satelliten wurden im Auftrag der NASA
Auflösung eines ausschließlich aus Satellitenbahnstö-        in Deutschland gebaut. Die beiden GRACE-Satelliten
rungen abgeleiteten Schwerefelds werden durch die Ver-       jagen in rund 500 Kilometern Flughöhe im Abstand von
teilung der Satellitenbahnen im erdnahen Weltraum,           etwa 220 Kilometern auf derselben Bahn hintereinander
durch die Qualität und Häufigkeit der Bahnbeobach-           her, weshalb die Wissenschaftler sie „Tom und Jerry“
tungen und vor allem durch die Flughöhe der Satelliten       getauft haben. Der durch das Erdschwerefeld leicht vari-
begrenzt. Je höher ein Satellit fliegt, desto weniger wird   ierende Abstand der beiden Satelliten wird auf den hun-
seine Bahn durch Variationen des Erdschwerefelds             dertsten Teil eines Millimeters genau vermessen. Damit
gestört, das heißt desto mehr Information geht verloren.     können wesentlich feinere Strukturen im Erdschwere-
Aus Sicht der Geowissenschaften ist also eine möglichst      feld als mit CHAMP erfasst werden. Erstmals lassen sich
niedrige Flugbahn erwünscht. Das geht allerdings auf         mit GRACE nun auch zeitliche Variationen der Erdan-
Kosten der Lebensdauer des Satelliten, denn niedrig flie-    ziehungskraft beobachten, die zum Beispiel durch die
gende Satelliten werden durch Reibung in der Hochat-         jahreszeitlichen Schwankungen der Wassermengen in
mosphäre abgebremst.                                         großen Flusssystemen oder Eismassenverluste in den
    Die hochpräzise Bestimmung der Erdanziehungs-            polaren Eisschilden hervorgerufen werden. Daraus las-
kraft ist eine zentrale Fragestellung der Geowissenschaf-    sen sich Rückschlüsse auf Massenumlagerungen im Sys-
ten. Sie berührt Fragen der Grundlagenforschung              tem Erde ziehen.
ebenso wie praktische Anwendungen.
02 The View into System Earth from Space               23

                                                                       The success of CHAMP led to the 2002 launch of a
                                                                   further mission to measure the gravitational field. A pair
                                                                   of satellites, known collectively as GRACE (Gravity
                                                                   Recovery And Climate Experiment, 䉴 Fig. 2.5), was sent
                                                                   into orbit by a Russian ROCKOT rocket, which had also
                                                                   been launched from Plesetsk. The satellites, which had a
                                                                   similar design to CHAMP, were built in Germany for
                                                                   NASA. The two GRACE satellites follow the same orbit
                                                                   at an altitude of around 500 km and around 220 kilome-
                                                                   tres apart. Scientists have nick-named them “Tom and
                                                                   Jerry” because one is always chasing the other. The dis-
                                                                   tance between the satellites, which varies slightly due to
                                                                   the Earth’s gravity field, is precisely measured to a hun-
                                                                   dredth of a millimetre. This enables registration of far
                                                                   finer structures in the Earth’s gravity field compared to
                                                                   CHAMP and, for the first time, GRACE allows the
                                                                   observation of temporal variations in the Earth’s force
                                                                   of attraction. These are caused by factors such as sea-
                                                                   sonal fluctuations in the quantities of water in large river
2.4 The GFZ-1 laser satellite was set out from the MIR space       systems or ice mass losses in the polar ice sheets. This in
station in 1995. It was placed in a very low orbit of only         turn enables conclusions to be drawn regarding mass
390 km altitude. For four years, the satellite orbited the Earth   redistributions inside System Earth.
every 90 minutes until it finally burned up in the atmosphere
in June 1999. This satellite had 60 reflectors built into its
spherical surface. Light pulses directed at the satellite from
terrestrial laser stations were reflected back towards the
ground station. The distance of the satellite could be pre-        Variations in the Earth’s gravity:
cisely determined from the travel time of the signals. This        a window into the Earth
information was used to calculate the satellite’s orbit.
2.4 Der 1995 gestartete Lasersatellit GFZ-1 wurde von der          The aforementioned high-precision measurements of
Raumstation MIR aus auf seine mit 390 km Höhe sehr nie-            the orbit of the two satellite missions, CHAMP and
drige Bahn gesetzt. Der Satellit umrundete vier Jahre lang alle    GRACE, have provided us with a much sharper image of
90 Minuten die Erde, um schließlich im Juni 1999 in der Erd-
                                                                   our planet. We can now take a look at the Earth’s gravity
atmosphäre zu verglühen. In seine kugelförmige Oberfläche
waren 60 Reflektoren eingelassen, die von Laserstationen auf       field and its variations in order to see what conclusions
der Erde ausgesandte Lichtimpulse in Richtung Bodenstation         we can deduce regarding the structure of the Earth.
zurücklenkten. Aus der Laufzeit der Signale ließ sich die Ent-         Gravity “field” means that global observations of the
fernung des Satelliten exakt bestimmen und zur Berechnung          Earth’s attraction using satellites, aircrafts, ships and
seines Orbits nutzen.                                              ground stations are combined. This is achieved with
                                                                   complex mathematical physics that produces various
                                                                   models of the worldwide gravity field. The Potsdam
                                                                   gravity-field model, named “EIGEN-5C”, has become
Its initial altitude was 452 kilometres. The satellite’s cir-      established worldwide as one of the standards. Integra-
cular orbit passed over the poles as the Earth rotated             tion of GRACE data led to a previously unattained accu-
beneath the satellite. After a certain number of flyovers,         racy on a global scale.
the whole surface of the Earth had been covered. The                   As discussed above, differences in the gravity field can
orbit was continuously measured using the GPS receiver             be expressed as deviations in the geoid surface from the
on board CHAMP. However, this did not provide the                  rotational ellipsoid and as deviations from normal grav-
precision required to determine the orbit because the              ity (䉴 Fig. 2.6). Viewed together, these observations pro-
thin residual atmosphere at this height, plus solar radia-         vide clues about the topographical and geophysical
tion and the radiation reflected by the Earth slow down            structures of the tectonic plates. Large blocks, such as
near-Earth satellites. This is why, for the first time on          the Andes, Himalayas and the North Atlantic Ridge, gen-
such a satellite mission, a triaxial accelerometer was             erate strong positive-gravity anomalies, whereas deep-
installed in the centre of gravity of the CHAMP satellite          sea trenches at the edge of the North-West Pacific and
to directly register such perturbation accelerations.              off the west coast of South America produce large nega-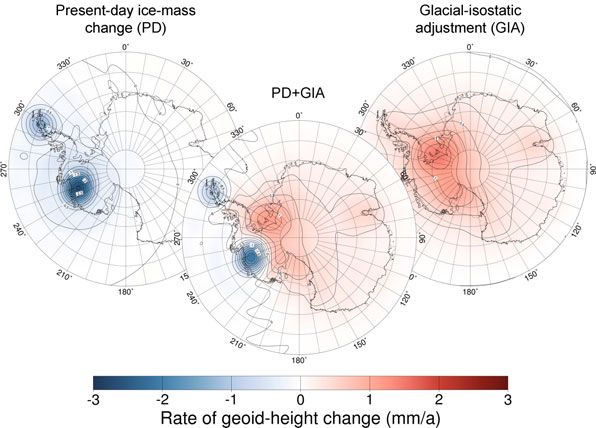
24       02 Der Blick aus dem All in das System Erde

2.5 Das 2002 gestartete Satellitentandem GRACE (Gravity Recovery And Climate Experiment). (Abb.: Astrium/GFZ)
2.5 The GRACE (Gravity Recovery And Climate Experiment) tandem satellite mission started in 2002. (Fig.: Astrium/GFZ)

Variationen in der Erdanziehung:                                    Unterschiede im Schwerefeld – so hatten wir festge-
                                                                stellt – lassen sich als Abweichungen der Geoidoberflä-
ein Fenster in die Erde
                                                                che vom Rotationsellipsoid und als Abweichungen von
                                                                der Normalschwere ausdrücken (䉴 Abb. 2.6). In der
Die erwähnte hohe Präzision der Flugbahnbestimmung              Zusammenschau geben diese Betrachtungen Hinweise
der beiden Satellitenmissionen CHAMP und GRACE                  auf die topographisch-geophysikalischen Strukturen der
hat unser Bild der Erde von Grund auf geschärft. Wir            Plattentektonik. Große Blöcke wie die Anden, der Hima-
wollen einen Blick auf das Schwerefeld der Erde und             laja und der nordatlantische Rücken erzeugen starke
seine Variationen werfen, um zu sehen, welche Aussagen          positive Schwereanomalien, die Tiefseegräben am Rand
zum Aufbau der Erde sich daraus ableiten lassen.                des Nordwestpazifiks und vor der Westküste Südameri-
   Schwere-„Feld“ bedeutet, dass globale Beobachtun-            kas dagegen große negative Schwereanomalien. Hawaii
gen der Erdanziehung durch Satelliten, Flugzeuge,               lässt sich heute als jüngstes Glied einer ganzen Kette von
Schiffe und Bodenstationen zusammengefasst werden.              teilweise unterseeischen Vulkankegeln in der Karte der
Dieses geschieht durch ausgefeilte mathematisch-physi-          Schwereanomalien identifizieren.
kalische Methoden, als deren Ergebnis verschiedene                  Großflächige Berge und Täler im Geoid und in der
Modellvorstellungen des weltweiten Erdschwerefeldes             Verteilung der Schwereanomalien hängen mit Struktu-
entstehen. Das Potsdamer Schwerefeldmodell mit dem              ren und Prozessen im tieferen Erdinneren zusammen.
Namen EIGEN-5C hat sich weltweit als einer der Stan-            So sind zum Beispiel die Aufwölbungen des Geoids im
dards etabliert. Die Integration von GRACE-Daten                Westpazifik und an der Westküste Südamerikas eine
führte hier zu einer bisher nicht erreichten Genauigkeit        Folge des dort stattfindenden Abtauchens alter und
im globalen Maßstab.                                            damit dichter ozeanischer Lithosphäre in den Erdman-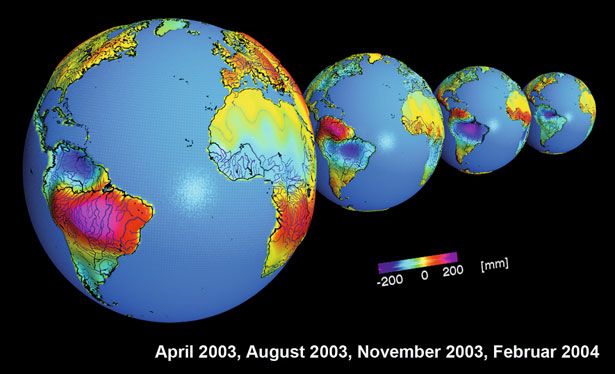
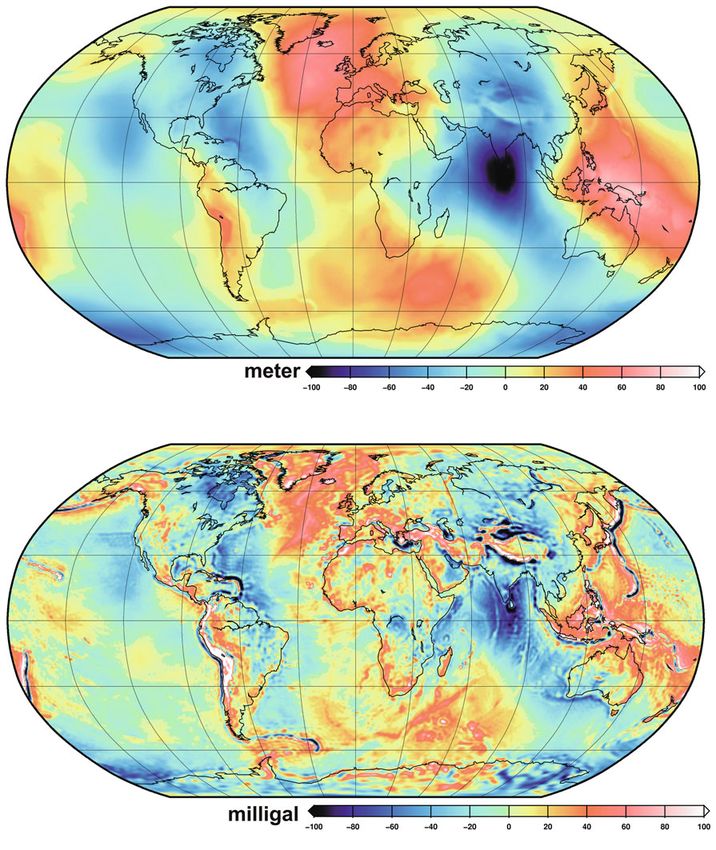
02 The View into System Earth from Space                    25

2.6 Two-dimensional representations of the current EIGEN-5C gravity-field model, at the top as geoid undulations (in metres)
and at the bottom as gravity anomalies (in mGal).
2.6 Zweidimensionale Darstellungen des aktuellen Schwerefeldmodells EIGEN-5C, oben als Geoid-Undulationen (Meter) und
unten als Schwereanomalien (mGal).
26       02 Der Blick aus dem All in das System Erde

2.7 Durch das Abschmelzen großer
Eismassen wird die Lithosphäre entlas-
tet und hebt sich. Das zähflüssige
Gestein des oberen Erdmantels fließt
nicht so schnell nach. Dadurch ent-
steht ein lokales Massendefizit.
2.7 Melting of large ice masses
relieves the load on the lithosphere and
it rises. The viscous rock of the upper
mantle does not flow as quickly. The
result is a local mass deficit.

tel. Andere Geoid- und Schwereanomaliehochs finden           Informationen über das Klima geben kann. Die beteilig-
sich in Gebieten, wo heißes Material, das vermutlich im      ten Forscherkollegen ergänzten daher Newtons Fest-
Erdmantel nach oben strebt, die darüber liegende Litho-      stellung „Mass is gravity“ mit „Gravity is climate“. Viele
sphäre aufwölbt, zum Beispiel im Nordatlantik um             Prozesse im Klimageschehen unseres Planeten sind was-
Island und südöstlich von Afrika. Das prägnante tiefe Tal    sergetrieben: Ozeanströmungen transportieren Wärme
im Geoid südlich von Indien könnte mit der nordwärts         in Richtung der Pole und Kälte in Richtung Äquator, die
gerichteten Bewegung der indischen Lithosphärenplatte        Ab- oder Zunahme der Eismassen sind wichtige Fakto-
zusammenhängen, die das Himalaja-Massiv aufschiebt,          ren im Klima, der globale hydrologische Kreislauf hängt
wobei sich auf der Rückseite dieser Bewegung die Masse       entscheidend vom Wasserhaushalt der Kontinente ab,
im Erdmantel ausdünnt.                                       hinzu kommen Schwankungen des mittleren Meeres-
    Eine weitere Senke im Geoid über Kanada ist ein          spiegels. Aber Wasser ist Masse, und Änderungen in der
Relikt der Vereisung vor etwa 20 000 Jahren. Der mäch-       Verteilung des globalen Wassers entsprechen daher
tige Eisschild hatte dort die Lithosphäre und den oberen     Umlagerungen von Massen im Schwerefeld der Erde.
Mantel nach unten gedrückt. Vor 6000 Jahren war dieses           Diese Prozesse lassen sich vom Satelliten aus beob-
Eis geschmolzen, die Erdkruste wurde von diesem riesi-       achten. Der knappe Wissenschaftler-Spruch „Schwer-
gen Gewicht entlastet und steigt seitdem immer noch          kraft ist Klima“ sagt genau das aus: Die Flugbahnände-
auf (䉴 Abb. 2.7). Das zähflüssige Material des Erdman-       rungen von Satelliten geben uns Auskunft über das
tels kann hier nicht so schnell nachfließen wie die Litho-   Klima, vorausgesetzt, man kann diese Flugbahnände-
sphäre aufsteigt; so entsteht hier ein Massendefizit.        rungen so genau bestimmen, wie es bei den GRACE-
    Dieses kanadische Massentief ist jedoch gleichzeitig     Satelliten der Fall ist.
Teil einer größeren Formation negativer Werte vom Ost-           Veränderungen des Klimas im System Erde sind von
pazifik über Nordamerika zum Westatlantik, die ver-          weitreichenden Wassermassen-Umverteilungen beglei-
mutlich mit der Mantelkonvektion zusammenhängt: Im           tet, wie beispielsweise Meeresspiegeländerungen, variie-
Erdmantel steigen nicht nur heiße Gesteine auf, sondern      renden Eis- und Schneebedeckungen und veränderten
sinken auch kühlere Gesteine ab. Über Kanada überla-         kontinentalen Süßwasservorkommen. Umgekehrt ist
gern sich die beiden geschilderten Effekte und sind im       die Wasserverteilung entscheidend für die vorherrschen-
Geoid gut zu erkennen.                                       den klimatischen Bedingungen und Lebensverhältnisse
                                                             auf der Erde. Die größten zeitlichen Änderungen des
                                                             Schwerefelds werden durch den Transport von Wasser-
                                                             massen auf den Landflächen verursacht. Der kontinen-
„Gravity is Climate“:                                        tale Wassergehalt ist letztlich eine Bilanz zwischen
Klimaforschung mit Satelliten                                Niederschlag, Verdunstung, Abfluss und Speicherung,
                                                             die jahreszeitabhängig ist.
                                                                 Mit GRACE konnten erstmals vom Satelliten aus Ver-
Der Name der GRACE-Satellitenmission deutet an, dass         änderungen in der globalen kontinentalen Wasserspei-
die hochpräzise Vermessung der Erdanziehung auch             cherung gemessen werden, eine zentrale Größe für das
02 The View into System Earth from Space 27
tive-gravity anomalies. In today’s gravity anomaly maps, tuations in the mean sea level. However, water is mass,
we are able to identify Hawaii as the youngest link in a and therefore changes in the global water distribution
whole chain of partly undersea volcano cones. correspond to redistribution of masses within the
Extensive mountains and valleys in the geoid and the Earth’s gravity field.
distribution of gravity anomalies are related to struc- These processes can be observed from a satellite. The
tures and processes deep inside the Earth. For example, slogan “Gravity is Climate” implies precisely that:
the geoid domes in the Western Pacific and on the west changes in satellite orbits provide us with information
coast of South America are a consequence of the older, about the climate, provided we can determine these
and therefore denser, oceanic lithosphere descending orbit changes precisely, and this is indeed the case with
into the mantle at these locations. Other high spots on the GRACE satellite.
the geoid and in the gravity anomaly maps are found in Climate changes in System Earth are accompanied by
areas where hot material, which is probably rising within far-reaching redistributions of water masses. Examples
the mantle, is pushing up the lithosphere above it. This of this include changes in sea level, varying ice and snow
occurs in the North Atlantic, around Iceland and south- covers, and altered continental freshwater resources.
east of Africa. The striking deep valley in the geoid to the Conversely, the water distribution is decisive for the pre-
south of India could be related to the northward move- vailing climatic and living conditions on Earth. The
ment of the Indian lithosphere plate. This pushes up the largest changes in the gravity field over time are due to
Himalayan Massif, thus thinning the mantle mass to the the transport of water masses on land areas. The conti-
rear of this movement. nental water content is ultimately a balance between
A further depression in the geoid above Canada is a precipitation, evaporation, runoff and storage, which all
relict of glaciation around 20 000 years ago, when a thick depend on the time of year.
ice sheet pushed down the lithosphere and upper man- GRACE provided the first measurements of changes
tle there. This ice melted 6000 years ago, relieving the in global continental water storage, a central variable
enormous weight on the crust, which has continuously for the climate (䉴 Fig. 2.8). The GRACE data offer
risen since then (䉴 Fig. 2.7). The viscous material of the more comprehensive information on storage changes in
mantle cannot flow as fast as the lithosphere rises, so a groundwater, in the ground, in snow cover, rivers, lakes
mass deficit occurs here. and flood plains, than any other ground or satellite-
In addition, this Canadian mass deficit is also part of assisted observation system. Analyses of the GRACE
a larger group of negative values from the Eastern data show how variability in climatic conditions, for
Pacific, across North America to the Western Atlantic. example, precipitation and air temperature, affect
These are probably related to mantel convection, which worldwide seasonal and annual variations in water stor-
is caused by hot rocks rising within the mantle while the age within large river catchment areas (䉴 Fig. 2.9). If
cooler rocks sink. These two effects overlap beneath other observational data is taken into account, it is also
Canada and are clearly identifiable in the geoid. possible to register the extensive dynamics of water
transport, for example, flooding dynamics in bodies of
surface water. It also allows checking and adjustment of
extensive hydrological models, which will be used to
“Gravity is Climate”: climate determine climate-induced changes in global and
research using satellites regional water cycles.
The name of the GRACE satellite mission indicates that Marine topography
highly precise measurement of the gravity field can also
provide information about the climate. Research col-
leagues involved in the project therefore supplemented As we saw, the geoid surface – the “theoretical” mean sea
Newton’s statement “Mass is Gravity” with the statement level – is not affected by ocean tides or by ocean circula-
“Gravity is Climate”. Many processes in the climate tion. Instead, it solely depends on the mass distribution
behaviour of our planet are water-driven: Ocean cur- inside and on the surface of the Earth.
rents transport heat towards the poles and cold towards However, there are indeed large currents within the
the equator. The decrease and increase in ice masses are oceans. These are mainly driven by winds, by the ex-
important factors that affect the climate, and the global change of heat and freshwater with the atmosphere as a
hydrological cycle decisively depends on the water bal- result of evaporation and precipitation and by the flow
ance of the continents. In addition to this there are fluc- of water from the continents. In addition, depending on28 02 Der Blick aus dem All in das System Erde
2.8 Änderung der kontinentalen Was-
serspeicherung von April 2003 bis zum
Februar 2004, in mm Wassersäule.
Deutlich erkennbar sind die saisonalen
Regenzeiten in den tropischen Breiten.
2.8 Changes in continental water stor-
age from April 2003 to February 2004,
in mm water column. Seasonal rains in
the tropical latitudes are clearly identi-
fiable.
Klima (䉴 Abb. 2.8). So umfassend wie bei keinem ande- ursachen die großen ozeanischen Strömungssysteme
ren boden- oder satellitengestützten Beobachtungssys- Berge und Täler in der Meeresspiegelhöhe, analog zu
tem bilden GRACE-Daten die Speicheränderungen im den atmosphärischen Hoch- und Tiefdruckgebieten.
Grundwasser, im Boden, in der Schneebedeckung und Die großen Meeresströme bewirken Auslenkungen des
in Flüssen, Seen und Überflutungsgebieten ab. Die Meeresspiegels um bis zu zwei Meter vom mittleren
Analysen von GRACE-Daten zeigen, wie sich die Varia- Meeresspiegel (䉴 Abb. 2.10). Diese Abweichungen wer-
bilität der klimatischen Bedingungen, zum Beispiel von den Meerestopographie genannt und lassen sich aus der
Niederschlag und Lufttemperatur, auf saisonale und Kombination von Messungen des Meeresspiegels und
jährliche Variationen der Wasserspeicherung in großen des Erdschwerefeldes bestimmen. Die präzise Kenntnis
Flusseinzugsgebieten weltweit auswirkt (䉴 Abb. 2.9). der Meerestopographie erlaubt Rückschlüsse auf die
Berücksichtigt man weitere Beobachtungsdaten, so lässt Ozeanzirkulation und ihre Änderungen. Meeresströ-
sich zudem die großräumige Dynamik von Wassertrans- mungen sind wichtige Akteure im Klimageschehen,
port erfassen, zum Beispiel die Überflutungsdynamik in denn sie transportieren gigantische Mengen von Wärme
Oberflächengewässern. Außerdem können großräumige und CO2.
hydrologische Modelle überprüft und angepasst werden, Die mit GRACE erreichbare räumliche Auflösung der
mit denen klimabedingte Änderungen des globalen und Erdoberfläche beträgt ungefähr 150 km. Eine Verdoppe-
regionalen Wasserkreislaufs bestimmt werden sollen. lung der Messgenauigkeit des Schwerefeldes über den
Ozeanen und der Meerestopographie wird der im März
2009 gestartete Satellit GOCE (Gravity Field and Steady-
Die Meerestopographie State Ocean Circulation Explorer) bringen. Um die not-
wendige hohe Präzision der Messdaten zu erreichen,
fliegt GOCE auf einer für Satelliten extrem niedrigen
Wir hatten gesehen: Die Geoid-Oberfläche, der „theore- Umlaufbahn von etwa 250 Kilometern. Aus der Kombi-
tische“ mittlere Meeresspiegel, wird weder durch die nation von GOCE-Messungen mit Daten der von ande-
Ozeangezeiten noch durch die Ozeanzirkulation beein- ren Satelliten gemessenen Meeresspiegelhöhe wird es
flusst, sondern ist allein von der Massenverteilung im möglich sein, die Meerestopographie des gesamten Glo-
Erdinneren und auf der Erdoberfläche abhängig. bus mit einer bisher unerreicht hohen räumlichen Auf-
Tatsächlich aber bewegen sich in den Ozeanen große lösung zu vermessen.
Strömungen. Angetrieben werden sie vor allem durch
Winde, durch den Wärme- und Süßwasseraustausch
mit der Atmosphäre infolge von Verdunstung und
Niederschlag und durch den Wasserabfluss von den Die Überwachung des Meeresspiegels
Kontinenten. Hinzu kommt: Je nach Temperatur und
Salzgehalt hat Ozeanwasser unterschiedliche Dichten, Bevor Satelliten ins All gebracht werden konnten, waren
die zum Ausgleich streben. Infolge der Erdrotation ver- Pegelstationen an den Küsten die einzige Möglichkeit,02 The View into System Earth from Space 29
2.9 Changes in global continental water
storage from spring to summer 2003 in
mm water column. The largest seasonal
fluctuations take place in the large tropi-
cal river catchment areas (Amazon in
South America, the Congo and Niger in
Africa, the Ganges and Brahmaputra in
India) and in the river catchment areas
of Siberia (Ob, Lena, Yenisei).
2.9 Änderung der globalen kontinenta-
len Wasserspeicherung vom Frühjahr
zum Sommer 2003 in mm Wasser-
säule. Die größten saisonalen Schwan-
kungen finden in den großen tropi-
schen Flusseinzugsgebieten (Amazonas
in Südamerika, Kongo und Niger in
Afrika, Ganges und Brahmaputra in
Indien) und in den Flusseinzugsgebie-
ten Sibiriens (Ob, Lena, Yenisei) statt.
the temperature and salt content, ocean water has differ- to measure water levels. This is associated with inherent
ent densities that try to balance out. As a result of the uncertainties because land masses are not static, but are
Earth’s rotation, the large oceanic flow systems cause involved in tectonic action. Sea levels rise or sink not
mountains and valleys in the sea level height, analogous only due to global variations of the sea level, but also for
to atmospheric high- and low-pressure areas. These example due to land areas rising as a result of melting ice
large ocean currents cause deviations in the sea level by masses at the end of the last ice age. Alternatively, they
up to two metres from the mean sea level (䉴 Fig. 2.10). can be shifted horizontally and vertically by earth-
The resulting marine topography can be determined by quakes. It is only since satellite measurements have been
combining measurements of the sea level and the Earth’s available that we have had a reliable external scale for
gravity field. Precise knowledge of the marine topogra- measuring the sea level. On the one hand, GPS measure-
phy allows conclusions to be drawn about ocean circu- ments can be used to determine the height changes of
lation and its changes. Ocean currents have a major the gauging stations themselves. On the other hand,
impact on climate behaviour because they transport satellites use radar to scan the surface of the sea. They are
gigantic quantities of heat and CO2. able to determine the precise distance of the satellite
The spatial resolution of the Earth’s surface achiev- from the sea’s surface, and therefore the water level, and
able with GRACE is roughly 150 km. The GOCE (Grav- are completely independent of the gauging stations.
ity Field and Steady-State Ocean Circulation Explorer) The measured data from these radar satellites show
satellite, launched in March 2009, will double the accu- regional differences in sea level changes. For example,
racy of gravity field measurements above the oceans and during the past fifteen years, the sea level in the Central
the marine topography. To obtain measured data with Pacific rose while in the Eastern Pacific it fell (䉴 Fig.
the required high precision, GOCE is orbiting at an alti- 2.11). The main causes of this are changes in the sea’s
tude of only around 250 kilometres, which is extremely density and in ocean circulation. Whether these are
low for a satellite. By combining GOCE measurements recurring climate cycles in the ocean or long-term
with sea level data measured by other satellites, it will be trends will not be known until measurements have been
possible to survey the topography of the sea for the performed over the coming decades. On average, we are
whole globe with previously unachieved high spatial res- already observing a global rise of around three millime-
olution. tres per year. The rise not only results from thermal
expansion of the sea due to global warming, but is also
the consequence of changes in the global water balance,
for example, due to melting of glaciers and ice sheets.
Monitoring the sea level Melting of the glaciers of Greenland and the Antarc-
tic are frequently named in this context. Indeed, long-
Before we were able to send satellites into space, gauging term trends in the GRACE measurements show clear
stations along the coasts were the only means available reductions in mass over the polar areas, which are30 02 Der Blick aus dem All in das System Erde
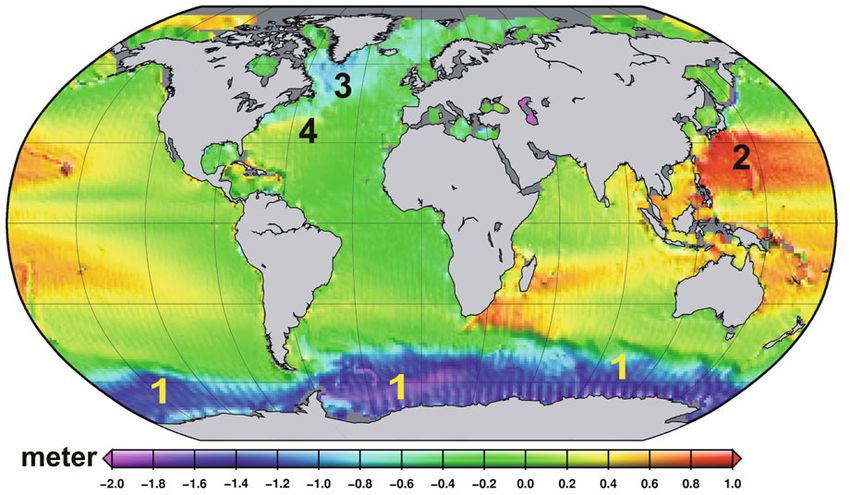
2.10 Die Meerestopographie, hier als Differenz zwischen dem GRACE-Geoid und der geometrischen Meereshöhe. Deutlich
erkennbar zeichnen sich Zirkumpolarstrom (1), Kuroshio-Strom (2), Nordatlantikstrom (3) und Golfstrom (4) ab.
2.10 The marine topography shown as the difference between the GRACE geoid and the geometric sea level. The Circumpolar
Stream (1), Kuroshio Stream (2), North Atlantic Stream (3) and Gulf Stream (4) stand out quite clearly.
den Wasserstand zu messen. Das musste zwangsläufig Dichte des Meeres und in der Ozeanzirkulation. Ob es
Unsicherheiten in sich bergen, denn es ändert sich nicht sich dabei um wiederkehrende Klimazyklen im Ozean
nur der Meeresspiegel, auch die Landmassen sind nicht oder um langfristige Trends handelt, werden erst Mes-
statisch, sondern eingebunden in das tektonische Ge- sungen über die nächsten Jahrzehnte zeigen können. Im
schehen. Küstenpegel heben oder senken sich, zum Bei- Mittel beobachten wir heute einen globalen Anstieg um
spiel durch das Aufsteigen der Landflächen infolge des etwa drei Millimeter pro Jahr. Der Anstieg resultiert
Abtauens der Eismassen am Ende der letzten Eisphase, nicht nur aus der thermischen Ausdehnung des Meeres
oder werden durch Erdbeben horizontal und vertikal aufgrund gestiegener globaler Temperaturen, sondern
verschoben. Erst seitdem Satellitenmessungen zur Ver- ist auch die Folge von Änderungen im globalen Wasser-
fügung stehen, haben wir einen verlässlichen externen haushalt, etwa durch Abschmelzen von Gletschern und
Maßstab zur Messung des Meeresspiegels. Zum einen Eisschilden.
können mithilfe von GPS-Messungen die Höhenände- In diesem Zusammenhang wird häufig das Ab-
rungen der Pegelstation selbst bestimmt werden. Zum schmelzen der Gletscher Grönlands und der Antarktis
anderen tasten Satelliten mithilfe von Radar die Meeres- genannt. Tatsächlich zeigen langzeitliche Trends in den
oberfläche ab und können damit den Abstand des Satel- GRACE-Messungen deutliche Massenabnahmen über
liten von der Meeresoberfläche und somit den Wasser- den Polargebieten, die im Zusammenhang mit dem
stand unabhängig von Pegeln präzise bestimmen. Rückgang kontinentaler Eismassen stehen. Verursacht
Die Messungen dieser Radarsatelliten zeigen regional werden diese Trends durch ein Ungleichgewicht in der
unterschiedliche Meeresspiegeländerungen. So stieg bei- Massenbilanz des Eises. Das Eis-Wachstum durch
spielsweise in den letzten 15 Jahren der Meeresspiegel im Schneefall kann den beschleunigten Abtransport des
Zentralpazifik, während er im Ostpazifik sank (䉴 Abb. Eises, etwa durch eine Zunahme des Schmelzwasserab-
2.11). Ursache hierfür sind vor allem Änderungen in der flusses oder eine Verringerung des Niederschlags, nicht02 The View into System Earth from Space 31
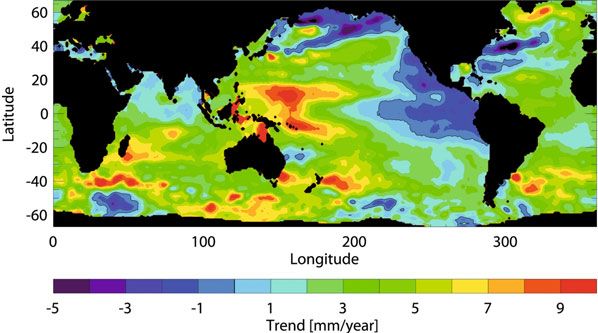
2.11 Sea level changes from 1993 to
2010 on the basis of radar altimeter
measurements of the JASON-1 and
TOPEX satellites. Sea level rises and
falls can be seen. The global average
gives a mean sea level rise of around
three millimetres per year.
2.11 Meeresspiegeländerungen von
1993 bis 2010 auf Basis der Radar-
Höhenmessungen der Satelliten
JASON-1 und TOPEX. Es zeigen sich
Meeresspiegelanstiege und -abstiege.
Im globalen Mittel ergibt sich ein mitt-
lerer Meeresspiegelanstieg von etwa
drei Millimetern pro Jahr.
related to the receding continental ice masses. These
trends are caused by inconsistencies in the mass balance
GPS for measuring tectonics
of the ice. Ice growth through snowfall is unable to com-
pensate the accelerated removal of the ice, for instance As we have already seen, measurements of the Earth’s
due to an increase in meltwater flow, or a reduction in gravity field can provide astonishing information on the
precipitation. The mass balance produced by GRACE structure and movement processes within System Earth.
can be used to quantify the contributions of the Green- There are a number of other satellite-based methods for
land and Antarctic ice sheets to the global change in sea observing the Earth. The most well-known is without
levels. Accordingly, in the period between 2002 and doubt the satellite navigation system GPS (Global Posi-
2009, Greenland contributed around 0.5 mm per year, tioning System), which was originally developed for mil-
and the Antarctic Peninsular and the Western Antarctic itary purposes, but now provides also decisive advances
contributed a further 0.3 mm per year, to the global sea for the study of the plate tectonics. Indeed, legend has it
level change of around 3 mm per year that has occurred that it was geodesists who were able to overcome the
between 1993 and 2007. In addition, thanks to the con- military caused constraint in the GPS accuracy by using
tinuous time series, the GRACE data confirmed acceler- classical methods of geodesy and dexterously combining
ated ice shrinkage – an observation which is primarily of the measurements of different GPS antennas on ground.
interest for our understanding of ice dynamics under Thus, the accuracy of the calculated positions of these
the prevailing climate conditions. antennas could be enhanced considerably. Today this
As noted above, when the overlying ice load is method, now known as Differential GPS, is the basis for
reduced, rock material flows in the upper mantle and the the use of the GPS-system in the field of modern
land rises. In the measured gravity field of the Earth, this geodesy.
so-called glacial-isostatic adjustment (also known as Here, the original task of GPS has been completely
post-glacial rebound) is superimposed on the ice-in- reversed: the system was originally intended to deter-
duced change in the Earth’s gravity field. Using compli- mine the position and the velocity of missiles at high
cated simulations with mathematical models and recon- speeds. In contrast, the geosciences study the movement
struction of ice sheet changes over the past 120 000 of the continents and this involves very slow speeds,
years, scientists are attempting to track this interplay namely several millimetres or centimetres per year. This
(䉴 Fig. 2.13). This clearly shows that additional infor- is roughly the speed at which finger nails or hair grow.
mation about the condition of the climate system in the Measuring such slow movements on a global scale by
past is necessary to be able to interpret present day GPS requires far more effort.
observation data. GPS is based on the measurement of a distance,
which itself is derived from highly precise measurement
of time. The travel time of a signal between a satellite
and a receiver, multiplied by the speed of light equals the
distance. If the clocks aboard the GPS-satellite or at the32 02 Der Blick aus dem All in das System Erde 2.12 Eisberge am Ilulissat-Eisfjord an der Westküste Grönlands (August 2009). 2.12 Icebergs at the Ilulissat Icefjord on the west coast of Greenland (August 2009). ausgleichen. So lassen sich über die von GRACE erstellte rend der letzten 120 000 Jahre versucht man diesem Massenbilanz die Beiträge der grönländischen und Wechselspiel auf die Spur zu kommen (䉴 Abb. 2.13). antarktischen Eisschilde sowie der Gletschergebiete in Dies verdeutlicht, dass für die Interpretation heutiger Alaska und Patagonien zur globalen Meeresspiegelände- Beobachtungsdaten zusätzliche Informationen über den rung quantifizieren: Grönland trug demnach im Zeit- Zustand des Klimasystems in der Vergangenheit nötig raum 2002 bis 2009 etwa 0,5 mm pro Jahr, die antarkti- sind. sche Halbinsel und die West-Antarktis weitere 0,3 mm pro Jahr zur globalen Meeresspiegeländerung von et- wa 3 mm pro Jahr zwischen 1993 und 2007 bei. Außer- GPS zur Messung der Tektonik dem konnte für einige Regionen Grönlands dank der kontinuierlichen Zeitreihe der GRACE-Daten ein be- schleunigter Eisrückgang belegt werden – eine Beobach- Wie wir gesehen haben, können Messungen des Erd- tung, die vor allem für das Verständnis der Eisdynamik schwerefeldes erstaunliche Aussagen zum Aufbau und unter den vorherrschenden Klimabedingungen von In- zu Bewegungsprozessen im System Erde liefern. Aber es teresse ist. gibt auch noch andere satellitengestützte Verfahren zur Wie oben angemerkt wurde, setzt bei verminderter Erdbeobachtung. Das bekannteste ist ohne Zweifel das Eis-Auflast ein Nachfließen von Gesteinsmaterial im Satellitennavigationssystem GPS (Global Positioning oberen Erdmantel ein. Im gemessenen Erdschwerefeld System). Die Anwendung des ursprünglich militäri- überlagert sich diese sogenannte glazial-isostatische schen Navigationsverfahrens brachte in der Untersu- Anpassung mit der eisbedingten Veränderung des Erd- chung der Plattentektonik entscheidende Fortschritte. schwerefeldes. Mit komplizierten Modellrechnungen In der Tat gibt es die Legende, dass es zuerst Geodäten und der Rekonstruktion der Eisschildentwicklung wäh- waren, die mit klassischen Methoden der Erdver-
Sie können auch lesen