Internationale Aktienmärkte mit Fokus Wiener Börse - Ausblick 2020 Fritz Mostböck, CEFA - Erste Group

 
WEITER LESEN
Internationale Aktienmärkte mit Fokus Wiener Börse - Ausblick 2020 Fritz Mostböck, CEFA - Erste Group
Ausblick 2020
Internationale Aktienmärkte
mit Fokus Wiener Börse

Fritz Mostböck, CEFA
Head of Group Research

Christoph Schultes, CIIA
Chief Equity Analyst CEE

Wien, Dezember 2019
Internationale Aktienmärkte mit Fokus Wiener Börse - Ausblick 2020 Fritz Mostböck, CEFA - Erste Group
Globales Umfeld
Wachstum, Sentiment & Zinsen

                               2
Internationale Aktienmärkte mit Fokus Wiener Börse - Ausblick 2020 Fritz Mostböck, CEFA - Erste Group
2019
Von vielen externen Faktoren irritiert

                                         3
Internationale Aktienmärkte mit Fokus Wiener Börse - Ausblick 2020 Fritz Mostböck, CEFA - Erste Group
Trends Global
Aktien in 2019 im Aufwärtstrend

            Performances Asset-Klassen (seit Jahresbeginn, EUR)

                                                              Quelle: Datastream, Erste Group Research

                                                                                                         4
Internationale Aktienmärkte mit Fokus Wiener Börse - Ausblick 2020 Fritz Mostböck, CEFA - Erste Group
Die Schuldenkrise ist global und aktueller denn je
Staatsverschuldung und Budgetdefizit pro Kopf (EUR tsd)

                                                                      Blasengröße zeigt Staatsverschuldung pro Kopf (2018)
                                                    8.0

                                                                                                                       USA
                                                                                                                       AA+
        Haushaltdefizit, in Pozent des BIP (2018)

                                                    6.0              PL
                                                                     A-          SK
                                                                                 A+
                                                    4.0
                                                                                 China HU           UK         Fra
                                                           Maastricht limit
                                                                                 A+                 AA         AA                                                  Japan
                                                                                       BBB
                                                                                                           Spanien                                                 A+
                                                                          RO                                                    Italien
                                                    2.0                   BBB-                             A                    BBB
                                                                                            FI                 Belg.
                                                                                            AA+                AA          Portugal
                                                      .0                                                                   BBB
                                                                      DK
                                                           0                     50                      100                     150            200              250
                                                                      AAA             Ire                                                     Griechenland
                                                                            Schwe     A+                             AT                       BB-
                                                                                            Deu                      AA+
                                                    -2.0       CZ           AAA
                                                                                NL          AAA
                                                               AA-              AAA                  SI         HR
                                                                                                     AA-        BBB-
     Euroraum-                                                                               Ser
            -4.0                                                                             BB
     durchschnitt,
     2018
                                                                                                  Staatsverschuldung in Prozent des BIP (2018)

                                                                                                                       Quellen: Erste Group Research, Europäische Kommission, S&P

                                                                                                                                                                                5
Internationale Aktienmärkte mit Fokus Wiener Börse - Ausblick 2020 Fritz Mostböck, CEFA - Erste Group
Zins-Ausblick 2020
Wesentliche Faktoren
USA & Eurozone: unterschiedliche Wirtschafts- und Leitzins-Entwicklung, aber:
Inflation und Renditen werden flach/unverändert erwartet

Anleihenmärkte durch politische Einflüsse unterstützt, wirtschaftliches Umfeld aber belastend:
     •   Art des Brexit‘s offen, Hard Brexit aus heutiger Sicht unwahrscheinlich,
     •   EZB-Ankaufsprogramm wieder aufgenommen, Ende ungewiss,
     •   Konjunktur bleibt verletzlich (Handelsstreit, etc.),
     •   Inflation in USA wie Eurozone in 2020 praktisch unverändert erwartet (2 bzw. 1,3%),
     •   Erste EZ-Zinsanhebung (Einlagen-Fazilität) frühestens in Q1 2022, Risiken erheblich,
     •   Zinsen sollten in den USA 2020 unverändert bleiben,
     •   Langsame Konjunkturerholung und anhaltende geldpolitische Unterstützung spricht im
         Wesentlichen für Seitwärtsentwicklung bei Renditen in USA wie Eurozone/ Deutschland.

     Rentenmärkte (USA, D): (1.) Verhaltene Konjunktur, (2.) schwache Inflationsdaten und
     (3.) anhaltend expansive Geldpolitik sprechen in Summe für niedrige Renditen.

                                                                                     Quelle: Erste Group Research

                                                                                                                6
Internationale Aktienmärkte mit Fokus Wiener Börse - Ausblick 2020 Fritz Mostböck, CEFA - Erste Group
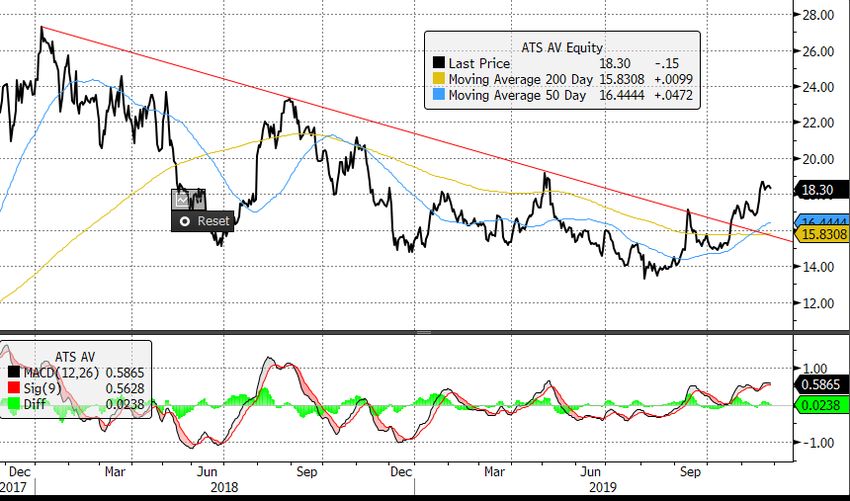
Fokus Null- bzw. Negativ-Zinspolitik
Konsequenzen aus dem japanischen Modell?!
GDP/ Capita                                                                    Gewinnentwicklung
                                                                               6
200

180
                                                                               5
160

140                                                                            4
120

100                                                                            3

 80
                                                                               2
 60

 40
                                                                               1
 20

 0                                                                             0
  2000      2002    2004   2006   2008   2010      2012   2014   2016   2018    2000   2002   2004   2006   2008   2010      2012    2014    2016    2018
                   Japan-GDP/Capita             Eurozone-GDP/Capita                           Gewinne Europa                 Gewinne Japan

      •   Gewöhnung an „New Normal“: Null-/Negativ-Zinsen, schwaches Wachstum und Nachfrage
      •   Fokus auf Investoren, welche gezwungen sind, weiterhin von Anleihen in Aktien umzuschichten
      •   Börsennotierte Unternehmen mit Fokus auf Profitabilität und höhere Dividenden
      •   Fiskalpolitik und Aktienmärkte profitieren von expansiver Geldpolitik bzw. Null- und Negativ-Zinsen
      •   Digitalisierung als Wachstumstreiber
      •   Expansion österreichischer Unternehmen in CEE stellt nach wie vor überdurchschnittlichen Ertrag
          sicher
                                                                                                                          Quelle: Datastream, Erste Group Research

                                                                                                                                                                 7
Globales Wachstum
Vorsichtiger Optimismus für 2020e
                                                                                       60      PMI Eurozone
                             Reales BIP-Wachstum in %
           6
                                                                                       55

                                                                                       50
           5                                                                     4,8
                                                      4,6                              45

           4                 3,9                                                       40
                                                                          3,6

                                                                                            Sep.10

                                                                                            Aug.13

                                                                                            Sep.17
                                                                                            Feb.10

                                                                                            Apr.11

                                                                                            Okt.14

                                                                                            Feb.17

                                                                                            Apr.18
                                                                                            Nov.11

                                                                                            Mär.14

                                                                                            Dez.15

                                                                                            Nov.18
                                                                                            Mai.15
                                                                                            Jun.12
                                                                                            Jän.13

                                                                                             Jul.16

                                                                                            Jun.19
                                               3,4
                       3
    in %

           3
                                                                                       70     PMI USA (ISM)
               2,2                                                 2,2
           2                            1,8                                            65
                                               1,2                        1,3
                      1,1                                                              60
           1
                                                                                       55

           0                                                                           50
                     2019E                    2020E                      2021E
                                                                                       45

                                                                                            Apr.11

                                                                                            Apr.18
                                                                                            Sep.10

                                                                                            Okt.14
                                                                                            Nov.11

                                                                                            Aug.13
                                                                                            Mär.14

                                                                                            Dez.15

                                                                                            Sep.17

                                                                                            Nov.18
                                                                                            Feb.10

                                                                                            Mai.15

                                                                                            Feb.17
                                                                                            Jun.12
                                                                                            Jän.13

                                                                                             Jul.16

                                                                                            Jun.19
                             USA   EZ   Emerging Markets    Welt

 Ausblick 2020e etwas verbessert: (1.) Politische Unsicherheit leicht gesunken, (2.) US Fed & EZB
           haben Geldpolitik spürbar gelockert, (3.) bei Frühindikatoren zeichnet sich Bodenbildung ab.
          Infolge steigender Dynamik auf der Exporte-Seite sollte sich das BIP-Wachstum der Eurozone
           2020 geringfügig auf +1,2% beschleunigen.
                                                                                                Quelle: Bloomberg, IWF, Erste Group Research

                                                                                                                                               8
Zentral- und Osteuropa
im relativen Vergleich

                         9
CEE wuchs seit Ausbruch der Krise stärker als die Eurozone
Region profitiert von soliden Fundamentalfaktoren

Reales BIP/Kopf
Kumulative Wachstumsraten 2007-2018                                                       CEE wird die Wettbewerbs-
   Expansion                                                                              fähigkeit vergleichsweise
   > 15
                                                                                          verbessern und weiter
   10 - 15
   5 - 10                                     +13.4%
                                                         +19.1%             +2.9%         Investitionen anziehen:
  0-5
Aktuell Abflachung und kein Abschwung
Industrie schwächer, Retail bleibt unterstützend

                                                   11
CEE8-Prognosen 2020e & 2021e

                   Reales BIP-Wachstum
   Reales BIP Wachstum (%) 2018 2019f 2020f 2021f                         Das Wirtschaftswachstum in Q3 2019
   Kroatien                                    2.6   3.2   2.5   2.4       kühlte in den meisten CEE-Ländern
   Tschechien                                  2.9   2.6   2.5   2.7       aufgrund externer Faktoren ab.
   Ungarn                                      5.1   4.9   3.5   2.8      Schwache Weltwirtschaft, Unsicherheit zu
   Polen                                       5.1   4.2   3.4   2.8       Brexit, ungelöster Handelskonflikt und
                                                                           mögliche strukturelle Veränderungen im
   Rumänien                                    4.1   4.0   3.5   3.4
                                                                           Automobil-Sektor belasten CEE.
   Serbien                                     4.3   3.6   4.0   4.1
   Slow akei                                   4.0   2.5   2.3   2.6      Die starke Binnennachfrage ermöglicht
                                                                           den CEE-Ländern 2019 aber ein 3x-
   Slow enien                                  4.1   2.8   2.7   2.5       schnelleres Wachstum als im Euroraum.
   CEE8 (Mittelw ert)                          4.4   3.8   3.2   2.9
   Österreich                                  2.4   1.6   1.4   1.5      Wir erwarten für 2020e eine Abkühlung
                                                                           bis auf 3.2% und 2021e bis auf 2.9%.
   Euroraum                                    1.9   1.1   1.2   1.3

Quellen: Erste Group Research, Eurostat, ECB

                                                                                                                      12
Erste Group Research ESG-Disclosure Score Ranking
ESG als Kapitalmarkt-Thema wird Mainstream

                           Markt Cap ESG Disclosure Score Environmental   Social   Governance
OMV                           17,463                 65.1         63.6     67.2          66.1   •   OMV und Verbund liefern
Verbund                       16,071                 57.4         52.7     63.2          62.5
RBI                            7,115                 51.8         42.9     55.0          66.1
                                                                                                    umfangreich ESG-Daten und
voestalpine                    4,335                 48.3         45.0     52.6          51.8       führen ESG Disclosure
Telekom Austria                4,745                 48.1         46.3     53.1          46.4       Ranking an.
Lenzing                        2,423                 47.1         40.3     57.9          51.8
Flughafen Wien                 3,125                 44.6         39.5     40.4          60.7
Wienerberger                   2,955                 44.6         34.9     57.9          53.6
                                                                                                •   ESG-Datenmenge/
Palfinger                      1,049                 42.1         37.2     59.6          35.7       -qualität ist - wie im
AMAG                           1,079                 41.3         36.4     47.4          46.4       europäischen Vergleich - vom
Zumtobel                         306                 41.3         40.3     28.1          57.1
BAWAG                          3,764                 40.8         29.5     46.7          57.1       Sektor abhängig (Energie,
ANDRITZ                        4,012                 40.5         34.9     42.1          51.8       Utilities, Industrieunternehmen
Österreichische Post           2,263                 39.3         34.1     38.6          51.8       liefern die meisten Daten) und
UNIQA                          2,742                 38.6         29.5     40.0          55.4
SBO                              757                 32.2         23.3     38.6          46.4       wird von Marktkapitalisierung
VIG                            3,142                 25.9         10.7     26.7          55.4       und Index-Zugehörigkeit
IMMOFINANZ                     2,774                 23.6          9.3     22.8          57.1       bestimmt.
CA Immo                        3,532                 23.1          8.5     33.3          46.4

1) Erste Group selbst wird nicht gecovert

      • Wir reagieren als Erste Group Research pro-aktiv auf internationale Kapitalmarkt-Bedürfnisse,
      • Wollen unseren Kunden/ Investoren ein umfassendes „State-of-the-Art“-Service bieten, welches
         auch ESG-Faktoren beinhaltet.
                                                                                                                Source: Erste Group Research

                                                                                                                                          13
Wiener Börse
Bewertung & Top Picks

                        14
Österreichische Aktien ja oder nein?
+ Niedrige Zinsen: Renditen für 10-jährige Staatsanleihen fallen in diesem Jahr auf neue
  Tiefstwerte, Österreich zur Zeit -0,14%
+ Fundamental niedrige Bewertung: das aktuelle Kurs-Gewinn-Verhältnis für den ATX liegt bei
  knapp unter 11,5%, deutlich unter dem historischen Schnitt
+ Dividendenrendite: liegt aktuell bei 3,9%, deutlich attraktiver als Staatsanleihen
+/- Wachstumsprognosen: Wachstumsprognosen eindeutig gedämpft, allerding immer noch positiv,
  Wachstum in CEE höher als in Westeuropa
+/- Gewinnprognosen: steigende Gewinnprognosen, allerdings abflachende bzw. leicht negative
  Gewinnrevisionen
+ Technische Indikatoren: Abwärtstrend gebrochen, technische Indikatoren stehen auf Kaufen
  (Ausbildung eines „Goldenen Kreuzes“)
+/- ATX Spezifika: hohe Gewichtung von Banken bzw. Öl- und Gas
-   Geopolitische Verwerfungen: Handelskonflikte, politische Konflikte
-   Europaspezifische Probleme: BREXIT, Italien, Autoindustrie, etc.

                                                                                              15
Aktien weiterhin attraktiv verglichen mit Anleihen
Rendite 10-jähriger Staatsanleihen, Realzinsen (%)           Dividendenrendite - nominal und real (%)

Aktien im aktuellen Umfeld Anleihen deutlich überlegen       Dividendenrendite - erwartete Entwicklung

 Inflation von rund 1,5% drückt Realverzinsung. Tilgung
  und Kupons werden nicht angepasst, verlieren an Wert.
  Steigende Renditen bewirken zusätzlich zwischenzeitliche
  Kursverluste bei Anleihen.

 Aktien sind Sachwerte: Gewinne und Kurse steigen mit
  der Inflation. Es besteht die Chance, dass Gewinnaus-
  schüttungen und damit Dividenden erhöht werden .

 Quellen: Bloomberg, Erste Group Research

                                                                                                         16
Bewertung ATX und Risikoprämien
Historische KGV-Entwicklung ATX             Historische Entwicklung der Bewertung

Historische Entwicklung der Risikoprämien   Entwicklung Gewinnschätzungen

                                                                            Quellen: Bloomberg, Erste Group Research

                                                                                                                17
Chartbild

            Quelle: Bloomberg

                                18
Stoxx Europe Segmentbetrachtung
Performance nach Sektoren YTD                                    Erwartetes Ergebniswachstum 2020

                                                                 Bewertung nach KGV

   Positive Kursentwicklung bei 17 von 19 Subindizes,
    Banken und Telecoms negativ

   Ergebniswachstum für alle Sektoren für 2019 prognostiziert

   Öl & Gas Werte mit höchstem erwarteten
    Ergebniswachstum, teilweise aufgrund Basiseffekte

   Niedrige Bewertung des Automobilsektors und der
    Banken, Technologieaktien mit höchstem KGV

 Quellen: Bloomberg,, Erste Group Research

                                                                                                    19
Top-Picks Österreich
 Welche Faktoren sollten 2020 berücksichtig werden?
 - ATX als Index mit geringerer Liquidität von Kapitalzu- und -abflüssen besonders betroffen
 - Volatilität bleibt voraussichtlich erhöht
 - Klare Geschäftsmodelle und hohe Visibiltät sind gefragt
 - Fundamental „zu“ günstige Werte (Value)
 - Wirtschaftswachstum
 - M&A Aktivität

 In Österreich:
 Immofinanz, S Immo Weiterhin bestes Umfeld für Immobilienaktien, notieren deutlich unter EPRA NAV
 RBI                      Starkes Wachstum und fundamental eindeutig zu günstig, Dividende als Trigger
 AT&S                     Technologieaktie mit langfristigen Perspektiven, steigendes Wachstumsdynamik
 FACC                     Aktie nach schwierigem 1. Halbjahr deutlich zurückgekommen, Einstiegsgelegenheit
 SBO                      Volatilster Wert im ATX, attraktives Niveau mit Blick auf aktuellen Ölpreis
 DO & CO                  Zweistelliges Umsatzwachstum, auch für 2020 erwartet

                                                                                                             20
Wiener Börse
Fazit

               21
ATX Index
Aktuelle Unternehmens-Gewichtungen
                                                                  Wienerberger   Andritz
                                                                                             AT&S
                                                                     5,9%         6,2%
                                                    voestalpine                              0,9%
                                                       6,3%                                         BAWAG
                                                                                                     3,8%
                                              VIG
    CEE Investment                           1,9%
                                                                                                              DO & CO
     Story (ATX):                    Verbund
                                                                                                               1,2%
                                      6,2%
             ~77%                    UNIQA
                                                                                                               CA Immo
                                                                                                                4,9%
                                      2,2%

                                    Telekom Austria                                                            Erste Group
                                         1,9%                                                                     20,0%

                                         S Immo
                                          2,1%                                                                  FACC
                                                                                                                0,6%
                                                    SBO
  Source: Erste Group Research,
                                                    1,2%                                                 Immofinanz
  based on ATX market weightings,
                                                                                                            4,5%
  Nov 2019                                                   RBI
                                                            7,7%
                                                                          OMV         Post     Lenzing
                                                                         17,8%        2,3%      2,5%

                 CEE bleibt der dominante Faktor für den ATX.

                                                                                                                             22
Performance vs. Volumen
Index            2013       2014    2015     2016      2017         2018         2019
Performance p.a.                                                               to date
Dow Jones        +27%       +8%     -4%    +13.4%    +25.1%        -6,7%        21,7%
DAX 30           +26%       +3%     +8%     +6.5%    +12.5%       -18,3%        25,5%
CAC 40           +18%       -1%     +8%     +4.1%     +9.3%       -11,9%        26,6%
AEX              +17%       +6%     +2%     +9.5%    +12.7%       -11,1%        23,2%
SMI              +20%      +10%     -4%     -6.4%    +14.1%       -10,2%        24,2%
ATX               +6%      -15%     +9%     +9.2%    +30.6%       -19,7%        15,9%

Average turnover/day, Wr. Börse
                       in EUR mn       Change in %
2008                        562.9          - 21.2%             ATX 2019 Under-Performer.
2009                        289.5          - 48.6%
2010                        294.4           + 1.7%
2011                        241.0           -18.1%
2012                        145.2           -32.2%            Nach Konsolidierung erstmals
2013                        155.3            +7.0%                 wieder Abnahme in
2014                        191.4          +23.3%                  Handelsumsätzen.
2015                        234.2          +22.4%
2016                        223.6            -4.5%
2017                        267.4          +19.6%
2018                        279.0            +4.3%
2019 bis dato               235.5           -15.6%                      Stand: November 2019

                                                                                               23
Bewertungs-/ Gewinnwachstums-Vergleich

                                                                                                     Bubble size indicates discount/premium to
                                                       25                                            average valuation
                                                                                                     (white = discount, blue = premium)

                   EPS growth (forward, y/y, 12M, %)   20                            MEA
                                                                                                               Asia ex-Japan
                                                                                                     Asia Pacific
                                                       15                                             ex_Japan            North America
                                                                                                                LatAm
                                                                                                                           World
                                                       10                                  Austria
                                                                                                                 Eurozone
                                                                                     CEE
                                                        5
                                                                Eastern Europe

                                                        0

                                                       -5
                                                            5   6    7   8       9    10     11      12    13    14   15     16    17    18      19

                                                                                       P/E (forward, 12M)

            Region Eastern Europe/ CEE sowie Österreich mit Abschlag bewertet.

* Eastern Europe (inkl. Russland)                                                                                                       Quelle: Factset, eigene Berechnungen

                                                                                                                                                                               24
ATX - Ausblick 2020
Wesentliche Faktoren und Prognose

 ATX in 2019 Under-Performer, „New Normal“ in Zinstief begünstigt Aktien,
 Stabiles, vergleichsweise besseres Sentiment CEE (geringes UK-Exposure
  sowie kaum Abhängigkeiten zu großen Emerging Markets, Profiteur niedrige
  Rohstoffpreise)
 Intaktes Wachstumsdifferential CEE vs. Eurozone; durchschnittliches BIP-
  Wachstum CEE 2020e 3,2% vs. 1,2% erwartet (2021e: 2,9% vs. 1,3%),
 Bewertung bleibt attraktiv (KGV 2020e: 10,6x; KGV 2021e: 10,1x),
 Gewinnwachstum intakt aber verhaltener als zuletzt (2020e: +5,5%; 2021e:
  +4,0%), attraktive Dividendenrendite (2020e: 4,2%, 2021e: 4,6%)
 Gewinnrendite Aktien zu 10Y-Staatsanleihen: 20/21e +9,7% vs. -0,14%1),
 Schwächeres Handelsvolumen, intaktes Interesse ausländischer Investoren.

                 Indexprognose 2020e: 3.500 Punkte im ATX
                                                                     1) 27.   November 2019

                                                                                          25
Ausblick 2020
Internationale Aktienmärkte
mit Fokus Wiener Börse

Fritz Mostböck, CEFA
Head of Group Research

Christoph Schultes, CIIA
Chief Equity Analyst CEE

Wien, Dezember 2019
Contacts
                       Visit page www.erstegroup.com or type on Bloomberg ESTE .

Erste Group Research (Vienna)
Fritz Mostböck, CEFA                               Juraj Kotian                                        Gudrun Egger, CEFA
Head of Group Research                             Head of CEE Macro/ FI Research                      Head of Major Markets & Credit Research
+43 5 0100 11902                                   +43 5 0100 17357                                    +43 5 0100 11909
friedrich.mostboeck@erstegroup.com                 juraj.kotian@erstegroup.com                         gudrun.egger@erstegroup.com

                                                   Henning Eßkuchen
                                                   Head of CEE Equity Research
                                                   +43 5 0100 19634
                                                   Henning.esskuchen@erstegroup.com

Local Research Offices
Bratislava                           Budapest                            Bucharest                                Istanbul
Slovenska Sporitelna                 Erste Bank Hungary                  Banca Comerciala Romana (BCR)            Tarkus Advisory*
Head: Maria Valachyova               Head: Jozsef Miro                   Head: Horia Braun                        +90 212 371 2542
+421 (2) 4862 4158                   +36 (1) 235 5131                    +40 3735 10 424
valachyova.maria@slsp.sk             Jozsef.Miro@erstebroker.hu          Horia.BraunErdei@bcr.ro

Prague                               Warsaw                              Zagreb/ Belgrade
Ceska Sporitelna                     Erste Securities Polska             Erste Bank
Head: David Navratil                 Head: Tomasz Duda                   Heads: Alen Kovac, Mladen Dodig
+420 224 995 439                     +48 22 330 6253                     +385 72 37 1383, +381 1122 09178
DNavratil@csas.cz                    Tomasz.Duda@erstegroup.com          akovac2@erstebank.com
                                                                         Mladen.Dodig@erstebank.rs

                                                                                                                 * Exclusive equity research partner

                                                                                                                                                       27
Disclaimer
Erste Group Bank AG
Group Research
1100 Wien, Am Belvedere 1
Telefon: +43 (0)5 0100 - 11902                 Copyright: 2017 EGB AG, All rights reserved

This investment research (the "Document") has been prepared by Erste Group Bank AG or any of its consolidated subsidiaries (together with consolidated subsidiaries "Erste Group") independently
and objectively for the purpose of providing additional economical information about the analyzed company or companies. The Document is based on reasonable knowledge of Erste Group's
analyst in charge of producing the Document as of the date thereof and may be amended from time to time without further notice. It only serves for the purpose of providing non-binding information
and does not constitute investment advice or investment recommendations. This Document does not constitute or form part of, and should not be construed as, an offer, recommendation or
invitation to subscribe for or purchase any securities, and neither this Document nor anything contained herein shall form the basis of or be relied on in connection with or act as an inducement to
enter into any contract or inclusion of a security or financial product in a trading strategy. All information, analysis and conclusions provided herein are of general nature. This Document does not
purport to provide a comprehensive overview about any investment, the potential risks and results nor does this Document take into account any individual needs of an investor (the "Investor") in
relation to proceeds, tax aspects, risk awareness and appropriateness of the security or financial product. Therefore, this Document does not replace any investor- and investment-related evaluation
nor any comprehensive risk disclosure; any security or financial product has a different risk level. Performance charts and example calculations do not provide any indication for future performance
of the security or the financial product. Information about past performance does not necessarily guarantee a positive development in the future and investments in securities or financial products
can be of risk and speculative nature. The weaker the Company's credit-worthiness is, the higher the risk of an investment will be. Not every investment is suitable for every investor. Therefore,
Investors shall consult their advisors (in particular legal and tax advisors) prior to taking any investment decision to ensure that – irrespective of information provided herein – the intended purchase
of the security or financial product is appropriate for the Investor's needs and intention, that the Investor has understood all risks and that, after due examination, the Investor has concluded to make
the investment and is in a position to bear the economical outcome of such investment. Investors are advised to mind the client information pursuant to the Austrian Securities Supervision Act 2007.
Financial analysis is produced by Erste Group's division for financial analysis within the framework provided by applicable laws. The opinions featured in the equity and credit research reports may
vary. Investors in equities may pursue different interests compared to those of investors on the credit side, related to the same issuer. The analyst has no authority whatsoever to make any
representation or warranty on behalf of the analyzed Company, Erste Group, or any other person. While all reasonable care has been taken to ensure that the facts stated herein are accurate and
that the forecasts, opinions and expectations contained herein are fair and reasonable, Erste Group (including its representatives and employees) neither expressly nor tacitly makes any guarantee
as to or assumes any liability for the up-to-dateness, completeness and correctness of the content of this Document. Neither a company of Erste Group nor any of its respective managing directors,
supervisory board members, executive board members, directors, officers or other employees shall be in any way liable for any costs, losses or damages (including subsequent damages, indirect
damages and loss of profit) howsoever arising from the use of or reliance on this Document. Erste Group, associated companies as well as representatives and employees may, to the extent
permitted by law, have a position in the securities of (or options, warrants or rights with respect to, or interest in the financial instruments or other securities of) the Company. Further, Erste Group,
associated companies as well as representatives and employees may offer investment services to the Company or may take over management function in the Company. This Document has been
produced in line with Austrian law and for the territory of Austria. Forwarding this Document as well as marketing of financial products described herein are restricted or interdicted in certain
jurisdictions. This, in particular, applies to the United States, Canada, Switzerland, Australia, Korea and Japan. In particular, neither this Document nor any copy hereof may be taken or transmitted
or distributed, directly or indirectly, into the United States or to US Persons (as defined in the U.S. Securities Act of 1933, as amended) unless applicable laws of the United States or certain federal
states of the United States provide for applicable exemptions. Any failure to comply with these restrictions may constitute a violation of the laws of any such other jurisdiction. Persons receiving
possession of this Document are obliged to inform themselves about any such restrictions and to adhere to them. By accepting this Document, the recipient agrees to be bound by the foregoing
limitations and to adhere to applicable regulations. Further information may be provided by Erste Group upon request. This Document and information, analysis, comments and conclusions provided
herein are copyrighted material. Erste Group reserves the right to amend any opinion and information provided herein at any time and without prior notice. Erste Group further reserves
the right not to update any information provided herein or to cease updates at all. All information provided in this Document is non-binding. Misprints and printing errors reserved.

If one of the clauses provided for in this disclaimer is found to be illicit, inapplicable or not enforceable, the clause has to be treated separately from other clauses provided for in this disclaimer to
the largest extent possible. In any case, the illicit, inapplicable or not enforceable clause shall not affect the licitness, applicability or enforceability of any other clauses.

                                                                                                                                                                                                               28
Appendix

           29
Bewertung
Aktienmärkte und ATX
                         KGV                    Gewinnwachstum

                  2018   2019e   2020e   2018         2019e         2020e

    Österreich    11,4    11,5   10,6    -0,9%        -0,6%         5,5%

    USA           23,9   20,0    18,6    20,8%        4,8%          6,9%

    Europa        17,7   16,6    14,9    4,9%         -4,8%         10,7%

    Deutschland   15,6   15,8    13,9    -6,6%        -8,1%         13,6%

    Frankreich    19,3   17,0    15,2    10,9%        -4,3%         11,7%

    Holland       13,6   17,2    15,8    8,4%         -6,1%         8,8%

    Schweiz       23,6   19,8    17,8    9,5%         19,4%         11,1%

                                            Quelle: Factset, Bloomberg, Erste Group Research

                                                                                           30
Sie können auch lesen