REVUE TECHNIQUE LUXEMBOURGEOISE - CAHIER SCIENTIFIQUE PUBLICATION ASSOCIATION OF ENGINEERS I ARCHITECTS I SCIENTISTS I INDUSTRIALS 1
←
→
Transkription von Seiteninhalten
Wenn Ihr Browser die Seite nicht korrekt rendert, bitte, lesen Sie den Inhalt der Seite unten

CAHIER SCIENTIFIQUE
REVUE TECHNIQUE
LUXEMBOURGEOISE
PUBLICATION ASSOCIATION OF ENGINEERS I ARCHITECTS I SCIENTISTS I INDUSTRIALS 1 | 2016

2   CAHIER SCIENTIFIQUE | REVUE TECHNIQUE LUXEMBOURGEOISE 1 | 2016

                            REVUE TECHNIQUE LUXEMBOURGEOISE
                            www.revue-technique.lu
                            cahier scientifique éditée pour             éditée par
                            da Vinci asbl. - Forum of Architecture |    Responsable Revue Technique Sonja Reichert
                            Engineering | Science & Technology          Graphisme Jan Heinze
                            Impression 3.500 exemplaires
                            Imprimerie HENGEN Print & More              t 45 13 54 23 s.reichert@revue-technique.lu
                            14, rue Robert Stumper L- 1018 Luxembourg   6, bv. G. D. Charlotte L- 1330 Luxembourg
CAHIER SCIENTIFIQUE | REVUE TECHNIQUE LUXEMBOURGEOISE 1 | 2016           3

                                                                                                                                EDITO_
                                                                                                                                            © Bernhard Peters

Seit 1916 werden in Luxemburg Ingenieure ausgebildet,          Lehre und Forschung gehen dabei Hand in Hand. Zukunftsorien-
womit die heutige Research Unit in Engineering Science         tierte Ingenieursausbildung vermittelt breit angelegtes, solides
(RUES) auf die längste Tradition im enseignement supérieur     Methodenwissen. Dann kann der Absolvent später im Berufsleben
im Land blickt.                                                neu aufkommende Technologien erkennen, aufgreifen, weiteren-
                                                               twickeln und zum wirtschaftlichen Vorteil des Unternehmen ein-
Exakt vor hundert Jahren, im September 1916, wurde der
                                                               setzen.
erste «Cours technique du supérieur» angeboten, der spä-
ter in das Institut Supérieur de Technologie, IST, überging.   Ausbildung in neuen Technologien schafft Arbeitsplätze. So stehen
Das Lehrangebot erweiterte sich mit der Gründung der           inzwischen auch asiatische Produktionswerke unter dem Druck,
Universität im Jahre 2003 um die ingenieurwissenschaft-        die Kosten zu senken. Sie versuchen durch strategische Beteiligun-
liche Forschung. Inzwischen lehren und forschen hier zah-      gen, bspw. an europäischen Roboterherstellern, sich den Zugang
lreiche international anerkannte Universitätsprofessoren,      zur erforderlichen Technologie zu sichern. Passend dazu kündigt
denen die 100-jährige Tradition Verpflichtung und Ansporn      Adidas an, seine manuelle Produktion aus China zurückzuholen
zugleich ist.                                                  und in der bayerischen Provinz eine „Hochgeschwindigkeitsfa-
                                                               brik“ zu etablieren.
Die ständige Verbesserung der Lehrqualität und Erweite-
rung um die wissenschaftliche Forschung in ausgewählten        Industrieroboter tragen dazu bei, nicht- ergonomische
Bereichen führte zu weltweiter Aufmerksamkeit und Aner-        Arbeitsplätze zu vermeiden. Dazu ist das automatische Nachfahren
kennung der im Land erbrachten Leistungen. Die zuneh-          von dreidimensionalen Freiformflächen mit intelligenten Robotern
mende internationale Reputation zeigte sich unlängst im        ein erster, wichtiger Schritt. Die Echtzeitregelung technischer
guten Ranking von Times Higher Education, THE, welche          Prozesse ermöglicht Innovationen in der Produktion und
die Universität als eine der besten Neugründungen eva-         Steigerung der Wertschöpfung im Land. Auch High Performance
luierte sowie im Vergleich der etablierten Universitäten be-   Computing, HPC, hat großes Potential, das noch nicht vollständig
reits mit einen Platz unter den TOP 200 von 800 weltweit       gehoben ist, wie beispielsweise die hier beschriebene Simulation
einstufte, vor den anderen Universitäten der Großregion,       von Treibgut im Hochwasser.
wie bspw. Kaiserslautern oder Liege.
                                                               Lesen Sie in diesem Heft die Bestandsaufnahme des ICT-Ökosys-
Die RUES erforscht Technologien, die heute noch nicht          tem des Landes, wie medizinische Apps Ihre Daten sammeln und
bekannt sind, vermittelt dieses Wissen in der Lehre an die     welche Auswirkungen Industrie 4.0 auf den Arbeitsmarkt hat.
nächste Generation Ingenieure, und versetzt sie so in die
                                                               Die Universität trägt mit hervorragend ausgebildeten Ingenieuren
Lage, neue Technologien zu entwickeln, zu optimieren und
                                                               und hochwertiger Forschung zur Sicherung der Wettbewerbs-
anzuwenden. Die akademische Ausbildung wird durch das
                                                               fähigkeit, zur Steigerung der Profitabilität und letztendlich dem
Angebot an berufsbegleitender Fortbildung ergänzt. Ein
                                                               Steueraufkommen bei. Damit schließt sich wieder der Kreis zur
wichtiger Schwerpunkt der Ausbildung an der Universität
                                                               bereits erwähnten Lehre und Forschung, die ja schlussendlich auch
liegt auf nachhaltiger, ressourceneffizienter Technologie
                                                               finanziert werden muss - Ingénierie - zanter 1916.
und allem, was unter dem Themenkomplex vernetzte Sys-
teme bzw. Industrie 4.0 zusammengefasst wird.                  Prof. Dr.- Ing. Peter Plapper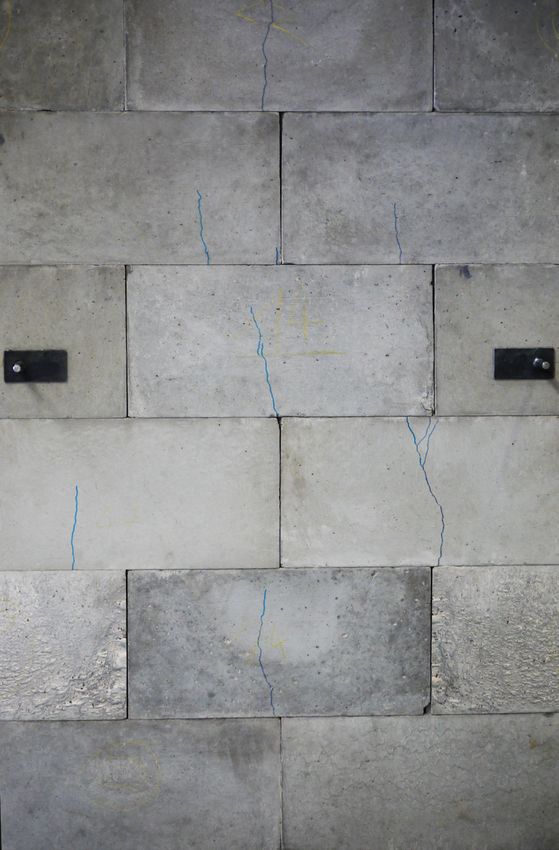
4   INDEX | REVUE TECHNIQUE LUXEMBOURGEOISE 1 | 2016

_INDEX

06_ 		                         TRAJECTORY TRACKING FOR ROBOTIC FREEFORM GRINDING
		                             Sophie Klecker, Doctoral Candidate , Prof. Dr.-Ing. Peter Plapper
08_		                          INDUSTRIE 4.0 - WIRKUNGEN AUF WIRTSCHAFT UND ARBEITSMARKT
		                             Prof. Dr. Enzo Weber
10_                            INNOVATIVE RECHNERISCHE METHODEN ZUM TRANSPORT VON TREIBGUT BEI HOCHWASSER
		                             Prof. Dr. - Ing. Bernhard Peters, Gabriele Pozzetti, Yu Liao
14_		                          NUMERICAL ANALYSIS FOR THE DETERMINATION OF STRESS PERCOLATION IN DRY-STACKED WALL SYSTEMS
		                             S. Agaajani, Civil Engineer, PhD, Asars Constructions sarl, Luxembourg City, 1637 Luxembourg
		                             D. Waldmann, F. Scholzen, Professors, Faculty of Sciences, Technology and Communication University of
		                             Luxembourg, Luxembourg City, 1359 Luxembourg
		                             A. Louge, Mechanical Engineer, PhD, Luxembourg
21_		                          DESIGN, MANUFACTURING AND ASSEMBLY OF A MOCK-UP OF A SATELLITE AROUND A PROTOTYPE ANTENNA
		                             Paul Kremer
24_		                          WIE SICHER SIND MEDIZINISCHE SMARTPHONES-APPS?
		                             Prof. Dr. Konstantin Knorr
26_		                          EUROPEAN RESEARCH & INNOVATION ACTION PROJECT BIOTOPE
		                             Dr. Carlo Harpes, Managing Director, itrust consulting s.à r.l., Ingo Senft, Chief Administrative Officer and Sales
		                             Manager, itrust consulting s.à r.l., Dr. Sylvian Kubler, Senior researcher, University of Luxembourg,
		                             Dr. Jérémy Robert, Senior researcher, University of Luxembourg
30_		                          MEASURING LUXEMBOURG’S STATE OF ICT DEVELOPMENT
		                             Nico Binsfeld, Jason Whalley, Newcastle Business School

                                     Les auteurs sont responsables du contenu des articles
PARTENAIRES | REVUE TECHNIQUE LUXEMBOURGEOISE 1 | 2016           5

                                                 © Bernhard Peters

                                      revue publiée pour_
                                             da Vinci asbl.
Forum of Architecture | Engineering | Science & Technology

                                  partenaires de la revue_

                           revue imprimée sur du papier_

                      ISSN: 2418-456X
6   CAHIER SCIENTIFIQUE | REVUE TECHNIQUE LUXEMBOURGEOISE 1 | 2016

Unergonomic working conditions, a decline in available labour force and uncompetitively high salaries make
automation an attractive solution for a variety of manufacturing processes. To achieve successful automation
of even complex, contact-based manufacturing processes, inspiration is more and more found in nature. In this
work, a biomimetic approach is chosen to address the grinding process of freeform geometries by industrial
robots.

TRAJECTORY TRACKING FOR ROBOTIC FREEFORM GRINDING_
Sophie Klecker, Doctoral Candidate, Prof. Dr.-Ing. Peter Plapper

_Figure 1: comprehensive challenge: Robotic Grinding, an interplay of free form following and grinding process

                                     This research work is part of the discipline of manufacturing
                                     engineering and more precisely of the automation of
                                     production processes.
                                     Hazardous environments and arduous work lead to an
                                     increasing lack in skilled and motivated labour force in
                                     manufacturing industry. This fact in combination with
                                     uncompetitively high manpower costs in Luxembourg                           are integrated and extended by robotic control. The
                                     make automation a promising option to keep production                       interplay of these subparts is shown in Figure 1.
                                     in the country while enhancing competitiveness through
                                                                                                                 In a first phase the focus lays on the left half of Figure 1:
                                     constant quality-levels and predictable production times.
                                                                                                                 the following of freeform surfaces and the related
                                     A challenge, as uttered by industry, is the desire to use                   robotic control. For the specific use case, different
                                     robotic manipulators for contact-based surface treatments                   surface following scenarios that could occur in the
                                     on complex 3dimensional geometries. Indeed, the industrial                  case of a freeform grinding process are investigated
                                     state-of-the-art still uses human workers instead of robotic                and the control strategy is adapted to the respective
                                     manipulators for these non-ergonomic processes. A special                   circumstances.
                                     focus is put on automating the grinding of internal and
                                                                                                                 Freeform grinding requires constant contact between
                                     external freeform surfaces.
                                                                                                                 workpiece and tool, repetitive processing of the
                                     Biomimetic research aims for human-made solutions                           same surface, reciprocating motion, where applicable
                                     mimicking biological solutions, taking advantage of the                     taking into account a certain depth of cut, switching
                                     strength of natural evolution. Applied to the automation                    between different surfaces and uncertainties from
                                     of the grinding process, this means analyzing the human                     different sources. The latter are both system-inherent,
                                     way to perform the task, to grind a freeform surface.                       including unknown robot dynamics and parameters and
                                                                                                                 environmental uncertainties.
                                     Besides a good idea of the global process and its critical
                                     points, the human analogy allows to divide the process                      A benchmark-trajectory which is considered is a convex
                                     into two subprocesses: freeform following and grinding. In                  path followed by a jump-switch to the same convex path,
                                     order to perform robotic grinding, first the surface at stake               shifted by the intended depth of cut. Figure 2 illustrates
                                     is followed and then the grinding force is added to remove                  the desired movement of the end-effector of the robotic
                                     the required amount of material before both subprocesses                    manipulator.
CAHIER SCIENTIFIQUE | REVUE TECHNIQUE LUXEMBOURGEOISE 1 | 2016   7

_Figure 2: desired end-effector movement in the x-y-plane

The addressed problem, covers a subpart of the
comprehensive problem, freeform grinding, namely
the control of a trajectory tracking industrial robotic
manipulator with switching constraints. The dynamics of
the constrained robotic manipulator are represented in
the form of the following equation:

With M(q) the robotic manipulator inertia matrix, V
the Coriolis matrix, V(q,q)q the centrifugal and Coriolis             The stability of the suggested control scheme can be proven
vector, G(q) the gravity vector, control moment τ is                  by Lyapunov theory.The validity of the suggested scheme
the vector of actuator torques and vector q giving the                is demonstrated by a simulation of a planar 2-link robot
positions of the links. A sliding mode control scheme,                in MATLAB/SIMULINK. The 2-link robot follows the path
which is extended with an adaptive parameter update                   shown in Figure 2 while applying the discussed adaptive
law to account for parameter-uncertainty is applied.                  sliding mode strategy over a period of 20s. Figures 3 and 4
                                                                      show the simulation results, the position tracking of the first
The following control torque is suggested:
                                                                      and the second link, respectively.
                               . .                                    The obtained results show a good correspondence between
                                                                      ideal signals and tracking signals.
Where a and b are positive constants and

With c being a vector relating to the bound of the
trajectory-function and

where ∆ represents the boundary layer.
And the chosen sliding variable

Where qd is the desired position, ϑ is a positive diagonal
matrix and e is the tracking error, defined as the                    _Figure3: position tracking of link 1
difference of the actual position and the desired position.
Because parameter c is of highly uncertain nature, the
implementation of a parameter update law is suggested.
The following update law was introduced by [1]:

where p is a constant and c̃ is an estimate of c.

                               Reference:
     [1] Jasim I.F., Plapper P.W., Adaptive Sliding Mode Control of
     Switched Constrained Robotic Manipulators, 2013 11th IEEE
   International Conference on Industrial Informatics (INDIN), 305-
                                    310.                              _Figure4: position tracking of link 2
   https://commons.wikimedia.org/wiki/File:Eye_I.jpg (22.10.2015)
    http://www.welcomemobility.co.uk/images/products/medium/          www.uni.lu
                HC_091048776.jpg (22.10.2015)
       http://www.thenanoage.com/cryonics.htm (22.10.2015)
   https://grabcad.com/library/90-degree-taper-pipe (28.09.2015)
    https://commons.wikimedia.org/wiki/File:Grinding_Sparks_-_
             Kolkata_2011-11-26_7427.JPG (22.10.2015)
     http://www.metal-supply.com/announcement/view/7193/
    kuka_roboter_is_presenting_a_new_robot_generation_at_
          automatica_2010#.Vgkr5RvouUk (28.09.2015)

        A similar version of this work is presented at the 14th
    International Conference on Industrial Informatics in Poitiers,
                        France 18-21 July 2016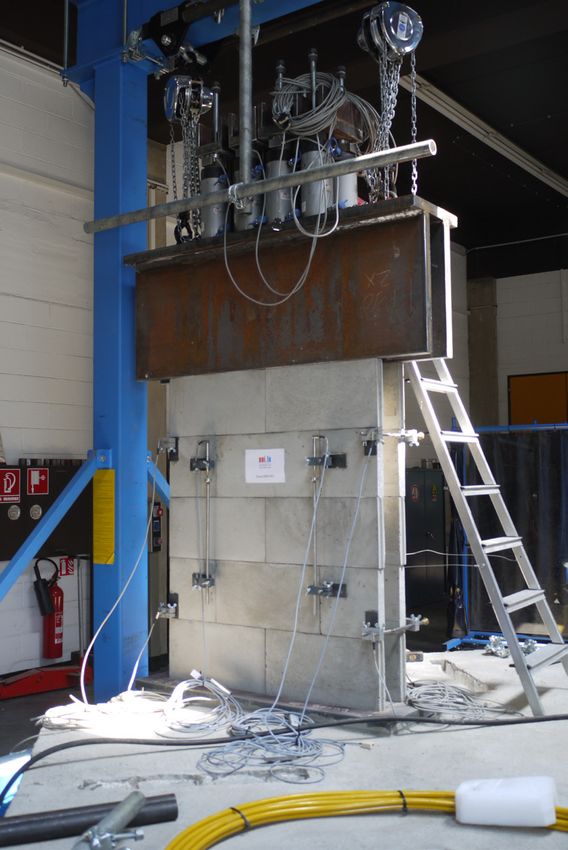
8   CAHIER SCIENTIFIQUE | REVUE TECHNIQUE LUXEMBOURGEOISE 1 | 2016

Die neueste Welle des technologischen Fortschritts wird intensiv unter dem Namen Industrie 4.0 diskutiert. Nach
den bisherigen industriellen Revolutionen geht es dabei um die Vernetzung der virtuell-digitalen und physischen
Welt sowie um maschinelles Lernen in der Produktion. Einbezogen werden Maschinen, Produkte, Informations-
und Kommunikationssysteme sowie der Mensch. Ziel ist, dass Wertschöpfungsketten vollständig digital gesteuert
werden bzw. sich selbstorganisiert steuern können. Eine effizientere, flexiblere und individuellere Produktion soll
das Ergebnis sein.

INDUSTRIE 4.0 - WIRKUNGEN AUF WIRTSCHAFT UND
ARBEITSMARKT_
Prof. Dr. Enzo Weber

                            Wie die Zukunft der Arbeit unter diesen Bedingungen              In der Szenarioanalyse ergibt sich eine zunehmende
                            aussehen wird, ist umstritten:                                   Wertschöpfung, die bei steigender Produktivität und
                            Die einen befürchten massenweise Jobverluste, wenn               höheren Anforderungen an die Arbeitnehmer vor
                            heutige Berufe durch vernetzte Roboter überflüssig               allem in einer wachsenden Lohnsumme resultiert. Beim
                            gemacht werden, die anderen zeigen Glanzbilder von               Beschäftigungsbestand zeigen sich keine wesentlichen
                            großen Beschäftigungs- und Innovationsgewinnen sowie             Änderungen; in der Summe ist Industrie 4.0 also weder
                            eine Entlastung der Arbeitnehmer auf.                            eine Jobmaschine noch eine Beschäftigungsvernichterin.
                            Technologischer Fortschritt ist so alt wie die Menschheit,       Dahinter kommt es allerdings zu deutlichen Bewegungen:
                            und zumindest bisher ist die Arbeit nicht ausgegangen.           In den aus 54 Berufsfeldern und 63 Wirtschaftszweigen
                            Natürlich, nur allzu leicht tendiert jede Generation dazu,       bestehenden Zellen gehen innerhalb von zehn Jahren
                            das vor ihr Liegende als qualitativen Sprung zu deuten,          über das Basisszenario hinaus 490 000 Arbeitsplätze
                            der alle bisherigen Gesetze und Reaktionsmuster obsolet          verloren, während anderweitig 430 000 neu geschaffen
                            macht. Einerseits liegt man damit aber regelmäßig falsch.        werden. Vor allem Berufe im produzierenden Bereich
                            Oder meinen wir wirklich, dass der technologische                verlieren, beispielsweise Maschinen bedienende Berufe.
                            Fortschritt gerade jetzt damit beginnt, Arbeit massenhaft        In einer Reihe von Berufshauptfeldern und speziell bei
                            zu reduzieren, während er das über Jahrtausende nicht            Dienstleistungen gibt es dagegen Gewinne, die höchsten
                            getan hat?                                                       bei IT- und naturwissenschaftlichen Berufen.
                            Andererseits darf man es sich aber auch nicht zu leicht          Bezogen auf Qualifikationsstufen gewinnt der
                            machen: So ging der Wandel weg von herkömmlicher                 akademische Bereich, die wesentlichen Verluste treten
                            Fabrikarbeit seit den 1970er Jahren mit einem starken            im Bereich der mittleren Qualifikationen auf. Auch
                            Aufbau struktureller Arbeitslosigkeit vor allem von              die Nachfrage nach Niedrigqualifizierten geht zurück.
                            Niedrigqualifizierten einher. Dieser Gegensatz zeigt vor allem   Insgesamt zeigt sich, dass die Wirkung von Industrie
                            eines: Für eine umfassende Bewertung der ökonomischen            4.0 sogar zu einem gewissen Ausgleich der sich im
                            Wirkungen von Industrie 4.0 ist eine Vielzahl von Effekten       Basisszenario abzeichnenden Ungleichgewichte führen
                            zu berücksichtigen; das Verschwinden von Arbeitsplätzen          kann: Engpässe bei den Ausbildungsberufen der
                            ebenso wie die Schaffung von neuen, Wandlung                     Industrie werden tendenziell gemildert. Für das stark
                            von Anforderungen, effizientere Prozesse und neue                steigende Angebot im akademischen Bereich wird
                            Produkte, volkswirtschaftliche Kreislaufzusammenhänge,           dagegen zusätzliche Nachfrage generiert. Für eine
                            Anpassungen von (Arbeits-)Angebot und Nachfrage, Preis-          Wirkungsanalyse der Arbeitsmarktentwicklung muss
                            und Mengenreaktionen.                                            neben den die Debatte beherrschenden Änderungen
                                                                                             des Arbeitskräftebedarfs also auch die Entwicklung des
                            In einer Studie des Instituts für Arbeitsmarkt- und
                                                                                             Arbeitskräfteangebots mitgedacht werden.
                            Berufsforschung, des Bundesinstituts für Berufsbildung
                            und der Gesellschaft für wirtschaftliche Strukturforschung       Dieses scheinbar so beruhigende Ergebnis soll aber
                            wurde das komplexe gesamtwirtschaftliche Q-INFORGE-              keine Entwarnung signalisieren. Die schwierige
                            Modell für eine Industrie-4.0-Szenarioanalyse verwendet.         Arbeitsmarktsituation von Geringqualifizierten wird sich
                            Das Modell bildet eine umfassende Makroökonomie                  nach den Ergebnissen tendenziell noch verschlechtern.
                            und einen detaillierten Arbeitsmarkt ab, wobei                   Wenn in diesem Bereich auch Impulse beispielsweise
                            Arbeitsangebot und -nachfrage nach Branchen, Berufen             durch den Einsatz von Assistenzsystemen denkbar sind,
                            und Qualifikationen gegliedert werden.                           wächst wohl doch die schon bestehende Notwendigkeit
                                                                                             arbeitsangebotsseitiger Maßnahmen.
                            Funktionaler Kern ist ein Matchingmodul, das berufliche
                            Flexibilitäten zulässt sowie Rückwirkungen über Lohn- und        Hinter den gesamtwirtschaftlichen Wirkungen des
                            Preisreaktionen generiert. Das Szenario soll über zahlreiche     Phänomens Industrie 4.0 stehen auf betrieb-licher und
                            Komponenten wie Investitionen, Produktivität, Berufe und         politischer Ebene bedeutende Herausforderungen.
                            Tätigkeiten sowie Nachfrage Industrie 4.0 ökonomisch             Schließlich sind erhebliche Verschiebungen und
                            erfassen.                                                        Veränderungen     von     Arbeitsplätzen    absehbar.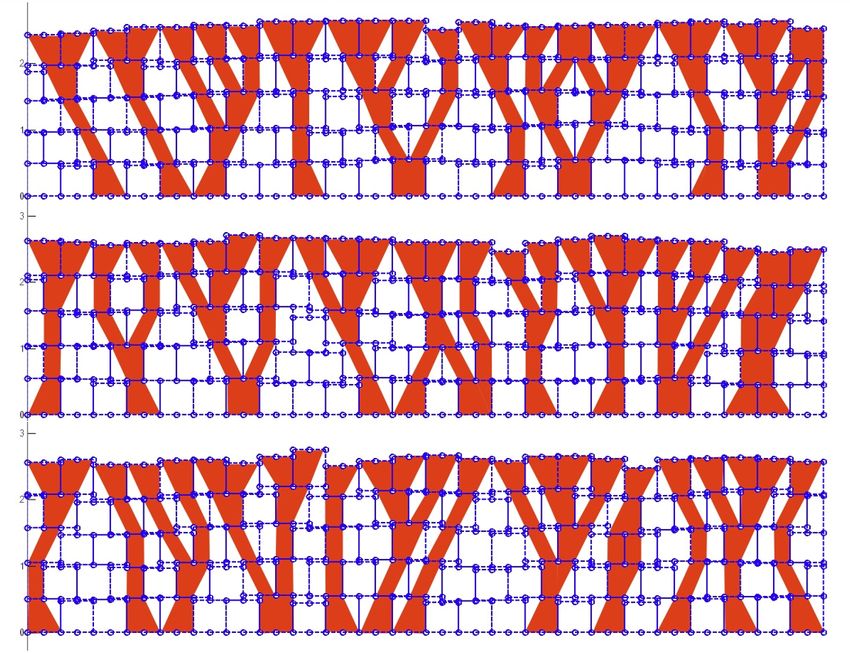
CAHIER SCIENTIFIQUE | REVUE TECHNIQUE LUXEMBOURGEOISE 1 | 2016   9

Eine zentrale Rolle kommt dabei Bildung und                   und Gesundheitsschutz, die betriebliche Mitbestimmung,
                         . .
Weiterbildung zu. Es liegt nahe, auf eine Stärkung            die soziale Sicherung und der Datenschutz werden sich
digitaler Inhalte zu verweisen, aber mindestens ebenso        neuen Herausforderungen gegenübersehen. Während das
wichtig wird es sein, Kompetenzen wie konzeptionelles         hier beschriebene Szenario auf die Industrie fokussiert ist,
Denken, Abstraktions- und Kommunikationsfähigkeit zu          ergeben sich bereits jetzt auch für den Dienstleistungsbereich
vermitteln.                                                   deutliche Effekte. Eine umfassende Untersuchung der
                                                              Wirkung von Digitalisierung in der gesamten Wirtschaft
Bei sich ändernden und erhöhten Anforderungen wird
                                                              (Wirtschaft 4.0) werden die Projektpartner im nächsten Jahr
nach der Erstausbildung die Weiterbildung entscheidend
                                                              vorlegen.
werden, um Kompetenzen laufend weiterzuentwickeln.
Hier kommt es auch darauf an, die gerade in Deutschland       www.iab.de
deutlich sichtbaren Vorteile formaler Qualifikation mit
flexiblem Kompetenzerwerb zu verbinden. Koordinierte
Anerkennung von zusätzlichen Qualifizierungsleistungen
ist ein Weg dahin.
Industrie 4.0 als Prozess, in dem durch die Digitalisierung
neue Tätigkeitsprofile entstehen, muss im internationalen
Wettbewerb aber auch entsprechend der eigenen
Stärken angegangen werden. So richtig ein wachsender
Fokus auf die Hochschulausbildung ist, so klar liegen
spezifisch deutsche Stärken im berufsbildenden System
und seiner Verzahnung von Theorie und Praxis.
Eine aktive - und nicht nur reaktive - Politik entwickelt
diese Stärken gezielt weiter, um Menschen auszubilden,
die die Umsetzung von Industrie 4.0 formen können.
Wenn Produktions-, Wissens- und Entwicklungsarbeit
weiter zusammenwachsen, ergeben sich neue Felder,
in die auch der berufsbildende Bereich hineinwachsen
kann. Denkbar ist, die Attraktivität in einem «Meister-
tenure-track» durch einen integrierten Ausbildungsweg
bis zum Meister zu erhöhen und diesen Grad mit
weiteren Kompetenzen zu stärken.
Auch die Arbeitsmarktpolitik muss sich auf
neue Entwicklungen einstellen. Derzeit liegt das
Entlassungsrisiko auf einem Rekordtief, was den
Arbeitsmarktaufschwung wesentlich begünstigt. Die
Arbeitsmarktdynamik wird nach den Szenarioergebnissen
aber deutlich zunehmen, und damit auch die Zugänge
in Arbeitslosigkeit. Wenn sich der strukturelle und
berufliche Wandel verstärkt, wird eine Weiter- und
Neuqualifizierungsberatung essenziell.
                                                                                                 Freigabe:
                                                                Enzo Weber: Industrie 4.0 - Wirkungen auf Wirtschaft und Arbeitsmarkt, in:
Möglichst frühzeitig muss fundiert entschieden werden,
                                                                 Wirtschaftsdienst, 95. Jg. (2015), H. 11, S. 722-723, © ZBW und Springer-
ob eine Vermittlung im bisherigen Tätigkeitsfeld,
                                                               Verlag Berlin Heidelberg, http://www.wirtschaftsdienst.eu/archiv/jahr/2015/11/
eine Weiterentwicklung oder Neuorientierung der
                                                                         industrie-40-wirkungen-auf-wirtschaft-und-arbeitsmarkt/.
richtige Weg ist. Weitere Bereiche wie der Arbeits-
10 CAHIER SCIENTIFIQUE | REVUE TECHNIQUE LUXEMBOURGEOISE 1 | 2016

Hochwasser hervorgerufen durch natürliche Ursachen wie Schneeschmelze oder durch bauliche Maßnahmen wie
Flussbegradigung verursacht häufig eine Flutkatastrophe mit verheerenden Überschwemmungen. Zu den schon
katastrophalen Folgen von Hochwasser addieren sich häufig noch die Schäden von gefährlichem Treibgut, das mit
den Fluten mitgerissen wird und unter Umständen über weite Strecken transportiert wird. Mitgerissenes Treibgut
kann zur Verklausung von Brücken führen oder auch Bauwerke zerstören. Um die Folgen eines Hochwassers
einschließlich Transport von Treibgut abschätzen zu können, sind numerische Werkzeuge eine adäquate Ergänzung
zu experimentellen Methoden, die oft mit einem sehr hohen Aufwand verbunden sind.

INNOVATIVE RECHNERISCHE METHODEN ZUM TRANSPORT
VON TREIBGUT BEI HOCHWASSER_
Prof. Dr. - Ing. Bernhard Peters, Gabriele Pozzetti, Yu Liao

_Abb. 1: Ausgangskonfiguration mit drei verschiedenen Partikelagglomerationen, wobei die rechte              Rechenmethoden der Computational Fluid Dynamik (CFD)
Partikelfraktion leichter als Wasser ist und die Dichte der beiden verbleibenden Fraktionen größer als die
von Wasser ist. Durch einen simulierten Dammbruch wird die hinter dem Damm aufgestaute Wassermenge           bestimmt wird.
augenblicklich freigesetzt.
                                                                                                             Treibgut wird diskret betrachtet, in dem es mit der
                                                                                                             Diskreten Element Methode (DEM) beschrieben wird.
                                     Deshalb wird im vorliegenden Beitrag eine neue und                      Damit kann sowohl jedes einzelne Element des Treibgutes
                                     innovative numerischer Ansatz vorgestellt, der den Transport            berücksichtigt werden als auch seine Eigenschaften wie
                                     von Treibgut bei Hochwasser aber auch bei Normalwasser                  Größe, Form und Gewicht. Innerhalb dieses Ansatzes
                                     beschreibt. Dazu werden die beiden numerischen Methoden                 können die Kontaktkräfte zwischen den einzelnen
                                     beruhend auf einem diskreten und kontinuierlichem Ansatz                Elementen des Treibgutes berechnet werden, mit denen
                                     gekoppelt. Letzterer beinhaltet die Euler Methoden, mit                 sich Geschwindigkeit, Position und Orientierung des
                                     denen die Strömung des Wassers im Rahmen von bewährten                  Treibgutes bestimmen lassen. Zusätzlich wird über eine
CAHIER SCIENTIFIQUE | REVUE TECHNIQUE LUXEMBOURGEOISE 1 | 2016 11
Kopplung zur fluiden Phase der Einfluss sowohl der Treibgut berechnet, um den hybriden Ansatz an einfachen
Wassergeschwindigkeit als des Auftriebs mit berücksichtigt. Geometrien zu verifizieren. Im weiteren Verlauf des Projektes
Der Transport von Treibgut bei Hochwasser ist eine durch werden reale Geometrien für Treibgut betrachtet, die über ein
Schwerkraft dominierte Bewegung, wobei allerdings der Oberflächengitter wie beispielsweise im STL-Format dargestellt
Wasseranteil weit grösser ist als bei Muren. Murgänge werden. Dementsprechend wurde für erste Rechnungen 3
sind eine Mischung aus Sand, Schlamm, Ton, Kies, Geröll, Partikelagglomerationen mit verschiedener Dichte wie in Abb.
Wasser und anderen Substanzen, die sich unter dem 1 dargestellt.
Einfluss der Schwerkraft bewegen.
Dabei wurde dem rechten Agglomerat eine Dichte leichter als
In der Regel kosten sowohl Hochwasser mit Treibgut Wasser zugewiesen, so dass diese Partikel ähnlich dem Treibgut
und Muren zahlreiche Menschenleben und verursachen auf Wasser aufschwimmen und an der Wasseroberfläche
enorme Schäden, wobei die Zerstörungskraft von Muren transportiert werden. Die mittlere Partikelfraktion ist schwerer
meistens grösser als die von Überschwemmungen ist. als Wasser und setzen sich als Sediment am Grund ab
Entscheidend für den Grad der Zerstörung von Muren und werden entsprechend der Wechselwirkung mit der
ist die Wechselwirkung der Feststoffe untereinander und Grundwasserströmung transportiert. Die rechte Fraktion
Wasser. Deshalb ist es von entscheidender Bedeutung die enthält Partikel die sowohl schwerer als auch leichter als Wasser
Wechselwirkung zwischen Wasser und den Feststoffen sind, so dass ein Teil absinken wird während die verbleibenden
zu verstehen, um die Wirkung zu erfassen und aber auch Partikel auf der Wasseroberfläche aufschwimmen.
die mechanische Festigkeit von Schutzmaßnahmen zu
Um dem Wasser eine ähnlich hohe Dynamik wie bei
bestimmen.
Überschwemmungen zu geben, wurde eine Dammbruch
Experimentelle Untersuchungen sind nur schwierig simuliert, der augenblicklich die hinter dem Damm
durchführbar, da die Installation von Messgeräten sehr zurückgehaltene Wassermenge freisetzt (Abb. 1).
schwierig ist, auch wegen ihrer mechanischen Festigkeit.
Die Bewegung des Wassers wird durch die Position der freien
Trotzdem sind experimentelle Messdaten verfügbar von Hu
Oberfläche und die Vektoren der Wassergeschwindigkeit
et al. (2011), Zhang (1993), Iverson (1997), Major (1996),
charakterisiert, wohingegen die Bewegung der Luft nur
und Iverson et al. (2010), die allerdings skaliert werden
durch Geschwindigkeitsvektoren repräsentiert wird wie
müssen, um auf reale Ereignisse übertragen werden zu
es in Abb. 2 gezeigt ist. Erwartungsgemäß ergeben sich
können.
an der Front des herabstürzenden Wassers die größten
Numerische Methode Geschwindigkeiten mit Werten bis zu 4 m/s. Die rechte und
Der Transport von Treibgut wir über einen hybriden leichte Partikelfraktion wird von der Frontwelle komplett
Ansatz beschrieben, für den diskrete mit kontinuierlichen erfasst und erfährt dadurch eine starke Wechselwirkung mit
Methoden gekoppelt werden. Zu diesem Zweck wird die der Strömung.
Bewegung von Treibgut mit der Discrete Element Method
Zunächst werden die Partikel von der Strömung erfasst und
(DEM) beschrieben, während die umgebende Fluidphase
auf Geschwindigkeiten bis zu 3.5 m/s beschleunigt. Dabei
bestehend aus Wasser und Luft mit den klassischen
tritt eine starke Wechselwirkung der Partikel untereinander,
Methoden der Computational Fluid Dynamics (CFD) als
hervorgerufen durch Kontaktkräfte, auf, die die Bewegung
Zweiphasenströmung beschrieben wird wie bei Tryggvason
und damit die Trajektorien der Partikel bestimmt. Da die
et al. (2011). Mit dem diskreten Ansatz für feste Objekte im
mittlere und linke Partikelfraktion teilweise schwerer als
allgemeinen werden ihre Bewegungsbahnen im Sinne der
Wasser ist, sinken die Partikel zunächst unter Einfluss der
Newtonschen Mechanik berechnet. Kräfte, die zwischen
Schwerkraft auf den Grund ab, währen die leichteren
Wasser und Treibgut wechselwirken, beinhalten im
Partikel aufgrund des Auftriebs an die Wasseroberfläche
wesentlichen Auftrieb, Widerstandskräfte, Kontaktkräfte
aufsteigen. Im hinteren Bereich des Wassers treten zu diesem
zwischen dem Treibgut und Bauwerken.
Zeitpunkt noch vernachlässigbare Wassergeschwindigkeiten
Ergebnisse auf, so dass die Partikel hauptsächlich unter dem Einfluss
Mit dem oben beschriebenen hybriden Ansatz wurde in von Schwerkraft und Auftrieb stehen und die horizontalen
einem ersten Schritt die Bewegung von kugelförmigen Geschwindigkeitskomponenten vernachlässigbar sind.12 CAHIER SCIENTIFIQUE | REVUE TECHNIQUE LUXEMBOURGEOISE 1 | 2016
_Abb. 3: Darstellung der Strömungsverhältnisse für Wasser und Luft _Abb. 4: Darstellung der Strömungsverhältnisse für Wasser und Luft
zusammen mit den Partikelgeschwindigkeiten zum Zeitpunkt 1.2 s. Beim zusammen mit den Partikelgeschwindigkeiten zum Zeitpunkt 3.0 s.
Auftreffen der Frontwelle auf die Wand werden sowohl die Strömung Durch das Zurückschwappen der Frontwelle wird die Wasseroberfläche
des Wassers nach oben abgelenkt als auch die Partikel stark beschleunigt, stark deformiert und reißt einige Partikel mit sich. Schwere Partikel
sodass sie teilweise der Wassergeschwindigkeit folgen. Die hinteren als Sediment abgesetzt werden durch die Grundströmung nur mäßig
Partikelfraktionen sinken weiterhin unter dem Einfluss der Schwerkraft auf bewegt, während im hinteren Bereich aufschwimmende Partikel durch
den Grund. die turbulente Strömung mitgerissen werden.
Die folgende Abb. 3 zeigt den Aufprall der Frontwelle
auf die gegenüberliegende Wand, wobei eine starke
Wechselwirkung zwischen Wand, Wasser und
Partikeln auftritt, die als 4-Weg-Kopplung folgende
Wechselwirkungen enthält:
1. Partikel-Partikel
2. Partikel-Wand
3. Partikel-Wasser
4. Wasser-Partikel (Wand)
und sowohl die Strömung des Wassers als auch die
Bewegung der Partikel beeinflusst. Für die hinteren
Partikelfraktionen ist immer noch die Schwerkraft die
dominierende Kraft, so dass sie weiterhin auf den Grund _Abb. 5: Darstellung der Strömungsverhältnisse für Wasser und
sinken. Nur die mittlere Partikelfraktion zeigt bereits eine Luft zusammen mit den Partikelgeschwindigkeiten zum Zeitpunkt
Wechselwirkung mit dem Wasser, so dass bereitsauf den 5.2 s. Durch den Aufprall der Welle an der rechten Wand wird die
Grund abgesunkene Partikel teilweise mit der Strömung Wasseroberfläche wiederum stark deformiert und aufschwimmende
Partikel werden mitgerissen. Auf den Grund abgesunkene Partikel
mit bewegt werden und Sedimenttransport repräsentiert. werden nur mäßig bewegt.
Zusammenfassung
In diesem Beitrag wurde eine Methode vorgestellt, mit
der der Transport von Treibgut auf Wasseroberflächen
beschrieben werden kann. Dazu wurde eine hybride
Methode entwickelt, die die kontinuierlichen Methoden
der klassischen Computational Fluid Dynamics (CFD)
mit der Discrete Element Method (DEM) koppelt. Dabei
wird das Treibgut bestehend aus einzelnen Objekten
beschrieben, auf die Wasser- Kontakt-, Auftriebs- und
Schwerkräfte wirken. Damit kann die Bewegung und
die Trajektorien der Treibgutobjekte im Rahmen eines
Lagrange-Ansatzes bestimmt werden. Die Strömung
des Wassers wird als Zweiphasenströmung mit frier
Oberfläche repräsentiert. Mit der numerischen Methode
_Abb. 2: Darstellung der Strömungsverhältnisse für Wasser und Luft wurden erste Verifizierungsrechnungen durchgeführt,
zusammen mit den Partikelgeschwindigkeiten zum Zeitpunkt 0.65 s.
Während die vordere Partikelfraktion durch das herabstürzende Wasser die sowohl den Transport von Partikeln an der
auf Geschwindigkeiten bis zu 3.5 m/s beschleunigt werden, sinken die Wasseroberfläche als die Bewegung von schwereren
hinteren Partikelfraktionen unter dem Einfluss der Schwerkraft und Partikeln auf dem Grund beschreiben.
vernachlässigbarer Wassergeschwindigkeiten auf den Grund.
Literatur
Die beiden folgenden Abb. 4 und 5 zeigen das Hu, K., Wei, F., and Li, Y. (2011): Real-time measurement and
Rückschwappen der Welle, hervorgerufen durch preliminary anal- ysis of debris-flow impact force at Jiangjia Ravine,
China., Earth Surface Processes and Landforms, 36(9), 12681278.
den Aufprall auf die Wand. Dadurch tritt ein starker doi:10.1002/esp.2155, 2011.
Rückströmungseffekt auf, dem die Partikel wegen ihrer Iverson, R. M. (1997): The physics of debris flows., Reviews of
Trägheit mit einer Zeitverzögerung folgen. Zusätzlich ist Geophysics, 35(97), 245. doi:10.1029/97RG00426, 1997.
die Wasseroberfläche nach der Reflektion an der Wand Iverson, R. M., Logan, M., LaHusen, R. G., and Berti, M. (2010):
stark deformiert, wodurch einige Oberflächenpartikel The perfect debris flow? Aggregated results from 28 large-scale
mitgerissen werden und der turbulenten Strömung folgen. experiments. Journal of Geophysical Research, 115(F3), F03005.
doi:10.1029/2009JF001514, 2010.
Die rechte Partikelfraktion hat sich bereits zu diesem Major, J. J. (1996): Experimental studies of deposition by debris
Zeitpunkt entmischt, so dass schwere Partikel auf den flows: process, characteristics of deposits, and effects of pore-fluid
Grund abgesunken sind und die Leichteren auf der pressure. PhD, Washington, 1996.
Wasseroberfläche aufschwimmen. Da bereits auch schon Major, J. J. and Iverson, R. M. (1999): Debris-flow deposition: Effects
im hinteren Teil merkliche Wassergeschwindigkeiten of pore-uid pressure and friction concentrated at flow margins.
Bulletin of the Geological Society of America, 111(10), 14241434.
auftreten, werden die leichteren Partikel an der Oberfläche doi:10.1130/0016- 7606(1999)1112.3.CO 1999.
bereits mit gerissen. Tryggvason, G., Scardovelli, R., Zaleski, S. (2011): Direct numerical
simulations of gas-liquid multiphase flows, Cambridge University
Die mittlere Partikelfraktion, allesamt bestehend aus Press, 2011.
schwereren Partikeln, sind auf den Grund abgesunken und Zhang S. A. (1993): Comprehensive approach to the observation
werden ähnlich einem Sediment mit der Grundströmung and prevention of debris flows in China., Natural Hazards 7:123,
1993.
bewegt.Special thanks to Oleksii and Noémie, uni.lu students © University of Luxembourg
Multilingual. Personalised. Connected.
Eine internationale Uni wie keine andere! Studierende aus der ganzen Welt, mehrsprachige
Studiengänge, Austauschprogramme in Europa und Übersee, Praktikamöglichkeiten
und individuelle Betreuung. Elf Bachelor- und 39 Masterstudiengänge warten auf dich!
Unsere Fakultäten
Fakultät für Naturwissenschaften, Technologie und Kommunikation | Fakultät für Rechts-,
Wirtschafts- und Finanzwissenschaften | Fakultät für Sprachwissenschaften und Literatur,
Geisteswissenschaften, Kunst und Erziehungswissenschaften
seve.infos@uni.lu | www.uni.lu | facebook.com/uni.lu14 CAHIER SCIENTIFIQUE | REVUE TECHNIQUE LUXEMBOURGEOISE 1 | 2016
The following article describes a part of the doctoral thesis realised by the doctoral student Shahriar Agaajani
and supervised by Danièle Waldmann-Diederich, head of the Laboratory of Solid Structures at the University
of Luxembourg. The research work of the thesis has been internationally awarded from the London-based
International Masonry Society for the best doctoral thesis of 2015. By end of the year 2016 the Journal Masonry
International will publish the article in its current form.
NUMERICAL ANALYSIS FOR THE DETERMINATION OF STRESS
PERCOLATION IN DRY-STACKED WALL SYSTEMS_
S. Agaajani(1), D. Waldmann(2), F. Scholzen(2), A. Louge(3)
(1) Civil Engineer, PhD, Asars Constructions sarl, Luxembourg City, 1637 Luxembourg
(2) Professors, Faculty of Sciences, Technology and Communication, University of Luxembourg, Luxembourg City, 1359 Luxembourg
(3) Mechanical Engineer, PhD, Luxembourg
Abstract the improvement of dry-stacked structures is pursued
This paper comprises a portion of a PhD study concluding on by further analysis of the results obtained through the
the potential use of a new mortarless and modular masonry algorithm.
system by taking into consideration the outcome of a
This paper represents a new tool for investigating the
multidisciplinary study including aspects of experimental,
localized and randomly defined internal stress distribution
numerical and analytical investigations in relation to a
induced by external compression forces on dry-stacked
practical and economical development of modular load-
structures. Furthermore, the algorithm illustrates that
bearing dry-stacked masonry systems. Different forms
experimental investigations on dry-stacked systems may
of interlocking masonry elements have been modelled
only give real indications on the load capacity of the
and optimised thermo-mechanically. Full-scale masonry
structure, when the number of joint interfaces and height
walls were assembled and tested experimentally under
to length ratio of the block is respected and that results of
compressive, flexural, shear, cyclic and long term loads. The
experimental investigations on reduced prism specimens
overall structural behaviour was compared to conventional
may not be extrapolated to full sized walls as they may
masonry systems such as hollow and shuttering blocks.
over-evaluate the effective loaded masonry sections and
The investigations showed overall relative high structural
therefore the overall load capacity. Keywords: masonry,
performances for the developed dry-stacked elements.
dry-stacked, load percolation and intensity, strength,
The effect of dry joint interfaces was extensively investigated mortarless contact, modular block, load-bearing wall.
experimentally and numerically under FE analysis. Based
Notations:
on the experimental observations, a numeric-analytical
h block or wall height
failure mechanism of the dry-stacked masonry structure is
µ mean value
anticipated under axial and flexural loading. The structural
σ standard deviation
investigations and engineering processes are completed by
[H] matrix H
the development of a package of dry-stacked units consisting
hblock block height
of interlocking modular masonries and an accompanying
randperm(p) returns a random value of
array of various other precast parts. This confirmed the
the integers 1 to p
practical issues and solutions towards the exploitation of
[B]full and [B]half individual full or half
the developed dry-stacked elements for the construction of
blocks
ready-to-build, modular and load-bearing walls.
Nij node i,j
The portion of work presented herein proposes a new [W] matrix W
numerical technique for the determination of stress- α alpha
percolation in dry stacked load-bearing structures. The L length of wall
model is developed in three steps under a numerical Aeff,i effective loaded area
computing environment. First, based on geometrical Aeff,i at a given row i
properties of the dry-stacked elements and with a linear- ki reduction factor in row i
elastic material behaviour, the load percolation and intensity Anom,i nominal contact area in
in dry-stacked masonry walls is determined. In a second row i
1_ Founded in 1986, The International step, a phenomenon known as a plastic accommodation n number of cases
Masonry Society has a membership from
throughout the world and an international
which accompanies the redistribution of the stress kmin minimal reduction factor
reputation in the field of masonry literature, percolations, is incorporated in the model. This enables the kmin,env. minimal envelope
the dissemination of research and current
thinking. There are currently members in 31 understanding of the evolution of the stress percolations in Δhwall height difference in
countries, including those from Africa, Asia,
Europe, both North and South America,
the post-elastic phase, which is crucial for the determination structures
Canada, Australia and New Zealand. The of the load capacity and stability of the structure in function Introduction
objectives of the International Masonry
Society are to promote discussion and of an increased external load. This paper also supports The understanding of structural behaviour of dry-stacked
advancement of the science and practice
of masonry as allied to its constituent
the better understanding of early fissuring in dry-stacked masonry systems implies defining load percolation,
materials, and to all aspects of the design masonry structures which has an important influence on effective contact area at joint interface and determining
and use of masonry and the construction
process. the overall stability of the structure. Finally, in a third step, the resulting stresses in the critical wall sections.CAHIER SCIENTIFIQUE | REVUE TECHNIQUE LUXEMBOURGEOISE 1 | 2016 15
On the other hand, the production tolerances of dry- Past observations on load-bearing and dry-stacked masonry
stacked masonry elements imply dimensional inaccuracies walls tried to analyse on how a dry-stacked masonry system
which have a substantial impact on the load-capacity respond to external loads. Although many experimental
and failure mode of the constructed walls. The effect of investigations have been undertaken in order to better
individual block height on stress percolation is investigated understand the behaviour of these systems (Oh K., 1994)
by developing a new technique in a numerical computing (Marzahn & König, 2002) (Drysdale, 2005) the load percolation
environment. This numerical investigation gives the within the walls have not been fully explained.
relationship between the effective contact areas in a
Transmission photoelasticity on stretcher-bond scale models
dry-stacked masonry wall in function of the production
have been experimented, reproducing the load percolation
tolerances and demonstrates that the contact area at the
of a locally applied vertical compressive force in photoelastic
joint interface is under certain circumstances significantly
materials such as Plexiglas® (Bigoni, 2009). The results reveal
lower than previously estimated. As a consequence, the
localized, curvilinear stress percolations which do not diffuse
better perception of the load percolation and intensity
as they would in a reinforced concrete system, but tend
enables the development of post-elastic failure theories
to percolate along high stiffness lines. Yet, a post-elastic
and masonry-shape improvement.
approach such as cracking and its resulting consequences is
Load percolation in dry-stacked structures not suggested.
As the mortared layers between the consecutive rows in
This topic remains crucial for the understanding of stress
a dry-stacked system are missing, the individual blocks
distribution and intensity and is deepened within this
must have exactly the same height for a uniform load
research work by the development of a specific algorithm.
distribution and transfer between the elements (Figure 1).
The developed algorithm is based, in a first step, on a linear
approach and thus no cracking of the elements is considered.
In a second step, a post-elastic phase is considered by a deeper
analysis of the sections with the highest stress concentrations.
Numerical setup and computing
By measuring the individual height of randomly selected
blocks with a precision of 0.01 mm, a frequency distribution
may be obtained in function of the height of the blocks
(Figure 2), which may serve as an example to illustrate the
geometrical imperfections. Although the distribution is
slightly left-tailed (Table 1), the normal bell curve may be
applied, and on account for its simplicity, we may use it as a
first approximation:
Eq. 1
Where the parameter h is the measured block height, µ is the
mean value and σ the standard deviation of the distribution.
Table 1
Statistical parameters (in mm) due to geometric imperfections
in block production.
Blocks with different heights (Equation 2) are chosen randomly
(Equation 3) and stacked one by one until the desired height
and length of the structure [W] is achieved (Equation 6 and
Figure 4).
Eq. 2
_Fig. 1: Dry-stacked masonry (Agaajani et al., 2015)
As a matter of fact, this ideal case is in reality not possible
because of the production tolerances and dimensional
inaccuracies, which induce a block-height distribution as The matrix [H] contains the empirical height measurements
pointed out in Figure 2. These geometrical imperfections less than three standard deviations σ away from the mean
induce localized and almost unique internal stress value µ. For the discrete probability density function (Equation
distributions induced by external loads within the dry- 1) this accounts for 99.7% of the set. The randomly dry-
stacked masonry wall. stacked blocks are chosen by:
Essentially the height differences between adjacent Eq. 3
masonry elements, and marginally the variation of width
Where hblock is the block height and [H] is a column matrix;
of successive masonry rows for the block design shown in
randperm returns a random value of the integers 1 to p,
Figure 1, have an impact on the load-capacity and failure
where p is the size of the matrix [H].
mode of the constructed walls.
Individual full blocks [B]full are modelled by 8 nodes (Equation
4), whereas the half blocks [B]half are modelled by only 4
nodes (Equation 5). The height difference between the upper
and lower nodes is defined by Equation 3.
_Fig. 3: Definition of nodes of full and half masonry elements
Eq. 3
_Fig. 2: Normal distribution (black) and frequency (blue) of masonry
height distribution of manufactured elements (Agaajani et al., 2015) Eq. 416 CAHIER SCIENTIFIQUE | REVUE TECHNIQUE LUXEMBOURGEOISE 1 | 2016
The “dry-stacking” of the masonry elements is implemented
by incorporating the individual full and half masonry
elements [B]i,j in a global matrix [W], which contains all
the elements. The matrix [W], or wall, is constructed by
placing the first row of elements on a perfectly horizontal
line (corresponding to a mortared ground layer), and by
placing the following rows in stretcher bond, for example.
The ends of the structure are held laterally, which prohibits
the rotation of the individual blocks. The load is applied
uniformly on the upper and lower end (Figure 4), while the _Fig. 6: Influence of reduced block height on load transmission in dry-
dead load weight is omitted. stacked wall systems
Eq. 6 Load percolation in dry-stacked structures
Numerical simulations with randomly selected height
values for every individual block show characteristic
patterns of load distribution and transfer between the
block elements in the structure. While the load is uniformly
applied on the extremities of the wall, the effective area
Load percolation and intensity
acting in the load transmission varies from row to row and
Figure 4 shows the example of a two-row wall structure
decreases significantly to a minimum at the first basis rows
of 2.5m length made of blocks with height variations
(Figure 7 and 8).
corresponding to the frequency distribution of Table 1.
There are as many load percolations as stacking possibilities
The height difference between adjacent blocks is arbitrarily
of randomly chosen blocks. Thus, we may state that the
magnified for visualisation purposes (factor of 10). The load
load percolation between each row is determined by a
transmission from one row to another depends on the
probabilistic state which is a function of the geometric
contact interfaces between the elements. The local rotation
properties of the used block population. Generally, the load
of the elements is not permitted and the horizontal gap
distribution varies throughout the height of the structure
between the elements is supposed to prohibit horizontal
and is percolated through tree-like ramifications to the
load transfer. Thus, it is assumed that forces percolate only
base, where only a small fraction of the total wall section
vertically through the masonry rows.
is exploited. Noted that the obtained load percolations do
not take into consideration stress intensities.
_Fig. 4: Randomly chosen blocks with different heights and dry-stacked with stretcher bond
The gap between two adjacent blocks causes the disruption
of the uniform load percolation which can be transmitted
through the contact interface. As a consequence, the load
is channelled through neighbouring contact interfaces,
resulting in higher stress concentrations.
In Figure 5 two 2.5 x 2.5 meter wall structures are mounted _Fig. 7: Load percolation in wall structures of 2.50m height and L =
with blocks of exactly the same height, except one. In this 1.00m length
first analysis, the block located in the middle of the lowest
row is slightly higher than its neighbours. In the second case,
the block with the higher height is located in the middle of
the structure.
In both cases, the block with the largest height tends
to channel the load transmission by an angle α (angle
taken from the vertical line of the load) above its location,
which reduces the effective loaded area and induces high
concentrations of stresses. It redistributes the load by the
angle α, which may be given by: _Fig. 8: Load percolation in wall structures of 2.50m height and L =
2.00m length
The above mentioned observations make analogy to
numerical analysis and research of granular structures
(Radjai, 1996) (Breton & Jussien), where the load
transmissions through the more rigid structure is preferred
and where curvilinear compressive stress lines occur
(Figure 9).
_Fig. 5: Visualisation of load-transmission in a dry-stacked wall structure using the above mentioned
algorithm _Fig. 9: Analogy to granular structuresCAHIER SCIENTIFIQUE | REVUE TECHNIQUE LUXEMBOURGEOISE 1 | 2016 17
Linear Finite Element analysis’ have been modelled (Figure The reduction factor ki may be estimated by calculations
10) in order to validate the stress percolation in dry-stacked based on statistical dispersions and geometric properties of
structures obtained through the developed algorithm. The individual block elements:
results show virtually identical tree-like stress percolations,
Eq. 9
although the FEA may slightly better represent the stress
diffusion in the different rows of the structure. However,
the main added value through the FEA, which are also
Where n is the total number of analysed cases c in order to
time expensive (pre-and and post-processing included),
obtain an average value based on statistical dispersions and
is the visualisation and determination of the developed
load percolations, for a given structure of height h and length l.
stress intensity in the critical sections.
Figure 10 shows that for an external vertical load of 1 The existence of a minimal effective contact area Aeff,min,wall is
MN/m² applied uniformly on each face-shell of the dry- determined analytically in every dry-stacked structure and is
stacked wall (Figure 1), the principal stress in the critical defined by the geometrical properties of the individual block
section of the structure may be 30 times higher than elements and of the entire structure:
the least compressed sections (Agaajani et al., 2015).
Eq. 10
This additional numerical observation gives an inside in
where initial cracking may occur and how the dry-stacked
structures evolve in the post-elastic phase.
Where, Lblock and hblock are the length, respectively the height
of a single block, L and h are the length, respectively height of
the entire dry-stacked structure.
_Fig. 10: Stress percolation and intensity seen in a dry-stacked structure
through FE Analysis (l.), compared to stress percolation obtained
through the developed algorithm (r.)
In Figure 11, where the length of the structure is a multiple
of its height L > h, characteristic load distribution patterns
are distinguished in comparison to the above mentioned _Fig. 12: Example of effective area calculation for the determination of the
structures (where h > L). stress state in the dry-stacked masonry
The global load transmission is improved, as the lower
As a result, locally concentrated forces cause premature
sections in the wall structure are better solicited through
cracking in the dry-stacked masonry elements and reduce the
additional curvilinear compressive stress curves, or load
overall elastic behaviour and load-bearing capacities of the
percolations. Half-blocks are, if under compression,
wall.
always entirely under compression, while full blocks are
often only partially under compression. This observation In Figure 13 the statistically determined evolution of the
elucidates why, in the running bond system, most of the reduction coefficient of the loaded area, for a 2.50m high
full blocks and none of the half blocks were cracked on structure and varying lengths is shown. This reduction
the load-bearing face shells during experimental loadings coefficient retraces for each row the relation between the
(Agaajani et al., 2015). effective loaded area due to imperfections and the theoretic
global total area depending on different wall lengths (from
L=0.25m to L=12m). The minimum envelope, the heavy black
line (Equation 11), representing an endless length of the wall
shows a drastic reduction of the loaded area in the lower part
of the masonry structure (reduction of 80-90% at the four
lowest courses of the masonry). The test results of Jaafar et
al. (2006), where large differences in normal displacements
at joint interfaces were measured at different locations, show
during experiments the same behaviour: the crushing at joint
interface was higher in the lower rows than the upper ones.
_Fig. 11: Vertical load transfer and distribution in a wall structure
of ~2.50m height and L = 12.00m length, with amplified standard
deviation of 0.02m in height of randomly selected blocs (Agaajani et
al., 2015)
Characteristic load intensities based on linear elastic
behaviour
The effective loaded area Aeff,i at a given row i in the
masonry structure (Figure 12) is given by the relation:
_Fig. 13: Evolution of the reduction coefficient of loaded surface area
Eq. 8
The statistically determined minimum reduction factor kmin_
where ki is a reduction factor of the loaded area at the env is numerically approached by non-linear curve fitting and
contact interface between the rows i and i+1 due to the represented by the Equation 11:
height differences between adjacent masonry elements, Eq. 11
and Anom,i the nominal loaded area between the rows i
and i+1.18 CAHIER SCIENTIFIQUE | REVUE TECHNIQUE LUXEMBOURGEOISE 1 | 2016
The column-wall dry-stacked with half blocks (L=0.25m) load is then gradually increased, in order to initiate the
does not have any adjacent neighbouring blocks with damage or cracking of the critical section (Figure 15, left
different heights, and keeps therefore a reduction side). Due to the cracking of the critical element in the
coefficient equal to 1 all over the height of the wall. For critical section, the concerned block is split in two parts,
running-bonded structures of L = 0.50m and more, the inducing a redistribution of stress percolation in the dry-
distribution frequency (Figure 2) plays an important role and stacked system which is illustrated in the right side of
the reduction coefficient is drastically decreased in function Figure 15.
of a growing length of the wall and position of the contact
interface in the structure (Figure 13). For any h/L ratio, the
poorest contact interface between the dry-stacked rows is
reached on the interfaces of the lowest rows. This is a very
important observation as it may demonstrate where initial
cracking may occur. Furthermore, Figure 13 is obtained for
a fixed height of 2.50m and variable length of dry-stacked
system. Additional simulations for alternative wall heights
shall give more details about the reduction coefficient ki.
_Fig. 15: Comparison between initial stress distribution (left) and new
Deviation of global height in dry-stacked structures stress distribution after cracking of the critical section #1 (right)
The random and non-linear difference in wall height
By further increasing the intensity of the applied vertical
between a dry-stacked structure, where all block elements
force, the next possible critical section is subjected to
have the same height, and a structure composed of blocks
damage (Figure 15, right), and again, a new load and stress
with a given standard deviation of their height corresponding
distribution is initiated as a result of this rearrangement of
to the actual production series (Table 1 and Equation 1), is
dry-stacked blocks in the dry-stacked wall (Figure 16, left).
analytically given by the relation (12):
The rearrangement of the blocks and their involving stress
redistribution is pursued with the increase of the applied
load (Figure 16, right).
In the particular case (standard deviation of 1.2 mm), a
desired structure of 2.50 m height would be statistically ~13
mm higher (~0.5%).
Post-elastic phases in dry-stacked masonry systems
According to the previous observations, the understanding
of stress distribution within dry-stacked masonry walls is
found to be complex. The load distribution between the
dry-stacked rows is being dominated by randomness and _Fig. 16: Comparison between initial stress distribution (left) and new
tree-like geometrical schemes with even analogy to granular stress distribution after cracking of the critical section #3 (right)
medium (Figure 9). Stress percolation is highly localized in
In contrast to traditional masonry wall constructions,
the lower rows, highlighting stress streams in contrast to
where damage initiation only appears close to the
unloaded areas in the dry-stacked masonry walls. The
ultimate load and is thus a sign of reaching the load
evolution of these structures in the post-elastic phase with
bearing capacity, the dry-stacked systems enter, due to
the associated stress and crack development are crucial for
cracking, rather a state of a more homogenous stress
the determination of the load capacity and stability of these
distribution with enhanced load percolations due to
structures.
increased effective contact areas at joint interfaces (Figure
The analysis of block height distribution may enable the 17, left). The stability of the damaged dry-stacked wall is
understanding of load distribution and intensity of load also enhanced compared to the un-cracked situation, in
transfer at contact interfaces of dry-stacked masonry spite of the cracked block elements, as the stress streams
structures. According to experiments carried out at the are more uniformly distributed and unloaded areas are
University of Luxembourg (Agaajani et al., 2015), a 1.0m diminished. This phenomenon is known as a plastic
large and 2.5m high dry-stacked wall is modelled in accommodation which accompanies the redistribution of
stretcher-bond (Figure 13) and a uniform load is applied the stress percolations.
at the top of the structure. It is again supposed that the
If the load is continuously increased, without consideration
lateral edges of the structure are pinned, which prohibits
to the slenderness of the wall, all the full elements
the rotation of the individual blocks. In the analysis the load
may be divided in two half blocks, transforming the
is applied uniformly at the top and bottom of the structure
stretcher-bond system in a stack-bond system where
while the dead load weight is neglected.
the masonry elements are aligned vertically. The wall
would be transformed into individual pillars (Figure 16,
right), implying the highest rate of effective contact area
between adjacent rows in the dry-stacked system. Due to
a possible lateral mechanical interlocking of the adjacent
masonry elements, the different pillars may not fully be
independent.
_Fig. 14: Numerical modelling of a 1.0 x 2.5m dry-stacked wall (height
differences between adjacent elements exaggerated for visualisation
purposes)
_Fig. 17: Comparison between stress distribution #5 (left) and final
An expected tree-like stress distribution pattern is observed, stress distribution #n after the cracking of all full block elements (right)
as described in the previous sections. In accordance to
The splitting of the full blocks due to cracking, starting
the reduction of the loaded surface area in function of
at the lower rows of the wall with an increasing vertical
the position of the joint interface in the dry-stacked wall
loading has systematically been observed during
structure (Figure 15), the possible location of the critical wall
experimental investigations on stretcher-bonded, dry-
section is found to be in the second row. The applied verticalSie können auch lesen