Wissenschaft in Europa: Herausforderungen und Perspektiven - Friedrich-Ebert-Stiftung
←
→
Transkription von Seiteninhalten
Wenn Ihr Browser die Seite nicht korrekt rendert, bitte, lesen Sie den Inhalt der Seite unten
Wissenschaft in Europa: Herausforderungen
            und Perspektiven

Wissenschaft hält Europa zusammen,
Konferenz am 28. November 2017,
Friedrich-Ebert-Stiftung, Berlin

        DG RTD, Unit A4                            Wolfgang Burtscher,
                              stv. Generaldirektor der Generaldirektion
                Forschung und Innovation der Europäischen Kommission
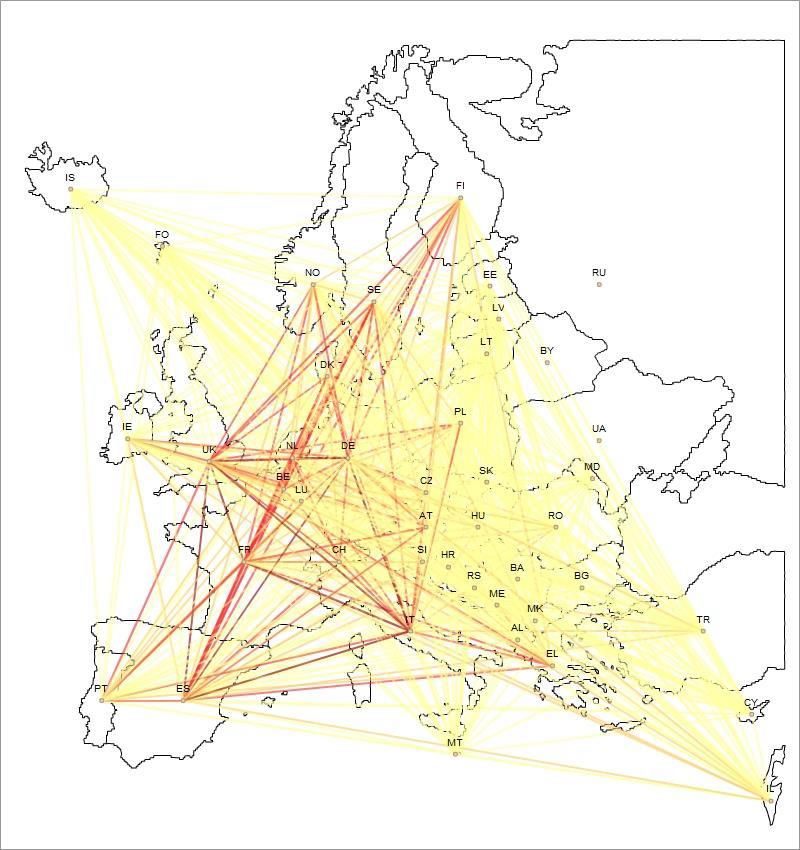
Kooperationen durch das Forschungsrahmenprogramm
       als Beitrag zum Zusammenhalt Europas
DIE EUROPÄISCHE
FORSCHUNGSLANDSCHAFT
    IM WELTWEITEN
       VERGLEICH
Große gesellschaftliche Herausforderungen
erfordern innovative, wissensbasierte Lösungen

        Bevölkerung     +
        +50% by 2050

                        Nahrungsmittel
                             +70% by 2050

      +                                     -
        Energie                   Klima
        +100% by 2050
                              +2o by 2050

                         -
R&I schafft Wachstum durch Steigerung der Produktivität

  Source: DG Research and Innovation – Economic Analysis unit
  Data: (1) Multi-factor productivity (OECD): Dan Andrews & Chiara
  Criscuolo, 2013. "Knowledge-Based Capital, Innovation and Resource
  Allocation",
  OECD Economics Department Workinh Paper 1046, OECD Publishing
Europa ist im weltweiten Vergleich immer
                  noch eine wissenschaftliche "Großmacht"
  World R&D expenditure - % distribution(1), 2015                                                                             World share of highly cited scientific publications, 2014

Source: DG Research and Innovation - Unit for the Analysis and Monitoring of National Research and Innovation Policies        Source: DG Research and Innovation - Unit for the Analysis and Monitoring of National Research and Innovation Policies
Data: Eurostat, OECD, UNESCO                                                                                                  Data: CWTS based on Web of Science database
Notes: (1)The % shares were calculated from estimated values for total GERD in current PPS€. (2)Japan+South Korea+Singapore   Note: (1) Fractional counting method. (2) Citation window: publication year plus two years.
+Chinese Taipei. (3)Brazil+Russian Federation+India+South Africa.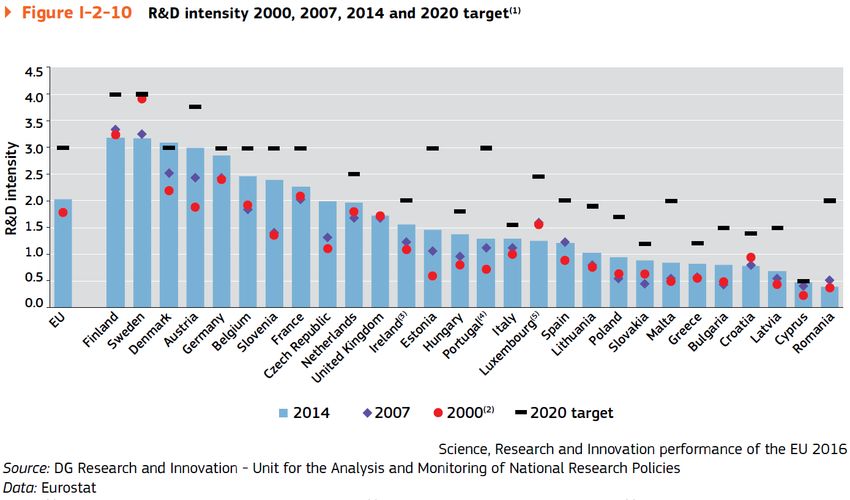
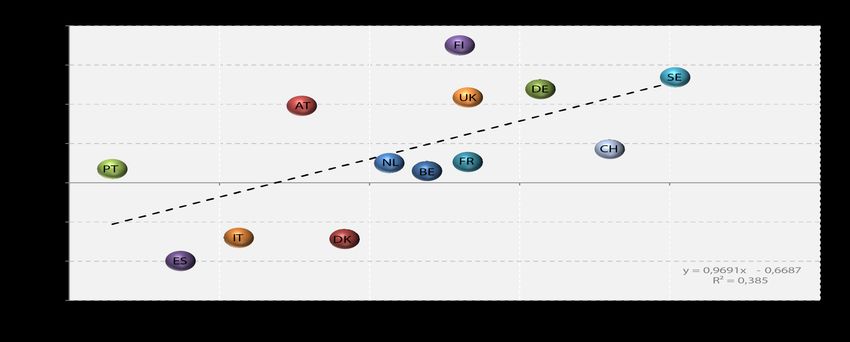
…aber Europa investiert zu wenig in R&I
                     Figure I.3-A.1 World expenditure on R&D - % distribution(1), 2000 and 2015
                             2000                                                             2015

                    Rest of the                                                        Rest of the
                      World                                                              World
            BRIS(3)    9%                                                                 9%
                                                                                                       EU
             6%                                                              BRIS(3)                  20%
       China                                EU                                8%
        5%                                 25%

          Developed                                                        China
            Asian                                                           21%                           United
          Econom ies                                                                                      States
               (2)
                                                                                                           27%
              18%
                                  United                                                 Developed
                                  States                                                   Asian
                                   37%                                                   Econom ies
                                                                                              (2)

                                                                                             15%

                                                                 Science, Research and Innovation performance of the EU 2018
Source: DG Research and Innovation - Unit for the Analysis and Monitoring of National Research and Innovation Policies
Data: Eurostat, OECD, UNESCO
      (1)                                                                                   (2)
Notes: The % shares were calculated from estimated values for total GERD in current PPS€. Japan+South Korea+Singapore
                 (3)
+Chinese Taipei. Brazil+Russian Federation+India+South Africa.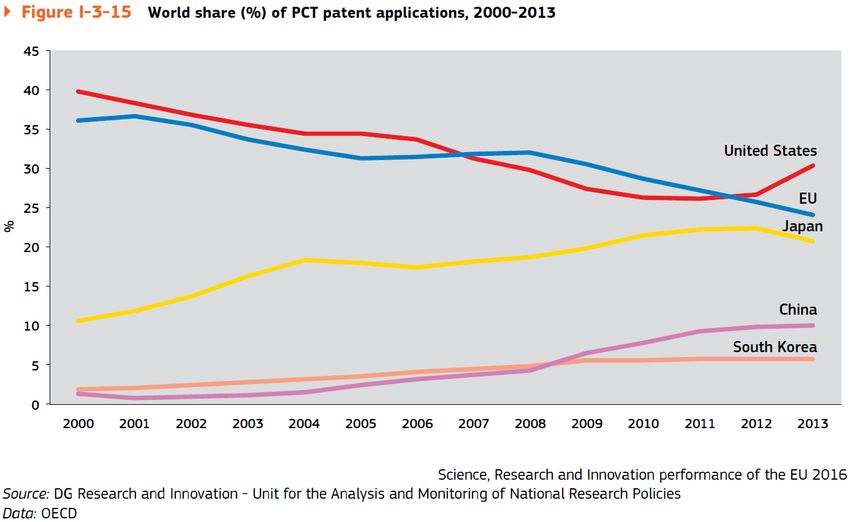
…aber Europa investiert zu wenig in R&I
                                         Figure I.3-A.3 Evolution of R&D intensity, 2000-2015
                   4,5
                                                                                                                        South Korea (1)

                   4,0

                   3,5                                                                                                       Japan(2)

                   3,0
   R&D intensity

                                                                                                                     United States (3)

                   2,5
                                                                                                                              China(4)
                   2,0
                                                                                                                                   EU

                   1,5

                   1,0

                   0,5
                         2000   2001   2002   2003   2004   2005   2006   2007   2008   2009   2010   2011   2012   2013   2014   2015

                                                                 Science, Research and Innovation performance of the EU 2018
  Source: DG Research and Innovation - Unit for the Analysis and Monitoring of National Research and Innovation Policies
  Data: Eurostat, OECD
  Notes: (1) KR: There is a break in series between 2007 and the previous years. (2) JP: There is a break in series between 2008
  and the previous years and between 2013 and the previous years. (3) US: (i) R&D expenditure does not include most or all
  capital expenditure; (ii) There is a break in series between 2003 and the previous years. (4) CN: There is a break in series
  between 2009 and the previous years.
Forschungs- und Innovationsausgaben in EU sind heterogen
und liegen unter dem 3% ZielDas Problem sind die geringeren
.
Forschungsausgaben von Unternehmen
Figure I.3-A.9 World business enterprise expenditure on R&D - % distribution (1), 2000 and 2015
2000 2015
BRIS(3) Rest of the Rest of the
4% World
World 7%
6% BRIS(3)
5%
China EU
4% 19%
EU
25%
Developed
China
Asian
24%
Econom ies
(2)
United
19% States
28%
United
Developed
States
Asian
42%
Econom ies
(2)
17%
Science, Research and Innovation performance of the EU 2018
Source: DG Research and Innovation - Unit for the Analysis and Monitoring of National Research and Innovation Policies
Data: Eurostat, OECD, UNESCO
Notes: (1) The % shares were calculated from estimated values for total BERD in current PPS€. (2) Japan+South Korea+Singapore
+Chinese Taipei. (3) Brazil+Russian Federation+India+South Africa.Das Problem sind die geringeren
Forschungsausgaben von Unternehmen
Figure I.3-A.10 Evolution of business R&D intensity, 2000-2015
3,5
South Korea(1)
3,0
Japan
Business R&D intensity
2,5
United States (2)
2,0
China(3)
1,5
EU
1,0
0,5
2000 2001 2002 2003 2004 2005 2006 2007 2008 2009 2010 2011 2012 2013 2014 2015
Source: DG Research and Innovation - Unit for the Analysis and Monitoring of National Research and Innovation Policies
Data: Eurostat, OECD
Notes: (1) KR: There is a break in series between 2007 and the previous years. (2) US: Business enterprise expenditure on
R&D (BERD) does not contain most or all capital expenditure. (3) CN: There is a break in series between 2009 and the
previous years.Der EU-Anteil an den weltweiten
Patentanträgen fälltEU-Innovationskapazität in einigen Zukunftstechnologien ist begrenzt Source: DG Research and Innovation - Unit for the Analysis and Monitoring of National Research and Innovation Policies Data: OECD Science, Technology and Industry Scoreboard 2015; OECD calculations based on IPO (2014), Eight Great Technologies: the Patent Landscapes, United Kingdom and STI Micro-data Lab: Intellectual Property Database, http://oe.cd/ipstats, June 2015
… und begrenzt damit Europas Fähigkeiten im
Bereich des transformativem Unternehmertums…

   Source: DG Research and Innovation - Unit for the Analysis and Monitoring of National Research and Innovation Policies
   Data: CBInsights, Eurostat
   Note: (1) Population data refers to 2016

   Distribution of the total valuation of private unicorns (%),
                         as of July 2017

                     8%
                2%
                                                 United States
                                                 European Union

                                     51%         China
         33%                                                         Source: DG Research and Innovation - Unit for the Analysis and Monitoring of
                                                 South Korea         National Research and Innovation Policies
                                                 Others              Data: CBInsights
                                                                     Note: (1) Data includes only the valuations of private unicorns, hence excluding
                     6%                                              exited unicorns through IPOs or acquired by other companies
Andere Faktoren sind unzureichende Wettbewerbsrahmenbedingungen…
… und begrenzter Zugang zu Risikokapital
Entwicklung des Weltinlandproduktes
MAßNAHMEN AUF
       EUROPÄISCHER EBENE

• Verwirklichung des Europäischen
  Forschungsraumes

• Forschungs-und Innovations-
  rahmenprogramm Horizon 2020

                 Policy
                  Research and
                  Innovation
Europäischer Forschungsraum - Prioritäten
• Effektivere nationale Forschungssysteme
• Optimale länderübergreifende Zusammenarbeit und
entsprechender Wettbewerb
• Offener Arbeitsmarkt für Forscherinnen und Forscher
• Gleichstellung der Geschlechter und Berücksichtigung des
Gleichstellungsaspekts in der Forschung,
• optimaler Austausch und Transfer von sowie Zugang zu
wissenschaftlichen Erkenntnissen (Open Science)
• Internationalisierung des Europäischen Forschungsraums.
Policy
Research and
InnovationDas Europäische Rahmenprogramm für
Forschung und Innovation –Horizon 2020
• Fokussierung auf Massnahmen mit europäischem Mehrwert im
Vergleich zu Massnahmen auf Ebene der Mitgliedstaaten
• Schwerpunkt auf grenz-, themen, und
sektorenübergreifenden kooperativen
Forschungsprojekten
• Exzellenz der Projekte als Ergebnis eines
europaweiten Wettbewerbs
• Synergien von Ressourcen und Wissen (z.B.
Forschungsinfrastrukturen)
• Breiter Wissenstransfer und grössere Märkte für
uptake.
• Ziel ist nahtlose Unterstützung von Forschung und Innovation
zur Lösung der grossen gesellschaftlichen Herausforderungen
und um Wachstum und Arbeitsplätze zu schaffen.Horizont 2020 definiert drei Schwerpunkte
1. Wissenschaftsexzellenz (€ 24 440 Mrd)
- ERC (Europäischer Forschungsrat) €13 182
- Future and Emerging Technologies € 3 087
- Marie Sklodowska Curie € 5 710
- Europäische Forschungsinfrastrukturen € 2 460
2. Führende Rolle der Industrie (€ 17 820 Mrd)
- Schlüsseltechnologien: €13 557
- Zugang zu Risikokapital: € 2 842
- Innovation in KMUs: € 616
3. Gesellschaftliche Herausforderungen (€ 31 547 Mrd)
- Gesundheit € 7 472
- Nahrungsmittel € 3 851
- Energie € 5 931
- Transport € 6 339
- Klima € 3 081
- Gesellschaft € 1 309
- Sicherheit € 1 695Horizont 2020 – Stand der Umsetzung 143, 786 Förderanträge eingereicht (EUR 399 billion) 16,211 Förderanträge mit 68,299 Teilnehmern sind mit EUR 30 Mrd gefördert worden; Erfolgsquote bezogen auf die Anträge liegt bei ca.12%, bezogen auf die Projekte über der Förderschwelle bei etwa 25%. Teilnahme der Wirtschaft hat im Vergleich zum 7.RP zugenommen und liegt bei 33.32% bezogen auf die Teilnehmer und bei 28.04% bezogen aufs Budget. Die Teilnahme von KMUs liegt bei 27.27% bzw 24.39% bezogen auf die Schwerpunkte 2 und 3.
Beteiligung der Mitgliedstaaten
Beteiligung der Mitgliedstaaten
                      Unique Participants from a Country   Participations from a Country   EU Financial Contribution for Participants from a Country
         Country                     No.                       No.                     %                   euro                                %
AT - Austria                                        545              1.797        2,82%                        734.709.918                2,76%
BE - Belgium                                        854              2.884        4,53%                      1.284.274.671                4,82%
BG - Bulgaria                                       174                315        0,49%                         51.640.702                0,19%
CY - Cyprus                                         101                325        0,51%                         88.177.345                0,33%
CZ - Czech Republic                                 246                684        1,07%                        177.330.038                0,67%
DE - Germany                                      2.316              8.074       12,68%                      4.390.827.121               16,47%
DK - Denmark                                        418              1.505        2,36%                        656.413.069                2,46%
EE - Estonia                                        128                306        0,48%                         82.220.667                0,31%
EL - Greece                                         479              1.861        2,92%                        571.582.528                2,14%
ES - Spain                                        2.123              6.595       10,36%                      2.394.896.570                8,98%
FI - Finland                                        398              1.311        2,06%                        582.830.705                2,19%
FR - France                                       1.644              5.770        9,06%                      2.774.994.753               10,41%
HR - Croatia                                        127                270        0,42%                         42.204.486                0,16%
HU - Hungary                                        252                589        0,92%                        168.011.182                0,63%
IE - Ireland                                        301              1.068        1,68%                        463.379.299                1,74%
IT - Italy                                        1.994              6.033        9,47%                      2.177.164.918                8,17%
LT - Lithuania                                       97                228        0,36%                         32.354.157                0,12%
LU - Luxembourg                                      81                215        0,34%                         67.460.292                0,25%
LV - Latvia                                          82                190        0,30%                         41.062.333                0,15%
MT - Malta                                           38                 98        0,15%                         16.898.043                0,06%
NL - Netherlands                                  1.125              4.054        6,37%                      2.036.405.424                7,64%
PL - Poland                                         448              1.030        1,62%                        241.651.697                0,91%
PT - Portugal                                       446              1.373        2,16%                        427.762.914                1,60%
RO - Romania                                        275                575        0,90%                         93.434.993                0,35%
SE - Sweden                                         595              1.998        3,14%                        932.024.824                3,50%
SI - Slovenia                                       225                564        0,89%                        157.276.533                0,59%
SK - Slovakia                                       136                287        0,45%                         74.270.742                0,28%
UK - United Kingdom                               1.896              8.056       12,65%                      3.974.481.742               14,91%
                                                 17.544             58.055       91,16%                     24.735.741.667               92,80%
Wissenschaftliche Zwischenergebnisse • Horizont 2020 Veröffentlichungen werden durchschnittlich zweimal so oft zitiert wie herkömmliche Publikationen • 7% der Publikationen im Rahmen von ERC- Forschungsprojekten sind unter den Top-1% der weltweit am meisten zitierten Publikationen, während sich der Durchschnitt europäischer Publikationen auf 1.7% beläuft.
HORIZON 2020
ZWISCHENBEWERTUNG
       UND
FP9 –VORBEREITUNG
TOWARDS FP9:
Key findings from the H2020 INTERIM EVALUATION
KEY STRENGTHS
An attractive, simplified and well-performing
programme, highly relevant for stakeholders and societal
needs.
€ On track to deliver value for money and to meet its
knowledge-creating objectives.
Strong EU Added Value through unique opportunities,
competition & access to new knowledge.
28
Research and innovationTOWARDS FP9:
Key findings from the H2020 INTERIM EVALUATION
KEY AREAS FOR IMPROVEMENT
Underfunding
Has lower success rates than FP7, esp. for high quality
proposals.
Support for market-creating innovation
Demonstrates potential for breakthrough, market-creating
innovation, but it should be strengthened substantially.
Greater outreach to civil society
Should better explain the impacts of R&I, and involve even
more the users & citizens in agenda-setting & implementation.
29
Research and innovationTOWARDS FP9
"I am convinced that the core
values of Horizon 2020 and its
successor have to be:"
EXCELLENCE OPENNESS IMPACT
30
Research and innovationSchlüsselfragen für FP9
•Budget
•Aufteilung der Mittel auf Förderschwerpunkte
•Impact und "Missions"
•Unterstützung von Innovation
•Formen der Partnerschaften
•Spreading excellence/widening
•Internationale Zusammenarbeit
31TOWARDS FP9
INDICATIVE TIMELINE
2017
Jan Public stakeholder consultation for the interim evaluation (with some forward looking questions) closed on 15
January
May Publication of the Staff Working Document on the Interim Evaluation
June Assessment of Horizon 2020 implementation in view of its interim evaluation and the Framework Programme 9
proposal by the European Parliament (EP);
ERAC Opinion on the interim evaluation of H2020 and in view of the preparations of the next FP
July Publication of High Level Group report and stakeholder conference on Horizon 2020 Interim Evaluation (3 July)
Informal Competitiveness Council, Tallinn
Q4 • H2020 Work Programme 2018-2020 integrating main findings from the Interim Evaluation
• Publication of Commission Communication on Interim Evaluation of Horizon 2020
2018
Mid Next MFF Commission proposal
Commission proposal tabled for the next Framework Programme & accompanying Impact Assessment
2019
European Parliament elections, appointment of the new Commission
2021
Launch of the 9th Framework Programme
32
Research and innovationSie können auch lesen