Standort Niederrhein Marktbericht 2020/2021 Niederrhein Region Market Report 2020/2021
←
→
Transkription von Seiteninhalten
Wenn Ihr Browser die Seite nicht korrekt rendert, bitte, lesen Sie den Inhalt der Seite unten

In Zusammenarbeit mit:

Standort Niederrhein
Marktbericht 2020/2021
Niederrhein Region
Market Report 2020/2021

Kreis Kleve | Krefeld | Mönchengladbach | Rhein-Kreis Neuss | Kreis Viersen | Kreis Wesel
Auf der hinteren Umschlagseite         On the unfoldable back page
finden Sie Vergleichsdaten des         you will find comparative data
Standort Niederrhein zum Ausklappen.   of the Niederrhein Region.
In Zusammenarbeit mit:

Standort Niederrhein
Marktbericht 2020/2021
Niederrhein Region
Market Report 2020/2021

Kreis Kleve   |   Krefeld   |   Mönchengladbach   |   Rhein-Kreis Neuss   |   Kreis Viersen   |   Kreis Wesel

                                                                                                           3
Bertram Gaiser
Geschäftsführer
Managing Director
gaiser@standort-niederrhein.de
www.invest-in-niederrhein.de
4Vorwort
Preface
Mit dem aktualisierten Standort Niederrhein With the new edition of the Niederrhein
Marktbericht 2020/2021 erhalten Investo- Region Market Report 2020/2021, investors,
ren, Marktteilnehmer, Eigennutzer und Mieter market participants, end users and tenants
aktualisierte Grundlagen für sichere und rich- get updated facts for correct and proper
tige (Immobilien-) Entscheidungen. Dieser ist in (property) decisions. The edition has again
erneuter Zusammenarbeit mit den Analysten been created in cooperation with the analysts
der bulwiengesa AG entstanden. from bulwiengesa AG.
Die vorliegenden Informationen zeigen ein- The information provided once again shows:
mal mehr: Der Niederrhein steht für ein ver- The Niederrhein Region stands for reliable
lässliches Entwicklungspotenzial, das über development potential, which can be raised
die Jahre hinweg kontinuierlich gehoben wer- continually over the years. Investors from the
den kann. Investoren aus ganz Deutschland whole of Germany and from abroad utilise the
und dem Ausland nutzen die Renditevorzüge advantageous rates of return of a market that
eines Marktes, der nicht der Volatilität und does not display the volatility and inflation
Teuerungsrate eines A-Standortes ausgesetzt rate of an A-location – but which lies in direct
ist – aber in unmittelbarer räumlicher Nach- proximity to such A-locations.
barschaft zu diesen liegt.
Today more than ever, the region is making a
Die Region trägt heute mehr denn je einen significant contribution to the Metropolregion
erheblichen Teil dazu bei, dass die Metropol- Rheinland with its almost 9 million people, so
region Rheinland mit ihren knapp 9 Millionen that it is an investment-friendly market for
Menschen ein investitionsfreundlicher Markt entrepreneurs, investors and property devel-
für Unternehmer, Investoren und Immobilien- opers.
entwickler ist.
5Inhaltsverzeichnis
Table of Contents
Allgemeine Daten General figures A 7
Beschäftigte Employees B 15
Büro Office C 19
Logistik Logistics D 23
Wohnen Residential E 27
Teilräume Subregions F 33
Anhang Appendix G 59
Kontakt, Impressum Contact, Imprint 60
Tabellarische Zusammenfassung Tabular summary 62
Quellenangaben List of sources U3
Daten: Data:
Stand 2019, soweit nicht As of 2019, unless
anders vermerkt. stated differently.
6A
Allgemeine Daten
General figures
Sechs Teilräume bilden den Standort Nieder- Six subregions make up the Niederrhein R egion:
rhein: die beiden kreisfreien Städte Krefeld the two cities of Krefeld and Mönchengladbach
und Mönchengladbach sowie die Kreise Kleve, and the four districts Kleve, Viersen, Wesel and
Viersen, Wesel und der Rhein-Kreis Neuss. the Rhein-Kreis Neuss. A good two million peo-
Hier leben gut zwei Millionen Menschen. In ple live here. More than 650,000 employees
etwa 120.000 Unternehmen arbeiten mehr work in approximately 120,000 companies. The
als 650.000 Beschäftigte. Charakterisierende characteristic industries are chemistry, mechan-
Branchen sind Chemie, Maschinenbau, Logis- ical engineering, logistics, energy, agribusiness,
tik, Energie, Agribusiness, Elektrotechnik, Tex- electrical engineering, textiles and clothing, plus
til und Bekleidung, dazu Tourismus. Das Fun- tourism. Mid-sized companies that are keen to
dament bilden exportfreudige Mittelständler export ( export quota > 50 % ) are the backbone
( Exportquote > 50 % ). Der Standort Niederrhein of these industries. The Niederrhein Region is
ist auch ein Zuhause für die Welt: Rund 10 % also home to the world: Around 10 % of the
der Unternehmen sind ausländische Direkt- companies are foreign direct investments, in-
investments, darunter Weltkonzerne mit ihren cluding global corporations with their German or
Deutschland- oder Europa-Zentralen. European headquarters.
7Auf einen Blick
At a glance
€ 63.000.000.000+
Bruttowertschöpfung Gross value added
> 50 %
Exportquote
Export quota
120.000+
Unternehmen Companies
1.000+ ha
Verfügbare Flächen
Plots available
2.000.000+
Einwohner Inhabitants
8
Rheinhäfen Rhine ports
16.000.000
Konsumenten im Umkreis von 100 km
650.000+
Conumers within a radius of 100 km
Beschäftigte Employees
ca.
350 km
Autobahnstrecke
Autobahn length
89
2.020.909
                                                                  Einwohner
                                                                  Inhabitants

Einwohner
Inhabitants
 1.972.092   1.972.742   1.979.149   2.005.828   2.005.634   2.007.394   2.009.199   2.020.909

                                                                                                 2.020.000

                                                                                                 2.000.000

                                                                                                 1.980.000

                                                                                                 1.960.000

     2012       2013        2014        2015        2016        2017        2018        2019

10
Leitbranchen
Key industries
Agribusiness Chemie
Agribusiness Chemistry
Elektrotechnik Energie
Electrical Engineering Energy
Logistik Maschinenbau
Logistics Mechanical Engineering
Textil Tourismus
Textile Tourism
11Bedeutende Arbeitgeber
Major employers
Teilraum Unternehmen Branche Besch. vor Ort Besch. gesamt
Subregion Companies Sector Employees local Employees total
Kreis Kleve Landgard eG Handel 2.000 3.500
CHEFS CULINAR West
Handel 800 1.300
GmbH & Co. KG
bofrost* Dienstleistungs
Industrie 680 9.890
GmbH & Co. KG
Omexon Uedem Industrie 600 3.300
Katjes Fassin GmbH + Co. KG Nahrungsmittel 430 678
Krefeld Helios Kliniken Krefeld Gesundheit 2.800 71.000
Siemens Mobility
Industrie 2.400 24.800
Standort Krefeld
LanXess Chemie 1.700 15.500
Siempelkamp-Gruppe Industrie 1.300 3.000
Fressnapf Tiernahrung 1.100 12.000
Mönchengladbach Santander Consumer Bank Bank 2.900 48.000
Kliniken Maria Hilf Gesundheit 2.500 2.500
Zalando Handel 2.000 8.000
Scheidt & Bachmann
Industrie 1.580 2.000
(mit Tochtergesellschaften)
SMS Meer Industrie 1.480 14.000
Rhein-Kreis Neuss Hydro Aluminium Deutschland
Industrie 4.000 4.900
(inkl. Alu Norf)
3M Deutschland Industrie 1.900 6.800
Covestro AG Pharma 1.400 20.000
RWE AG Energie 1.400 20.000
UPS Deutschland Logistik 1.300 17.200
Kreis Viersen Schwarzkopf-Henkel Chemie 600 48.000
Abbelen Nahrungsmittel 500 500
Mars Nahrungsmittel 400 k. A.
SAB Bröckskes Industrie 400 500
Saint Gobain Industrie 400 190.000
Kreis Wesel amazon.de GmbH Logistik 2.000 k. A.
ALTANA / Byk Chemie Chemie 900 5.700
Lemken Agribusiness 900 1.100
Solvay Chemicals Chemie 800 29.400
Trox Industrie 700 3.650
12100,6
Zentralität
index of centrality – retail
100,3
Kaufkraftindex ( D = 100 ) 448 – 620
Purchasing power index ( D = 100 ) Grundsteuer B
Real estate tax B
417 – 490
ca. 10 %
Gewerbesteuer Hebesatz
Trade tax multiplier
46+6+5429R
46
Anteil ausländischer Unternehmen
Percentage of foreign companies
1.250
772 Niederlande
Andere Netherlands
Other
Zahl ausländischer
Unternehmen im
Handelsregister*
109
Großchina**
Greater China**
2.693
Number of foreign
companies registered in
commercial register*
109
Belgien
Belgium
130 160 163
Großbritannien USA Schweiz
Great Britain USA Switzerland
* Stand 2014 As of 2014 ** China, Hongkong, Macau, Taiwan 13Bedeutende Gewerbegebiete
Major commercial zones
Teilraum Gewerbegebiet Verfügbare Fläche
Subregion Companies Plots available
Kreis Kleve Virtueller Gewerbeflächenpool 1.600.000 m2
Airport Weeze 1.300.000 m2
Gewerbepark Weeze-Goch 470.000 m2
Industriegebiete "Hammerscher Hof" 50.000 m2
Gewerbegebiet "Pannofen West", Geldern 33.000 m2
Krefeld Businesspark Fichtenhainer Allee 200.000 m2
Gewerbegebiet am Südpark 20.000 m2
Mönchengladbach Nordpark – Business Park II 70.000 m2
Gewerbegebiet Rheindahlen 38.000 m2
Gewerbegebiet Mülforter/Duvenstraße 7.000 m2
Güdderath 3.000 m2
Rhein-Kreis Neuss „Interkommunales Gewerbegebiet Grevenbroich/Rommerskirchen“ 120.000 m2
Gewerbepark Kaarster Kreuz 100.000 m2
Gewerbegebiet Kapellen 40.000 m2
Gewerbegebiet Kaarst-Ost 37.000 m2
Gewerbepark Rommerskirchen 20.000 m2
Kreis Viersen Gewerbepark Nettetal-West, Nettetal 777.000 m2
Mackenstein-Nord, Viersen 100.000 m2
Münchheide IV, Willich 27.000 m2
Kreis Wesel Delta Port, Wesel und Voerde 524.000 m2
Interkommunaler Gewerbepark Genend, Moers und Neukirchen-
95.000 m2
Vluyn
Industrie- und Gewerbepark Hünxe 50.000 m2
Gewerbegebiet Birten, Xanten 40.000 m2
Industriepark Babcock, Voerde 33.000 m2
14B
Beschäftigte
Employees
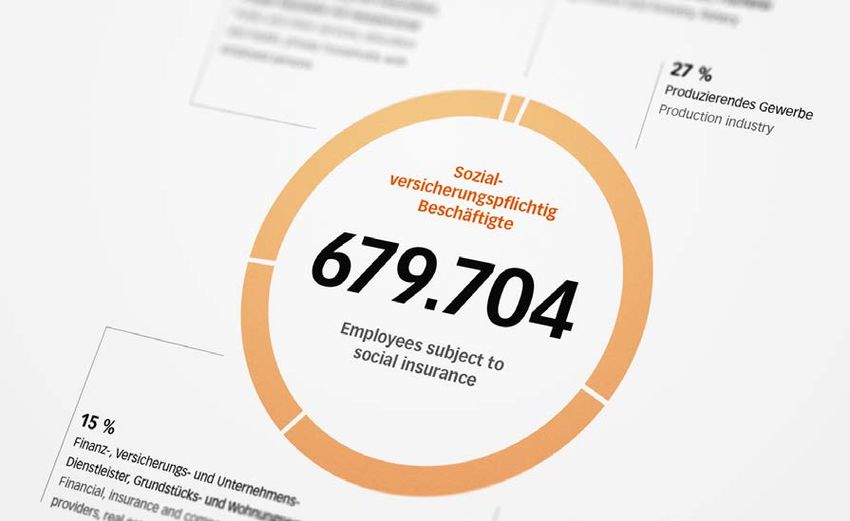
Die Zahl der sozialversicherungspflichtig Be- In the Niederrhein Region, the number of
schäftigten ist am Standort Niederrhein inner- employees subject to social security contri-
halb der letzten zehn Jahre um fast 115.000 butions has risen over the last ten years by
auf 679.704 gestiegen. Ähnlich positiv hat almost 115,000 to 679,704. Similarly posi-
sich die Bruttowertschöpfung pro Erwerbs- tive, the gross value added per employee has
tätigem auf derzeit € 65.404,– entwickelt. Die grown to € 65,404 in this time. The commut-
Pendlerströme am Standort Niederrhein unter er flows in the Niederrhein Region underline
streichen dessen Doppelqualifikation: einer- this double qualification: on the one hand, a
seits ein robuster, weil über mehrere Branchen robust location with sustainable jobs support-
gestützter Standort für zukunftsfeste Arbeits- ed by many industries, into which employees
plätze, zu denen Beschäftigte von außerhalb commute from elsewhere; on the other hand,
einpendeln; andererseits ein mit hoher Lebens a residential location that possesses a high
qualität ausgestatteter Wohnort, von dem aus quality of life, out of which employees com-
Beschäftigte insbesondere nach Düsseldorf, mute, especially to Düsseldorf, Cologne and
Köln und das Ruhrgebiet auspendeln. the Ruhr area.
152%
2+29281526R
Land- und Forstwirtschaft, Fischerei
28 % Agriculture and forestry, fishery
Öffentliche und sonstige Dienst
leistungen, Erziehung und Gesundheit,
Private Haushalte mit Hauspersonal 27 %
Public and other services, education Produzierendes Gewerbe
and health, private households with Production industry
employed persons
Sozial-
versicherungspflichtig
Beschäftigte
679.704
Employees subject to
social insurance
15 % 28 %
Finanz-, Versicherungs- und Unternehmens- Handel, Verkehr und
Dienstleister, Grundstücks- und Wohnungswesen Lagerei, Gastgewerbe, IuK
Financial, insurance and company service Trade, transportation and
providers, real estate activities storage, hospitality industry,
information and communication
Sozialversicherungspflichtig Beschäftigte
Employees subject to social insurance
+ 21 % 679.704
562.156
2010 2019
1665.404 €
Bruttowertschöpfung pro Erwerbstätigem*
Gross value added per employee*
58.742 59.329 60.835 61.524 62.838 64.201 64.405**
64.405 65.404**
65.404
64.000
60.000
56.000
2012 2013 2014 2015 2016 2017 2018* 2019*
Arbeitslosenquote Ø / Jahr
Rate of unemployment Ø / year
8,7 % 9,1 % 9,1 % 8,7 % 8,4 % 8,1 % 7,1 % 6,6 %
12
8
4
2012 2013 2014 2015 2016 2017 2018 2019
* Prognose Prediction 17Pendlerströme
Commuter flow 157.527
Einpendler
Inbound commuters
interne
Pendlerströme*
121.113
internal commuter
flow*
*N
ur Pendler zwischen kreisfreien
Städten und Kreisen; Pendler
bewegungen innerhalb der Kreise
wurden nicht berücksichtigt.
Commuter flow only between
administratively independent
cities and districts; inner-district
commuter flow not considered. 234.450
Auspendler
Outbound commuters
18C
Büro
Office
Am Standort Niederrhein ist die Zahl der Büro- In the Niederrhein Region, the number of of-
beschäftigten innerhalb der letzten zehn fice workers has risen continually by almost
Jahre kontinuierlich um fast 11 % auf mehr 11 % over the past ten years to more than
als 278.000 gestiegen. Dass die Bürobe- 278,000. The fact that the office employment
schäftigtenquote weiterhin nahezu konstant rate remains almost constant at 33 %, makes
bei 33 % liegt, verdeutlicht, dass ein breiter it clear that the region’s economic growth
Branchenmix in der Region das stabile Fun- covers a broad mix of sectors. The availabili-
dament des Wirtschaftswachstums bildet. ty of office space has also grown continually
Der Büroflächenb estand ist ebenfalls konti- to 6.35 million m2 as of now. The top rental
nuierlich gewachsen auf nunmehr 6,35 Millio- rates have risen to € 13.30 – positive from
nen m2. Die Spitzenmieten sind – aus Eigen- an owner’s perspective – but reach nowhere
tümersicht positiv – auf € 13,30 gestiegen, near the level of the neighbouring metropolis-
erreichen jedoch – aus Mietersicht positiv – es of Düsseldorf and C ologne – positive from
bei w eitem nicht das Niveau der Nachbar a tenant’s point of view.
metropolen Düsseldorf und Köln.
19Bürobeschäftigte
Office employees
256.990 260.045 262.453 265.323 268.129 272.770 276.052 278.246*
280.000
260.000
240.000
2012 2013 2014 2015 2016 2017 2018 2019*
34+66+R
34
SVP-Bürobeschäftigte
Office employees subject
to social insurance
Anteil sozial
versicherungspflichtig
Bürobeschäftigte*
33,0 %
Percentage office
employees subject to
social insurance*
Übrige SVP-Beschäftigte
Other employees subject
to social insurance
20 * Prognose PredictionBüroflächenbestand In 1.000 m2 MF/G*
Office space stock In 1,000 m2 MF/G*
6.123 6.151 6.172 6.217 6.237 6.268 6.312 6.350
6.300
6.200
6.100
2012 2013 2014 2015 2016 2017 2018 2019
Büroflächenumsatz In 1.000 m2 MF/G
Office space take-up In 1,000 m2 MF/G
65,4 94,3 88,3 67,0 47,5 72,0 56,0 48,4
90
70
50
2012 2013 2014 2015 2016 2017 2018 2019
* Mietfläche für gewerblichen Raum Rental space for commercial space 21In m2 MF/G
Fertigstellungen Büro In m2 MF/G
Office space completions
78.200*
22.400
2020*
2019
Büro Spitzenmiete In € / m2 MF/G
Office space prime rent In € / m2 MF/G
11,80 12,10 12,10 12,30 12,60 12,70 13,00 13,30
13
12
11
2012 2013 2014 2015 2016 2017 2018 2019
22 * Prognose PredictionD
Logistik
Logistics
Zentral innerhalb Europas gelegen und ver- Located centrally within Europe and exception-
kehrlich hervorragend multimodal angebun- ally well connected for multimodal traffic, with
den, spielt der Standort Niederrhein im Bereich respect to logistics property, the Niederrhein
Logistikimmobilien in der Champions League. Region plays in the Champions League. From A
Von A wie Amazon bis Z wie Zalando sind nicht for Amazon to Z for Zalando, it is not just the big
nur die großen Online-Händler präsent, sondern online retailers that have a presence, but also
auch Unternehmen wie Aldi und Esprit, Betrei- companies such as Aldi and Esprit, operators
ber wie Goodman und Prologis sowie Dienst- like Goodman and Prologis and service provid-
leister wie DHL und UPS. Entsprechend hat sich ers such as DHL and UPS. Accordingly, the logis-
der Anteil der Logistik-Beschäftigen auf 12,3 % tics companies’ share of employees subject to
der sozialversicherungspflichtig Beschäftigten social security contributions has risen to 12.3 %.
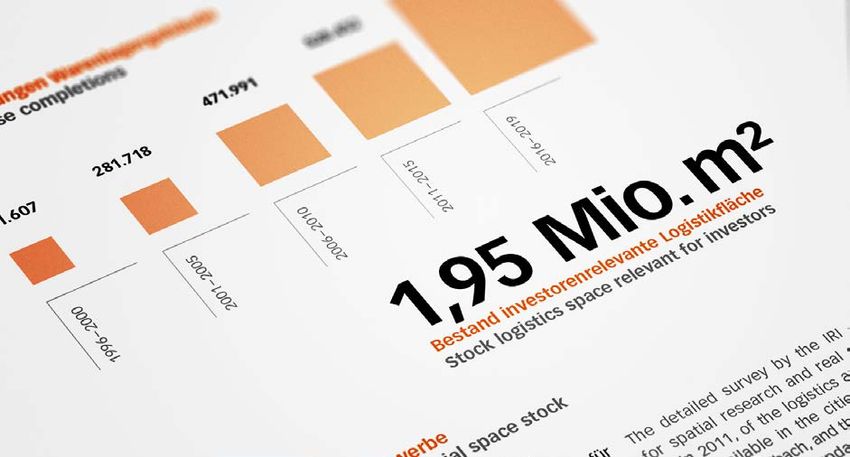
erhöht. Auch das Flächenwachstum hält an: The growth in space also continues: In the four
Allein in den vier Jahren von 2016 – 2019 ist years from 2016 – 2019 alone, almost twice as
fast doppelt so viel neue Logistikfläche ent- much new logistics space has been created as
standen wie in den fünf Jahren zuvor. in the previous five years.
2383.492
12+88+R
12
Sozialversicherungspflichtig Beschäftigte Logistik*
Logistics employees subject to social insurance*
SVP-Beschäftigte
Logistik
Logistics employees
Anteil sozial
subject to social
versicherungspflichtig
insurance
Beschäftigte Logistik*
12,3 %
Percentage logistics
Übrige SVP-Beschäftigte
employees subject to
Other employees subject
social insurance*
to social insurance
Sozialversicherungspflichtig Beschäftigte Logistik*
Logistics employees subject to social insurance*
66.708 69.279 70.895 74.650 77.746 80.495 81.178 83.492
80.000
70.000
60.000
2012 2013 2014 2015 2016 2017 2018 2019
24 * Berufsgruppen 51 + 52 Occupational groups 51+52Bedeutende Arbeitgeber Logistik
Major employers logistics
Teilraum Unternehmen FunktionHallenfläche
Subregion Companies Function indoor
storage space
Kreis Kleve BLG LOGISTICS GROUP Internationales Distributionszentrum 80.000 m2
Fiege Logistik Stiftung & Co. KG Logistikzentrum 64.000 m2
Medline International
Europäisches Distributionszentrum 38.000 m2
Germany GmbH
VOS Logistics Goch GmbH Europäisches Distributionszentrum 20.500 m2
Elten GmbH Internationales Distributionszentrum 6.500 m2
Krefeld Asics Zentrallogistik Europa 72.000 m2
DSV Logistik Verwaltung und Logistikzentrum 70.000 m2
VGG Handels AG Logistikzentrum 70.000 m2
Bauhaus Logistik Logistikzentrum 63.000 m2
Fressnapf Tiernahrung Firmenzentrale und Zentrallogistik 60.000 m2
Mönchengladbach Zalando Distributionszentrum 134.000 m2
DHL Supply Chain
Internationales Distributionszentrum 114.000 m2
(Primark, adidas, L'Oreal)
Esprit Zentrallogistik Europa 53.000 m2
Aldi Lebensmittel-Discounter k. A. 48.000 m2
C&A Überregionales Distributionszentrum 39.000 m2
Rhein-Kreis Neuss TechnoCargo TCL Logistics Europäisches Distributionszentrum 125.000 m2
3M Zentrallager Europa 112.000 m2
Aldi Süd Regionales Distributionszentrum 41.000 m2
Spedition Kleine Firmenzentrale 40.000 m2
Dachser Regionales Distributionszentrum 32.000 m2
Kreis Viersen Wilms Tiefkühl-Service Zentrallager 25.000 m2
AZ Kempen Distributionszentrum 15.000 m2
ITC Logistic Group Distributionszentrum 12.100 m2
Hermes Logistikgruppe Distributionszentrum 10.000 m2
Bohnen Logistik Distributionszentrum Deutschland 8.000 m2
Kreis Wesel Goodman Logistikpark (Amazon) Europäisches Distributionszentrum 89.600 m2
ProLogis Konsumgüterpark Europäisches Distributionszentrum 59.300 m2
G. Elsinghorst Stahl und Technik Stahllogistikzentrum 53.300 m2
Chal Tec GmbH E-Commerce 49.800 m2
Westeuropäisches
BYK Chemie 10.800 m2
Distributionszentrum
25Fertigstellungen Warenlagergebäude In m2
860.838
Warehouse completions In m2
528.452
471.991
281.718
231.607
1996 –2000
2001 –2005
2006 –2010
2011 –2015
2016 –2019
1,95 Mio. m2
Bestand investorenrelevante Logistikfläche
Stock logistics space relevant for investors
Flächenbestand Gewerbe
Industrial and commercial space stock
Die im Jahr 2011 durch das IRI – Institut für The detailed survey by the IRI – institute
Raumforschung und Immobilienwirtschaft for spatial research and real estate indus-
durchgeführte Detailerhebung des Logistik- try in 2011, of the logistics and commercial
und Gewerbeflächenbestandes in den kreis- sites available in the cities of Krefeld and
freien Städten K refeld und Mönchengladbach Mönchengladbach, and the Rhein-Kreis N euss,
sowie im Rhein-Kreis Neuss wurde erneut fort- has again been updated. Accordingly, the
geschrieben. D emnach registriert der Rhein- Rhein-Kreis Neuss, with almost 4.5 million m2 ,
Kreis Neuss mit knapp 4,5 Millionen m2 das registered the highest amount of logistics
höchste Volumen an Logistik- und Gewerbe- and commercial space, followed by Mönchen-
flächen, gefolgt von Mönchengladbach ( knapp gladbach ( almost 3.5 million m2) and Krefeld
3,5 Millionen m2 ) und Krefeld ( knapp 3,3 Mil- (almost 3.3 million m2 ). In all three subregions,
lionen m2 ). In allen drei Teilräumen dominieren the stock is predominantly hall space. The
die Hallenflächen den Bestand. Der Bestand an stock of investment-relevant logistics proper-
investorenrelevanten Logistikimmobilien sum- ties amounts to 73 sites with approximately
miert sich auf 73 Objekte mit ca. 2 Millionen m2. 2 million m2.
26E
Wohnen
Residential
Entgegen unterschiedlichster statistischer Contrary to various statistical predictions, the
Vorhersagen steigt die tatsächliche Einwoh- actual population count in the Niederrhein
nerzahl am Standort Niederrhein seit dem R egion has been steadily increasing since
Jahr 2013 stetig an. Diese Entwicklung schlägt 2013. This growth is having a visible impact on
sich auf dem Wohnungsmarkt sichtbar nie- the residential housing market: The amount
der: So wächst der Wohnungsbestand in of housing stock is approaching the million
Richtung Millionen-Grenze, die durchschnitt- mark, average rents have risen to € 9.08 / m2,
lichen Mieten sind auf € 9,08 / m2 gestiegen, newly built homes for personal ownership
Neubau-Eigentumswohnungen kosten in der cost € 4,400 / m2 at the top. Nevertheless:
Spitze € 4.400,– / m2. Dennoch: Im Vergleich Especially compared to the neighbouring
vor allem zu den Nachbarmetropolen Düssel- metropolises of Düsseldorf and Cologne, the
dorf und Köln lässt es sich am Standort Nieder- Niederrhein Region still offers particularly
rhein noch besonders gut und vergleichsweise good and relatively affordable living. This is
preiswert wohnen. Das wissen vor allem junge specially appreciated by young families and
Familien und aktive Berufstätige zu schätzen. active professionals.
27Wohnungsbestand je Wohnungstyp 1-7: Anzahl Zimmer
Housing stock per apartment type 1–7: Number of rooms
992.317
959.145 +3% 114.279
110.042
7
+4%
7
119.553
114.485
6
6 +4%
183.372
177.302 5
+3%
5
257.044
+2% 4
252.072 4
212.860
+3% 3
3
206.334
85.002
80.055 2 +6% 2
18.855 20.207
1 +7% 1
2012 2019
28Wohnungsbestand
Housing stock
959.145 964.810 968.618 972.842 977.819 982.735 987.020 992.317
980.000
940.000
900.000
2012 2013 2014 2015 2016 2017 2018 2019
Wohnungsfertigstellungen
Housing completions
4.259 4.234 3.952 3.795 4.973 4.709 4.288 4.743
5.000
4.000
3.000
2012 2013 2014 2015 2016 2017 2018 2019
29Durchschnittlicher Wohnungsmietpreis Erstbezug In € / m2
Average housing rent new constructions In € / m2
Ø 10,50 €
Mönchengladbach
Ø 9,08 € Standort Niederrhein
Durchschnittlicher Wohnungsmietpreis Erstbezug In € / m2
Average housing rent new constructions In € / m2
6,88 7,13 7,32 7,68 8,07 8,53 8,82 9,08
9
7
5
2012 2013 2014 2015 2016 2017 2018 2019
30Durchschnittlicher Kaufpreis Eigentumswohnungen Erstbezug In € / m2
Condominium average purchasing price (new construction) In € / m2
2.071 2.175 2.308 2.525 2.692 2.883 3.167 3.254
3.200
2.800
2.400
2.000
2012 2013 2014 2015 2016 2017 2018 2019
Spitzenwerte Kaufpreis Eigentumswohnungen In € / m2
Condominium prime purchasing price In € / m2
1 3
Mönchengladbach
Neuss
Krefeld
31In €
Durchschnittlicher Kaufpreis Einfamilienhaus
In €
Single-family home average purchasing price
430.000
Standort Niederrhein
Mönchengladbach
Rhein-Kreis Neuss
Kreis Viersen
Kreis Wesel
Kreis Kleve
Krefeld
Durchschnittlicher Kaufpreis Einfamilienhaus In €
Single-family home average purchasing price In €
287.917 295.833 303.750 320.417 340.000 351.667 362.500 378.333
375.000
325.000
275.000
2012 2013 2014 2015 2016 2017 2018 2019
32F
Teilräume
Subregions
Der Standort Niederrhein – das sind die bei- The Niederrhein Region – that are the two
den kreisfreien Städte Krefeld und Mönchen- cities of Krefeld and Mönchengladbach and
gladbach sowie die vier Kreise Kleve, Viersen, the four districts of Kleve, Viersen, Wesel and
Wesel und Rhein-Kreis Neuss. Auf den folgen- the Rhein-Kreis Neuss. On the following pag-
den Seiten spezifizieren wir die vorgestell- es, we break down the key figures and data
ten Kennzahlen und Daten für diese sechs given in this market report into the six sub
Teilräume. Lernen Sie die Städte und Kreise regions. Get to know the six subregions in
zudem in Kurzportraits näher kennen. Wenn brief portraits. If you fold out the back cover
Sie die rückseitige Umschlagseite ausklappen, page, you can r elate the respective subregion
können Sie die Teilraumdaten jeweils mit den data to the data for the whole of the Nieder-
Daten für den gesamten Standort Niederrhein rhein Region.
in Bezug setzen.
33Kreis Kleve Der Kreis Kleve zeichnet sich durch eine deut- The District of Kleve is characterised by its liche Nähe zu seinen niederländischen Nach- clear proximity to its Dutch neighbours. The barn aus. Die gemeinsame Grenze ist 140 km joint border is 140 km long. More than 700 lang. Mehr als 700 Firmenchefs fühlten sich company bosses felt motivated so far to start bislang motiviert, im Kreisgebiet mit seinen up their location in the district with its 16 16 Städten und Gemeinden ihren Standort zu cities and municipalities - whether as a head realisieren – ob als Hauptsitz, als Zweitstand- office, as a second location or as another ort oder als weitere Adresse. In den letzten address. The District of Kleve has been able Jahren konnte der Kreis Kleve überzeugende to attract many new companies to the area Neuansiedlungen verbuchen. Insbesondere in in recent years. The logistics specialists have Emmerich am Rhein und in Goch haben sich made the immediate vicinity of the Autobahn die Logistiker die Autobahnnähe zu eigen their own, especially in Emmerich on the Rhine gemacht. In Straelen sieht man die Nähe zur and in Goch. In Straelen the proximity to the Autobahn wie auch zum Segment Agribusi- Autobahn as well as the agribusiness segment ness als Motor an. are considered to be an engine for growth. 34
312.465
                       Einwohner*
                       Inhabitants*

                                       8,40 €                     / m2
                                                                  / m2
                                       Durchschnittlicher Wohnungsmietpreis Erstbezug
                                       Average housing rent new constructions

                                                                     370 – 435
                                                                       Gewerbesteuerhebesatz
                                                                       Trade tax multiplier

              9,20 €
                Büro Spitzenmiete
                                      / m2 MF/G
                                      / m2 MF/G

                Office space prime rent

                                       2.825 €
                                       Durchschnittlicher Kaufpreis
                                                                         / m2
                                                                         / m2

                                       Eigentumswohnungen Erstbezug
                                       Condominium average purchasing price
                                       (new construction)

* Stand 31.12.2019 As of 31.12.2019

Kreis Kleve                                       Wirtschaftsförderung Kreis Kleve GmbH

Nassauer Allee 15–23                              Hoffmannallee 55
D-47533 Kleve                                     D-47533 Kleve
+49 2821 / 85-0                                   +49 2821 / 72 81-0
www.kreis-kleve.de                                www.wfg-kreis-kleve.de                   35
Kennzahlen Kreis Kleve
Key figures District of Kleve
Kategorie Category Thema Topic
Allgemein General Einwohner ( Stand 31.12.19 ) Inhabitants
Zentralität index of centrality – retail
Kaufkraftindex Purchasing power index
Grundsteuer B Real estate tax B
Gewerbesteuer Hebesatz Trade tax multiplier
Beschäftigte Employees SVP-Beschäftigte Employees subject to social security
Bruttowertschöpfung, absolut Gross value added
Bruttowertschöpfung pro Erwerbstätigem Gross value added per employee
Arbeitslosenquote ( Ø pro Jahr ) Rate of unemployment ( Ø per year )
Büro Office Bürobeschäftigte Office employees
Anteil Bürobeschäftigte Percentage office employees
an SVP-Beschäftigten subject to social insurance
Büroflächenbestand ( Mietfläche für
Office space stock ( in 1,000 m2 )
gewerblichen Bestand in 1.000 m2 )
Büroflächenumsatz ( Mietfläche für
Office space take-up ( in 1,000 m2 )
gewerblichen Bestand in 1.000 m2 )
Fertigstellungen ( Mietfläche für
Office space completions ( in 1,000 m2 )
gewerblichen Bestand in 1.000 m2 )
Bürospitzenmiete ( pro m2 ) Office space prime rent ( per m2 )
Logistik Logistics SVP-Beschäftigte ( Berufsgruppe 51+52 ) Employees subject to social security
Wohnen Residential Wohnungsbestand ( in 1.000 m2 ) Housing stock ( in 1,000 m2 )
Wohnungsfertigstellungen Housing completions
Mietpreis Erstbezug Wohnung ( Ø / m2 ) Housing rent new constructions ( Ø / m2 )
Kaufpreis Eigentumswohnung ( Ø / m2 ) Condominium purchasing price ( Ø / m2 )
Kaufpreis Einfamilienhaus ( Ø ) Single-family home purchaising price ( Ø )
362012 2013 2014 2015 2016 2017 2018 2019
301.977 302.698 304.963 310.337 310.329 310.329 310.974 312.465
98,3 98,8 100,6 102,1 101,8 103,5 103,4 104,5
91,8 91,4 91,2 90,8 90,5 90,1 90,3 90,6
413 – 550 423 – 550 423–550
370 – 425 370 – 435 370–435
82.520 86.473 88.520 93.980 96.046 98.138 101.465 102.703
48.991 € 50693 € 52.778 € 51.974 € 53.810 € 55.650 € 57.069 €* 58.865 €*
6% 6,5 % 6,7 % 6,6 % 6,5 % 6,2 % 5,6 % 5,2 %
36.497 37.752 38.336 38.549 38.898 39.317 39.997 40.266*
31,3 % 31,2 % 31,1 % 31 % 30,9 % 30,8 % 30,7 % 30,6 %*
700 703 703 709 709 713 713 714
2,5 3,0 6,9 2,3 3,0 2,5 0,2 0,6
0,5 2,8 0 5,6 0,0 4,2 0,7 0
k. A. 9,00 € 9,00 € 9,00 € 9,00 € 9,00 € 9,10 € 9,20 €
8.747 9.192 9.518 10.593 10.845 11.467 12.350 12.100
963 1.078 1.057 895 1.143 1.131 1096 938
6,70 € 6,90 € 7,10 € 7,50 € 7,50 € 7,80 € 8,00 € 8,40 €
1.900 € 1.975 € 2.050 € 2.300 € 2.500 € 2.600 € 2.700 € 2.825 €
240.000 € 245.000 € 242.500 € 242.500 € 265.000 € 280.000 € 290.000 € 305.000 €
* Prognose Prediction 37Krefeld Krefeld liegt im Schnittpunkt der wichtigsten Krefeld is located at the intersection of the europäischen Wirtschafts- und Wachstumsbän- most important European economic and der entlang der Rheinschiene und der sich west- growth areas along the River Rhine and the östlich erstreckenden Verbindungsachse der west-east connecting axis of the European europäischen Metropolen an den Autobahnen metropolises on the A44, A40 and A57 Auto- A44, A40 und A57. Der drittgrößte deutsche bahns. The third largest German airport is only Flughafen liegt nur 20 Minuten entfernt und er- 20 minutes away and offers connections to möglicht Verbindungen zu weltweit über 180 over 180 destinations worldwide. With direct Zielen. Mit direktem Zugang zum Rhein sind von access to the Rhine, the world ports of Rotter- Krefeld aus die Welthäfen Rotterdam, Antwer- dam, Antwerp and Hamburg can be reached pen und Hamburg per Schiff in nur einem Tag by ship in just one day from Krefeld. The city zu erreichen. Die Stadt bietet mit der Nachbar- is, with its proximity to the state capital of schaft zur Landeshauptstadt Düsseldorf ausge- Düsseldorf, an excellent location for national zeichnete Standortvoraussetzungen für national and international companies. und international agierende Unternehmen. 38
227.417
Einwohner*
Inhabitants*
8,70 € / m2
/ m2
Durchschnittlicher Wohnungsmietpreis Erstbezug
Average housing rent new constructions
126,3
Zentralität
index of centrality – retail
11,00 €
Büro Spitzenmiete
/ m2 MF/G
/ m2 MF/G
Office space prime rent
3.300 €
Durchschnittlicher Kaufpreis
/ m2
/ m2
Eigentumswohnungen Erstbezug
Condominium average purchasing price
(new construction)
* Stand 31.12.2019 As of 31.12.2019
Wirtschaftsförderungs Grundstücksgesellschaft der
Stadt Krefeld gesellschaft Krefeld mbH Stadt Krefeld GmbH & Co. KG
Rathaus, Von-der-Leyen-Platz 1 Neue Linner Straße 87 Neue Linner Straße 87
D-47798 Krefeld D-47798 Krefeld D-47798 Krefeld
+49 2151 / 86-0 +49 2151 / 820 74-0 +49 2151 / 820 74-0
www.krefeld.de www.wfg-krefeld.de www.wfg-krefeld.de 39Kennziffern Krefeld
Key figures Krefeld
Kategorie Category Thema Topic
Allgemein General Einwohner ( Stand 31.12.19 ) Inhabitants
Zentralität index of centrality – retail
Kaufkraftindex Purchasing power index
Grundsteuer B Real estate tax B
Gewerbesteuer Hebesatz Trade tax multiplier
Beschäftigte Employees SVP-Beschäftigte Employees subject to social security
Bruttowertschöpfung, absolut Gross value added
Bruttowertschöpfung pro Erwerbstätigem Gross value added per employee
Arbeitslosenquote ( Ø pro Jahr ) Rate of unemployment ( Ø per year )
Büro Office Bürobeschäftigte Office employees
Anteil Bürobeschäftigte Percentage office employees
an SVP-Beschäftigten subject to social insurance
Büroflächenbestand ( Mietfläche für
Office space stock ( in 1,000 m2 )
gewerblichen Bestand in 1.000 m2 )
Büroflächenumsatz ( Mietfläche für
Office space take-up ( in 1,000 m2 )
gewerblichen Bestand in 1.000 m2 )
Fertigstellungen ( Mietfläche für
Office space completions ( in 1,000 m2 )
gewerblichen Bestand in 1.000 m2 )
Bürospitzenmiete ( pro m2 ) Office space prime rent ( per m2 )
Logistik Logistics SVP-Beschäftigte ( Berufsgruppe 51+52 ) Employees subject to social security
Wohnen Residential Wohnungsbestand ( in 1.000 m2 ) Housing stock ( in 1,000 m2 )
Wohnungsfertigstellungen Housing completions
Mietpreis Erstbezug Wohnung ( Ø / m2 ) Housing rent new constructions ( Ø / m2 )
Kaufpreis Eigentumswohnung ( Ø / m2 ) Condominium purchasing price ( Ø / m2 )
Kaufpreis Einfamilienhaus ( Ø ) Single-family home purchaising price ( Ø )
402012 2013 2014 2015 2016 2017 2018 2019
222.026 222.058 222.500 225.144 226.812 233.342 227.020 227.417
117,8 120,3 119,5 122,0 123,8 124,6 126,7 126,3
99,9 99,3 99,1 98,7 98,5 98,5 98,2 98,0
533 533 533
480 480 480
83.060 84.899 84.693 85.480 87.279 91.220 94.393 94.415
60.962 € 59.981 € 60.926 € 61.905 € 62.975 € 64.076 € 66.595 €* 67.018 €*
10,6 %. 11,2 % 11,2 % 11,0 % 10,7 % 10,4 % 10,2 % 10,1 %
36.768 36.887 36.745 36.829 37.279 38.522 39.000 39.261*
35,1 % 35,0 % 35,0 % 34,9 % 34,9 % 34,8 % 34,7 % 34,7 %*
995 1.000 1.009 1.016 1.028 1.038 1.043 1.044
16,0 25,0 16,0 18,0 13,0 16,0 9,0 5,5
3,2 5,2 11,6 4,5 12,2 8,6 5,8 0,8
10,50 € 11,00 € 11,00 € 11,00 € 11,00 € 11,00 € 11,00 € 11,00 €
8.256 8.529 8.545 9.218 9.838 10.155 9.942 10.382
276 257 208 281 192 354 235 243
6,90 € 7,20 € 7,30 € 7,40 € 7,40 € 8,00 € 8,50 € 8,70 €
2.250 € 2.350 € 2.450 € 2.600 € 2.750 € 3.000 € 3.150 € 3.300 €
315.000 € 325.000 € 335.000 € 370.000 € 390.000 € 410.000 € 410.000 € 415.000 €
* Prognose Prediction 41Mönchengladbach Mit mehr als 270.000 Einwohnern ist Mönchen- With more than 270,000 inhabitants, Mönchen- gladbach die größte Stadt am Niederrhein. Die gladbach is the largest city in the Niederrhein positive Standort- und Wirtschaftsentwicklung Region. The positive location and economic de- fußt auf einem dynamischen und starken Im- velopment is based on a dynamic and strong mobilienstandort. Diese Entwicklung zeigt sich real estate location. For example, this develop- z. B. mit der Eröffnung des MINTO als überregio- ment is reflected in the opening of the MINTO nal bedeutsames Shopping Center, der Weiter- as a nationally significant shopping centre, the entwicklung des hochwertigen Business Parks further development of the high-quality busi- Nordpark oder der Entwicklung des Regioparks ness park Nordpark or the development of the zu einem der Top-Logistikstandorte in Deutsch- Regio Park into one of the top logistics loca- land. Mit der Stadtentwicklungsstrategie mg+ tions in Germany. With its urban development Wachsende Stadt reagiert die Stadt auf aktuel- strategy mg+ Growing City, the city is reacting le Tendenzen und Herausforderungen wie so- to current trends and challenges such as social ziale Stabilität, Wandel zur Wissensgesellschaft, stability, the changeover to a knowledge socie- Klimaschutz und Demografiefestigkeit. ty, climate protection and demographic stability. 42
270.458
                          Einwohner*
                          Inhabitants*

                                        10,50 €                       / m2
                                                                      / m2
                                          Durchschnittlicher Wohnungsmietpreis Erstbezug
                                          Average housing rent new constructions

                                                            32.400 m2
                                                            Fertigstellungen Büro**
                                                                                                    MF/G
                                                                                                    MF/G

                                                            Office space completions**

             13,30 €
              Büro Spitzenmiete
                                              / m2 MF/G
                                              / m2 MF/G

              Office space prime rent

                                          3.500 €
                                          Durchschnittlicher Kaufpreis
                                                                         / m2
                                                                         / m2

                                          Eigentumswohnungen Erstbezug
                                          Condominium average purchasing price
                                          (new construction)

* Stand 31.12.2019 As of 31.12.2019       ** Prognose 2020 Prediction 2020

                                      WFMG – Wirtschaftsförderung        EWMG – Entwicklungsgesellschaft
Stadt Mönchengladbach                 Mönchengladbach GmbH               der Stadt Mönchengladbach mbH

                                      Neuhofstraße 52                    Regentenstraße 21
D-41050 Mönchengladbach               D-41061 Mönchengladbach            D-41061 Mönchengladbach
+49 2161 / 25-0                       +49 2161 / 82 379-9                +49 2161 / 46 64-0
www.moenchengladbach.de               www.wfmg.de                        www.ewmg.de                 43
Kennzahlen Mönchengladbach
Key figures Mönchengladbach
Kategorie Category Thema Topic
Allgemein General Einwohner ( Stand 31.12.19 ) Inhabitants
Zentralität index of centrality – retail
Kaufkraftindex Purchasing power index
Grundsteuer B Real estate tax B
Gewerbesteuer Hebesatz Trade tax multiplier
Beschäftigte Employees SVP-Beschäftigte Employees subject to social security
Bruttowertschöpfung, absolut Gross value added
Bruttowertschöpfung pro Erwerbstätigem Gross value added per employee
Arbeitslosenquote ( Ø pro Jahr ) Rate of unemployment ( Ø per year )
Büro Office Bürobeschäftigte Office employees
Anteil Bürobeschäftigte Percentage office employees
an SVP-Beschäftigten subject to social insurance
Büroflächenbestand ( Mietfläche für
Office space stock ( in 1,000 m2 )
gewerblichen Bestand in 1.000 m2 )
Büroflächenumsatz ( Mietfläche für
Office space take-up ( in 1,000 m2 )
gewerblichen Bestand in 1.000 m2 )
Fertigstellungen ( Mietfläche für
Office space completions ( in 1,000 m2 )
gewerblichen Bestand in 1.000 m2 )
Bürospitzenmiete ( pro m2 ) Office space prime rent ( per m2 )
Logistik Logistics SVP-Beschäftigte ( Berufsgruppe 51+52 ) Employees subject to social security
Wohnen Residential Wohnungsbestand ( in 1.000 m2 ) Housing stock ( in 1,000 m2 )
Wohnungsfertigstellungen Housing completions
Mietpreis Erstbezug Wohnung ( Ø / m2 ) Housing rent new constructions ( Ø / m2 )
Kaufpreis Eigentumswohnung ( Ø / m2 ) Condominium purchasing price ( Ø / m2 )
Kaufpreis Einfamilienhaus ( Ø ) Single-family home purchaising price ( Ø )
442012 2013 2014 2015 2016 2017 2018 2019
255.087 255.430 256.853 266.586 269.558 270.553 270.428 270.458
113,5 115,0 117,0 118,9 120,5 118,3 119,1 117,0
96,3 95,2 94,8 94,7 94,3 94,7 93,1 93,1
620 620 620
490 490 490
85.095 87.746 89.588 92.478 93.725 96.392 100.119 100.118
53.777 € 53.457 € 54.791 € 55.364 € 56.741 € 57.911 € 58.834 €* 59.931 €*
11,2 % 11,4 % 11,4 % 10,8 % 10,5 % 10,2 % 9,8 % 9%
40.253 40.618 41.364 42.569 43.121 44.161 44.643 45.317*
36,4 % 36,5 % 36,6 % 36,7 % 36,9 % 37,0 % 37,1 % 37,2 %*
1.089 1.099 1.106 1.132 1.136 1.146 1.180 1.195
20,0 35,0 35,0 15,0 10,0 13,0 18,5 15,0
7,6 13,1 7,8 34,0 3,4 3,8 39,9 17,7
11,80 € 12,10 € 12,10 € 12,30 € 12,60 € 12,70 € 13,00 € 13,30 €
9.834 10.529 11.490 12.718 13.652 14.234 14.531 14.917
234 388 227 283 598 521 234 560
7,00 € 7,10 € 7,50 € 8,00 € 8,80 € 9,50 € 10,00 € 10,50 €
2.350 € 2.450 € 2.600 € 2.750 € 2.800 € 3.000 € 3.500 € 3.500 €
300.000 € 305.000 € 310.000 € 340.000 € 350.000 € 355.000 € 355.000 € 370.000 €
* Prognose Prediction 45Rhein-Kreis Neuss Acht Städte und Gemeinden bilden auf einer Eight cities and municipalities cover an area Fläche von 576,52 km² mit rund 452.000 Ein- of 576.52 km² and form a strong community wohnern eine starke Gemeinschaft. Gemes- with around 452,000 inhabitants. Measured sen am Bruttoinlandsprodukt pro Kopf ist der in terms of gross domestic product per capita, Rhein-Kreis Neuss seit Jahren der wirtschafts- the Rhein-Kreis Neuss has been the strongest stärkste Kreis in Nordrhein-Westfalen. Bereits economic district in North Rhine-Westphalia for 29.000 Unternehmen, darunter namhafte Welt- years. 29,000 companies, including well-known konzerne, schätzen die Standortfaktoren, die global corporations, have already come to ap- hier auf attraktive Lebensbedingungen treffen. preciate the location factors of this area and its Dabei überzeugen die internationale Ausrich- attractive living conditions. Convincing aspects tung der Wirtschaft, ein attraktives Potenzial are the international orientation of the economy, von qualifizierten Arbeitskräften sowie eine the attractive potential in terms of qualified em- ausgezeichnete logistische Infrastruktur. Der ployees and an excellent logistical infrastructure. Neuss-Düsseldorfer Hafen ist ein Drehkreuz für Neuss-Düsseldorf port is a hub for the world- die weltweite Verteilung von Waren und Gütern. wide distribution of goods and commodities. 46
451.730
                             Einwohner*
                             Inhabitants*

                                      9,70 €                   / m2
                                                               / m2
                                      Durchschnittlicher Wohnungsmietpreis Erstbezug
                                      Average housing rent new constructions

                                      1.636.000 m2
                                        Büroflächenbestand
                                                                                       MF/G
                                                                                       MF/G

                                        Office space stock

            11,30 €
                Büro Spitzenmiete
                                       / m2 MF/G
                                       / m2 MF/G

                Office space prime rent

                                      3.850 €
                                      Durchschnittlicher Kaufpreis
                                                                         / m2
                                                                         / m2

                                      Eigentumswohnungen Erstbezug
                                      Condominium average purchasing price
                                      (new construction)

* Stand 31.12.2019 As of 31.12.2019

                                                   Wirtschaftsförderungsgesellschaft
Rhein-Kreis Neuss                                  Rhein-Kreis Neuss mbH

Oberstraße 91                                      Oberstraße 91
D-41460 Neuss                                      D-41460 Neuss
+49 2131 / 928-7500                                +49 2131 / 928-7500
www.rhein-kreis-neuss.de                           www.wfgrkn.de                         47
Kennzahlen Rhein-Kreis Neuss
Key figures Rhein-Kreis Neuss
Kategorie Category Thema Topic
Allgemein General Einwohner ( Stand 31.12.19 ) Inhabitants
Zentralität index of centrality – retail
Kaufkraftindex Purchasing power index
Grundsteuer B Real estate tax B
Gewerbesteuer Hebesatz Trade tax multiplier
Beschäftigte Employees SVP-Beschäftigte Employees subject to social security
Bruttowertschöpfung, absolut Gross value added
Bruttowertschöpfung pro Erwerbstätigem Gross value added per employee
Arbeitslosenquote ( Ø pro Jahr ) Rate of unemployment ( Ø per year )
Büro Office Bürobeschäftigte Office employees
Anteil Bürobeschäftigte Percentage office employees
an SVP-Beschäftigten subject to social insurance
Büroflächenbestand ( Mietfläche für
Office space stock ( in 1,000 m2 )
gewerblichen Bestand in 1.000 m2 )
Büroflächenumsatz ( Mietfläche für
Office space take-up ( in 1,000 m2 )
gewerblichen Bestand in 1.000 m2 )
Fertigstellungen ( Mietfläche für
Office space completions ( in 1,000 m2 )
gewerblichen Bestand in 1.000 m2 )
Bürospitzenmiete ( pro m2 ) Office space prime rent ( per m2 )
Logistik Logistics SVP-Beschäftigte ( Berufsgruppe 51+52 ) Employees subject to social security
Wohnen Residential Wohnungsbestand ( in 1.000 m2 ) Housing stock ( in 1,000 m2 )
Wohnungsfertigstellungen Housing completions
Mietpreis Erstbezug Wohnung ( Ø / m2 ) Housing rent new constructions ( Ø / m2 )
Kaufpreis Eigentumswohnung ( Ø / m2 ) Condominium purchasing price ( Ø / m2 )
Kaufpreis Einfamilienhaus ( Ø ) Single-family home purchaising price ( Ø )
482012 2013 2014 2015 2016 2017 2018 2019
439.225 440.602 442.522 450.026 447.431 448.735 541.007 451.730
90,1 91,3 92,1 91,1 91,7 92,4 94,0 93,8
114,8 114,4 113,9 113,5 113,2 113,2 112,5 112,2
435 – 500 435 – 500 435–590
444 – 455 444 – 455 444–455
131.488 134.637 136.897 140.060 143.395 145.296 150.142 150.159
75.976 € 76.312 € 77.047 € 79.974 € 81.219 € 82.894 € 81.101 €* 81.873 €*
6,0 % 6,4 % 6,4 % 6,1 % 5,7 % 5,7 % 5,3 % 5,0 %
55.733 56.149 56.896 57.851 58.878 59.399 60.056 60.740*
33,0 % 33,0 % 33,0 % 33,0 % 33,4 % 33,0 % 33,0 % 33,4 %*
1.602 1.611 1.614 1.614 1.616 1.617 1.618 1.636
20,7 22,3 23,5 18,4 13,5 31,5 14,6 19,5
0,8 9,8 3,4 0,0 1,2 1,5 1,5 0,0
10,50 € 11,00 € 11,00 € 11,00 € 11,00 € 11,00 € 11,10 € 11,30 €
15.358 15.541 15.962 16.347 16.678 16.971 17.352 17.931
1.365 1.061 837 1.084 1.579 1.149 1040 1187
7,50 € 7,80 € 7,90 € 8,40 € 8,70 € 9,10 € 9,50 € 9,70 €
2.025 € 2.200 € 2.400 € 2.700 € 3.000 € 3.300 € 3.750 € 3.850 €
340.000 € 350.000 € 375.000 € 400.000 € 425.000 € 450.000 € 470.000 € 490.000 €
* Prognose Prediction 49Kreis Viersen Pulsierendes Leben, intakte Natur: Das ist der Pulsating life, intact nature: That‘s the Viersen Kreis Viersen. Im Herzen Europas gelegen, vor district. Located in the heart of Europe, just den Toren der Metropole Düsseldorf, ist er Le- outside the city of Düsseldorf, it is home to bensraum für rund 300.000 Menschen. Mit einer about 300,000 people. With a strong economy starken Wirtschaft in einer attraktiven Erlebnis- in an attractive, eventful region with a lot of region mit großem Kulturangebot und hohem culture and high recreational value. The trade Freizeitwert. Gewerbesteuerhebesätze, Grund- tax rates, land and property prices are mo- stücks- und Immobilienpreise sind moderat. derate. Viersen has excellent transport links Der Kreis Viersen verfügt über beste Verkehrs- with four Autobahns, trains to the Ruhr area anbindungen mit vier Autobahnen, Zugverbin- and the Benelux countries, Düsseldorf Inter- dungen ins Ruhrgebiet und die Beneluxstaaten, national Airport and the ports on the Rhine den Flughafen Düsseldorf International und die and the Meuse. The economy is made up of a Häfen an Rhein und Maas. Die Wirtschaft weist balanced mix of sectors. einen ausgewogenen Branchenmix auf. 50
298.863
                       Einwohner*
                       Inhabitants*

                                       8,90 €                   / m2
                                                                / m2
                                       Durchschnittlicher Wohnungsmietpreis Erstbezug
                                       Average housing rent new constructions

                                                  100,9
                                                     Kaufkraftindex ( D = 100 )
                                                     Purchasing power index ( D = 100 )

             9,70 €
                Büro Spitzenmiete
                                      / m2 MF/G
                                      / m2 MF/G

                Office space prime rent

                                       2.950 €
                                       Durchschnittlicher Kaufpreis
                                                                         / m2
                                                                         / m2

                                       Eigentumswohnungen Erstbezug
                                       Condominium average purchasing price
                                       (new construction)

* Stand 31.12.2019 As of 31.12.2019

                                                  Wirtschaftsförderungsgesellschaft
Kreis Viersen                                     für den Kreis Viersen mbH

Rathausmarkt 3                                    Willy-Brandt-Ring 13
D-41747 Viersen                                   D-41747 Viersen
+49 2162 / 39-0                                   +49 2162 / 81 79-01
www.kreis-viersen.de                              www.wfg-kreis-viersen.de                51
Kennzahlen Kreis Viersen
Key figures District of Viersen
Kategorie Category Thema Topic
Allgemein General Einwohner ( Stand 31.12.19 ) Inhabitants
Zentralität index of centrality – retail
Kaufkraftindex Purchasing power index
Grundsteuer B Real estate tax B
Gewerbesteuer Hebesatz Trade tax multiplier
Beschäftigte Employees SVP-Beschäftigte Employees subject to social security
Bruttowertschöpfung, absolut Gross value added
Bruttowertschöpfung pro Erwerbstätigem Gross value added per employee
Arbeitslosenquote ( Ø pro Jahr ) Rate of unemployment ( Ø per year )
Büro Office Bürobeschäftigte Office employees
Anteil Bürobeschäftigte Percentage office employees
an SVP-Beschäftigten subject to social insurance
Büroflächenbestand ( Mietfläche für
Office space stock ( in 1,000 m2 )
gewerblichen Bestand in 1.000 m2 )
Büroflächenumsatz ( Mietfläche für
Office space take-up ( in 1,000 m2 )
gewerblichen Bestand in 1.000 m2 )
Fertigstellungen ( Mietfläche für
Office space completions ( in 1,000 m2 )
gewerblichen Bestand in 1.000 m2 )
Bürospitzenmiete ( pro m2 ) Office space prime rent ( per m2 )
Logistik Logistics SVP-Beschäftigte ( Berufsgruppe 51+52 ) Employees subject to social security
Wohnen Residential Wohnungsbestand ( in 1.000 m2 ) Housing stock ( in 1,000 m2 )
Wohnungsfertigstellungen Housing completions
Mietpreis Erstbezug Wohnung ( Ø / m2 ) Housing rent new constructions ( Ø / m2 )
Kaufpreis Eigentumswohnung ( Ø / m2 ) Condominium purchasing price ( Ø / m2 )
Kaufpreis Einfamilienhaus ( Ø ) Single-family home purchaising price ( Ø )
522012 2013 2014 2015 2016 2017 2018 2019
295.448 294.921 295.067 297.661 298.422 298.733 298.935 298.863
87,1 86,8 86,9 87,4 86,5 86,7 87,4 88,0
101,7 102,1 102,1 101,9 101,5 101,2 101,0 100,9
429 – 500 429 – 500 440–500
410 – 475 410 – 475 410–465
80.275 82.091 83.975 85.261 86.541 89.169 94.050 94.050
53.446 € 54.313 € 56.575 € 56.753 € 58.196 € 59.526 € 58.735 €* 59.877 €*
7,1 % 7,3 % 7,2 % 6,9 % 6,8 % 6,4 % 5,9 % 5,3 %
34.662 35.085 35.583 35.774 35.958 36.583 36.942 37.051*
32,1 % 31,9 % 31,8 % 31,6 % 31,5 % 31,3 % 31,2 % 31,0 %*
684 686 686 688 688 688 691 691
1,6 4,3 2,5 3,5 2,5 4,5 6,0 1,3
1,5 1,3 0,0 1,5 0,0 0,8 3,5 0,0
k. A. 9,50 € 9,50 € 9,50 € 9,50 € 9,50 € 9,60 € 9,70 €
8.961 9.392 10.107 10.576 11.022 11.312 11.391 12.324
463 700 703 543 271 553 735 759
6,60 € 7,00 € 7,20 € 7,40 € 7,90 € 8,50 € 8,60 € 8,90 €
1.950 € 2.025 € 2.200 € 2.400 € 2.500 € 2.600 € 2.900 € 2.950 €
267.500 € 275.000 € 285.000 € 290.000 € 315.000 € 315.000 € 330.000 € 350.000 €
* Prognose Prediction 53Kreis Wesel Zu beiden Seiten des Rheins gelegen, zeich- Located on both sides of the Rhine, the Wesel net sich der Kreis Wesel vor allem durch sei- district is characterized by its growing econo- ne wachsende Wirtschaft aus. Die geringe my. The low unemployment rate and the ex- Arbeitslosenquote, aber auch die über dem port quota, which is above the average for the Landesdurchschnitt liegende Exportquote sind federal state, are proof that the economy in Belege dafür, dass die Wirtschaft im Kreis gut the district is in a strong position. At the same aufgestellt ist. Gleichzeitig weist der gewerb- time, the commercial real estate market is liche Immobilienmarkt eine hohe Dynamik auf. very dynamic. The logistics sector in particu- Sowohl europäische Logistikzentren als auch lar has taken the opportunity here to develop. E-Commerce-Zentren sind entstanden und Both European logistics and e-commerce cen- festigen weiter die bereits starke Stellung der tres have been established and underline the Logistik im Kreis. Insbesondere in den Hafen- strong position of logistics in the district. In the gebieten ist noch Platz für neue Ideen. Span- port areas in particular there is still room for nende Entwicklungen sind zudem auf den ehe- new ideas. Exciting developments are also pos- maligen Bergbau- und Industrieflächen möglich. sible in the former mining and industrial areas. 54
459.976
                       Einwohner*
                       Inhabitants*

                                       8,30 €                     / m2
                                                                  / m2
                                       Durchschnittlicher Wohnungsmietpreis Erstbezug
                                       Average housing rent new constructions

                                                                         413–765
                                                                          Grundsteuer B
                                                                          Real estate tax B

              9,20 €
                Büro Spitzenmiete
                                      / m2 MF/G
                                      / m2 MF/G

                Office space prime rent

                                       3.100 €
                                       Durchschnittlicher Kaufpreis
                                                                         / m2
                                                                         / m2

                                       Eigentumswohnungen Erstbezug
                                       Condominium average purchasing price
                                       (new construction)

* Stand 31.12.2019 As of 31.12.2019

                                                  EntwicklungsAgentur
Kreis Wesel                                       Wirtschaft Kreis Wesel

Reeser Landstraße 31                              Reeser Landstraße 31
D-46483 Wesel                                     D-46483 Wesel
+49 281 / 207-2136                                +49 281 / 207-4085
www.kreis-wesel.de                                www.eaw-kreiswesel.de                       55
Kennzahlen Kreis Wesel
Key figures District of Wesel
Kategorie Category Thema Topic
Allgemein General Einwohner ( Stand 31.12.19 ) Inhabitants
Zentralität index of centrality – retail
Kaufkraftindex Purchasing power index
Grundsteuer B Real estate tax B
Gewerbesteuer Hebesatz Trade tax multiplier
Beschäftigte Employees SVP-Beschäftigte Employees subject to social security
Bruttowertschöpfung, absolut Gross value added
Bruttowertschöpfung pro Erwerbstätigem Gross value added per employee
Arbeitslosenquote ( Ø pro Jahr ) Rate of unemployment ( Ø per year )
Büro Office Bürobeschäftigte Office employees
Anteil Bürobeschäftigte Percentage office employees
an SVP-Beschäftigten subject to social insurance
Büroflächenbestand ( Mietfläche für
Office space stock ( in 1,000 m2 )
gewerblichen Bestand in 1.000 m2 )
Büroflächenumsatz ( Mietfläche für
Office space take-up ( in 1,000 m2 )
gewerblichen Bestand in 1.000 m2 )
Fertigstellungen ( Mietfläche für
Office space completions ( in 1,000 m2 )
gewerblichen Bestand in 1.000 m2 )
Bürospitzenmiete ( pro m2 ) Office space prime rent ( per m2 )
Logistik Logistics SVP-Beschäftigte ( Berufsgruppe 51+52 ) Employees subject to social security
Wohnen Residential Wohnungsbestand ( in 1.000 m2 ) Housing stock ( in 1,000 m2 )
Wohnungsfertigstellungen Housing completions
Mietpreis Erstbezug Wohnung ( Ø / m2 ) Housing rent new constructions ( Ø / m2 )
Kaufpreis Eigentumswohnung ( Ø / m2 ) Condominium purchasing price ( Ø / m2 )
Kaufpreis Einfamilienhaus ( Ø ) Single-family home purchaising price ( Ø )
562012 2013 2014 2015 2016 2017 2018 2019
458.329 457.033 457.244 462.664 461.715 461.305 459.809 459.976
89,8 89,4 89,6 90,9 91,5 92,3 92,2 92,0
99,3 100,0 99,9 99,5 99,6 99,5 99,5 99,2*
413 – 765 413 – 765 413–765
411 – 500 411 – 510 411–510
120.824 125.454 126.106 127.916 129.627 133.070 138.686 138.259
53.498 € 55.018 € 56.768 € 56.607 € 57.636 € 58.656 € 58.871 €* 59.715 €*
7,1 % 7,4 % 7,7 % 7,5 % 7,1 % 6,9 % 6,3 % 5,9 %
53.077 53.510 53.529 53.751 53.995 54.788 55.414 55.651*
32,8 % 32,7 % 32,6 % 32,4 % 32,3 % 32,2 % 32,0 % 31,9 %*
1.051 1.052 1.054 1.059 1.062 1.066 1.066 1.070
4,6 4,7 4,4 9,8 5,5 4,5 7,7 6,6
16,2 0,8 1,5 4,7 2,9 4,5 0,4 3,9
k. A. 9,00 € 9,00 € 9,00 € 9,00 € 9,00 € 9,10 € 9,20 €
k. A. k. A. 15.552 16.096 15.273 15.198 15.711 16.356
958 893 981 804 1.190 1.001 948 1056
6,60 € 6,80 € 6,90 € 7,40 € 8,10 € 8,30 € 8,30 € 8,30 €
1.950 € 2.050 € 2.150 € 2.400 € 2.600 € 2.800 € 3.000 € 3.100 €
265.000 € 275.000 € 275.000 € 280.000 € 295.000 € 300.000 € 320.000 € 340.000 €
* Prognose Prediction 57Sie können auch lesen