Aumann AG Ordentliche Hauptversammlung 06. Juni 2019
←
→
Transkription von Seiteninhalten
Wenn Ihr Browser die Seite nicht korrekt rendert, bitte, lesen Sie den Inhalt der Seite unten
Aumann AG
Ordentliche Hauptversammlung

06. Juni 2019

                               0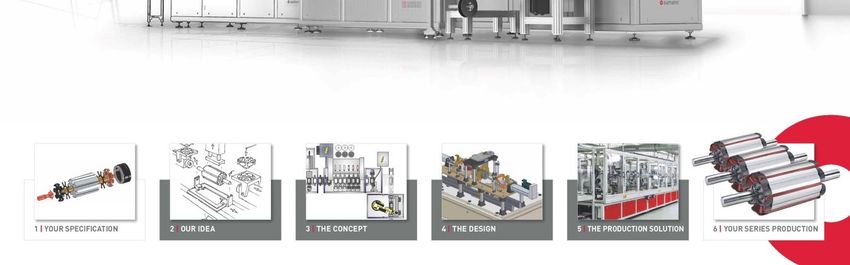
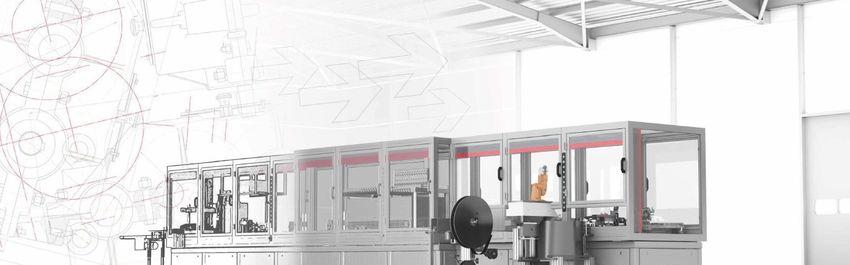
Von der Vision zum Produkt

  Automatisierungslösungen für komplexe Anwendungsfälle

1 | Kundenanforderung   2 | Unsere Idee   3 | Das Konzept   4 | Das Design   5 | Die Produktionslösung   6 | Ihre Serienproduktion

                                                                                                                                     1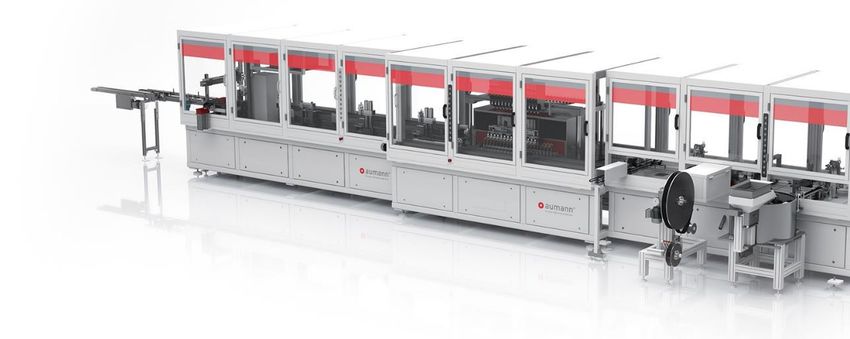
Aumann ist Automatisierungsspezialist …

              E-mobility Fokus                   Hohes Kundenvertrauen

                                  E-mobility
                         ~40%
                                 Umsatzanteil*

              Produktionslösungen                Dynamisches Wachstum

                                                 Umsatz in Mio. €
                                                                    +46% p.a.      291

                                                                            210
                                                               156
                                                     93

                                                    2015A     2016A        2017A   2018A

* Stand: 31.03.2019                                                                        2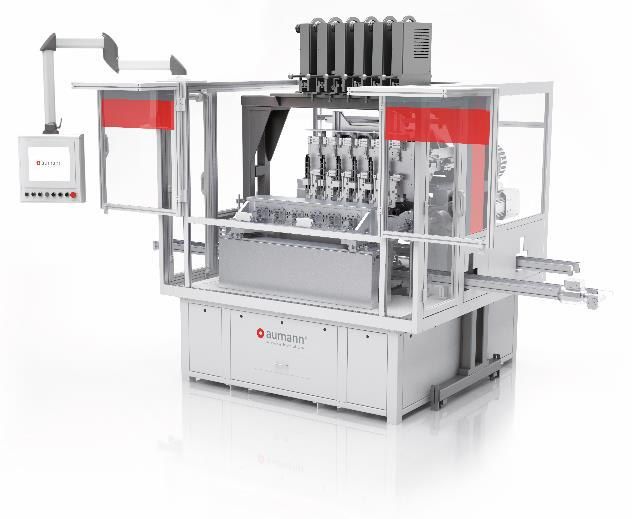
… für vielfältige E-mobility Produktionslösungen

          Elektrischer             Energiespeicher und          Elektrifizierung und
         Antriebsstrang                -umwandler                     Sensorik

      Wicklung / Montage von     Montage von Modulen, Packs    Wicklung / Montage von
     Stator, Rotor und E-Modul      und Brennstoffzellen      E-Hilfsmotoren und Spulen

                                         E-mobility

                                                                                          3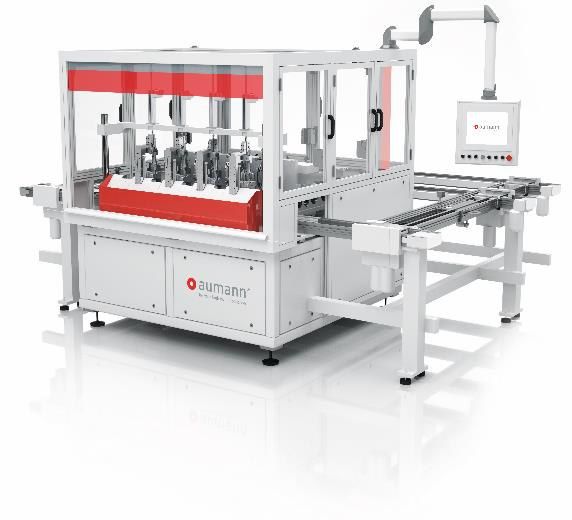
Vielversprechende Perspektiven

           Push-and-Pull-Faktoren für die E-Mobilität                                    Globale Fahrzeugproduktion nach Antriebsart

                        Push                                               Pull              91          98          105           109

          Technologie                                                                        5%
                                                                                                         7%
                                                                                                                     24%
                                                                                                                                   48%

                                                                                             95%        93%
                                                                          Konsumenten-                               76%
                                                                            nachfrage
                                                                                                                                   52%
        Gesetzgebung

                                                                                            2017        2020         2025          2030
                                                                                                              ICE*   EV**

                                                                                                        Anzahl Fahrzeuge in Mio.

Quelle: IHS; *ICE = Internal Combustion Engine; **EV = BEV, PHEV, MHEV und HEV                                                            4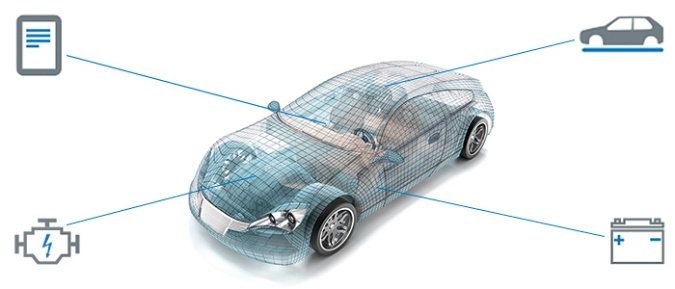
Highlights seit Börsengang

                                 Dynamische
                                 Umsatzentwicklung            +135 Mio. €

                                Überdurchschnittliche
                                EBIT-Margen                   10,2% März 2019
                                                                     (adj.)

                                Stark wachsender
                                E-mobility Ergebnisanteil     51,4% März 2019

                                Zielgerichtete Technologie-
                                und Kapazitätserweiterung     +543 Mitarbeiter

Vergleichszeitraum: 2016-2018                                                    5
Aktienkursentwicklung und operativer Geschäftsverlauf

            Aktienkurs, Umsatz und Adj. EBIT
            Kursverlauf in €, sonstige Zahlen in Mio. €

       100

          90

          80                                                                               +6,6%

          70                                                                               78,7         78,8
                                                  70,0                         70,1
          60                                                                                                      67,4
                                                               63,2
          50
                        47,5
          40                           42,4

          30

          20

          10                  5,9                     5,9            7,5           8,1         8,1         5,6       6,9
                                          2,8
            0
                       Q2 2017         Q3 2017   Q4 2017       Q1 2018         Q2 2018     Q3 2018      Q4 2018   Q1 2019

                                                            Umsatz         Adj. EBIT     Aumann Aktie

Frankfurter Börse, Stand: 05.06.2019                                                                                        6
Geschäftsjahr 2018

                     7
Erneut ein erfolgreiches Jahr für Aumann
2018 erneut mit Rekordergebnis: Umsatz (+38%) und EBIT (+40%) legen deutlich zu
E-mobility Umsatzanteil auf 36% angestiegen, operativer Ergebnisbeitrag steigt auf 48% (EBIT)
Solide Kundenbasis mit zuletzt starkem Momentum im Zielmarkt Asien (>20% AE)
Erfolgreicher Abschluss der Integration der Aumann Limbach-Oberfrohna (vorher USK)
Wachsendes Interesse an Brennstoffzellen-Technologie (Automobilhersteller und Tier-1 Kunden)
8Starkes Wachstum setzt sich fort
Umsatz
in Mio. €
290,8
CAGR 46%
210,4
156,0
93,4
2015A 2016A 2017A 2018A
9Weiterhin zweistellige EBIT-Margen
Adj. EBIT
in Mio. € und in % vom Umsatz
11,7% 12,4% 10,0% 10,1%
29,3
21,0
19,3
11,0
2015A 2016A 2017A 2018A
10Profitables Wachstum
Umsatz Adj. EBIT*
in Mio. € in Mio. €
38,2% +39,5%
290,8 29,3
105,0
210,4 21,0 14,2
60,8 6,7
185,8
149,6 14,4 14,9
2017A 2018A 2017A 2018A
E-mobility Classic
*nicht dargestellt: Effekte aus Überleitung 11E-mobility Segment im Vorwärtsgang
Umsatz E-mobility Adj. EBIT E-mobility
in Mio. € in Mio. € und in % des Umsatzes
72,7% 11,0% 13,5%
105,0
111,9%
14,2
60,8
6,7
2017A 2018A 2017A 2018A
12Weltweite Expansion in den Zielregionen
Umsatz nach Regionen
in Mio. €
+37,1 +17,0 +27,2
222,2 36,6 31,1
185,1
19,6
3,9
2017A 2018A 2017A 2018A 2017A 2018A
Europa Asien NAFTA
13Auftragseingang 2018 als solide Basis für Folgejahr
Auftragseingang Auftragsbestand
in Mio. € in Mio. €
290,9 204,2 204,2
282,3
113,5 70,7 79,2
102,3
180,0 177,4 133,4 125,0
2017A 2018A 2017A 2018A
E-mobility Classic
14Zurückhaltender Markt in 2018
Auftragseingang & Auftragsbestand
in Mio. €
213,3
204,2 203,3 204,2
196,2
147,0
86,8
72,4 71,6
60,1
Q4 2017 Q1 2018 Q2 2018 Q3 2018 Q4 2018
Auftragseingang Auftragsbestand
15Gut gerüstet dank solider Bilanz
Bilanz per 31.12.2018
in Mio. €
336 336
Anlagevermögen** 80
196
Eigenkapital
(58%)
Umlaufvermögen** 140
Cash* 116
117 Sonstige Schulden
93 Mio. €
Net Cash
23 Finanzschulden
Aktiva Passiva
* Liquidität und Wertpapiere des AV und Finanzanlagen des UV | ** ohne Cash-Positionen 16Erfolgreiche Integration der USK
2017 2018
wird zu
Engineering & Workshop Kapazitäten Kapazitätsausgleich in der Gruppe
~ 70 Mio. € Umsatz Erste Projekte zur USK transferiert
> 370 Mitarbeiter Gemeinsame Akquisitionen mit Schwestergesellschaften
Planung und Erweiterung Shopfloor angestoßen
Automotive Erfahrung Transformation in einen E-mobility Anbieter
OEMs/Tier-1s Know-How Transfer bei Elektromobilitäts-Technologien
Automatisierer mit starker Technologiebasis Steigende Anzahl an E-mobility Projekten bei USK
Besonderheiten Brennstoffzelle ergänzt Aumann Angebotspalette
Built-to-print Kompetenz Hohes Interesse an USK Brennstoffzellen-Technologie
Sensoren und Brennstoffzelle USK Know-How für die gesamte Gruppe
17Geschäftsjahr 2019
18
18Ausblick und Fokus 2019
Stabilisierung für Weitere Expansion
weiteres Wachstum NAFTA und Asien
Management
wirtschaftlicher &
politischer Unwägbarkeiten
Kontinuierliche
Technologieentwicklung Strategisches M&A mit
mit Fokus auf E-mobility Fokus auf USA
19Management externer Unwägbarkeiten
Unsicherheiten im politischen Zurückhaltung in der
und wirtschaftlichen Umfeld Automobilindustrie
Handelskonflikte ICE Regulation
Brexit Geringer Endkundenabsatz
Konjunktur Technologiezurückhaltung
Geldmarktpolitik Sparprogramme
Gesetzgebung Niedrige Investitionsbereitschaft
20Zurückhaltende Auftragsvergabe im Classic Segment
Auftragseingang Auftragseingang Classic
in Mio. € in Mio. €
-30,6 Mio. € -23,4 Mio. €
72,4 40,9
31,5
41,8
17,5
24,3
40,9
17,5
Q1 2018 Q1 2019 Q1 2018 Q1 2019
E-mobility Classic
21Solider Umsatz in der Gruppe mit Treiber E-mobility
Umsatz Umsatz E-mobility
in Mio. € in Mio. €
+6,6% 35,5%
67,4 26,7
63,2
19,7 26,7 19,7
43,5 40,7
Q1 2018 Q1 2019 Q1 2018 Q1 2019
E-mobility Classic
22Zweistellige operative Marge
Adj. EBIT* Adj. EBIT E-mobility
in Mio. € und in % des Umsatzes in Mio. € und in % des Umsatzes
11,9% 10,2% 14,2% 13,1%
-8,0% 25,0%
7,5 3,5
6,9
2,8
2,8
3,5
4,7
3,3
Q1 2018 Q1 2019 Q1 2018 Q1 2019
E-mobility Classic
*nicht dargestellt: Effekte aus Überleitung 23Umsatz und operatives Ergebnis unverändert dynamisch
Umsatz Adj. EBIT
in Mio. € in Mio. €
leichtes leichtes
Wachstum Wachstum
290,8 29,3
210,4 21,0
19,3
156,0
2016A 2017A 2018A 2019E 2016A 2017A 2018A 2019E
24Nach 2019 wieder deutliches Umsatzwachstum erwartet
Umsatz
in Mio. €
Zweistelliges Umsatzwachstum
CAGR +37%
290,8
210,4
156,0
2016A 2017A 2018A 2019E 2020E 2021E 2022E 2023E
25E-mobility langfristig nicht ohne Brennstoffzelle
Hohes Brancheninteresse an Brennstoffzelle Gepaart mit Aumanns Kompetenzen
Audi forciert Entwicklung und Bau von BZ-Fahrzeugen
s
Audi hat vor, die Entwicklung von BZ-Autos zu intensivieren. Die 1 Cell Generation
Ingolstädter (…) wollen noch in diesem Jahr einen Prototyp der
sechsten Brennstoffzellen-Generation vorstellen.*
H+
Bosch steigt in Serienfertigung von Brennstoffzellen ein
s
Bosch kündigt seinen Einstieg in die Serienfertigung vo s
Zulieferer n Brennstoffzellen für Lkw und Pkw an. Vor diesem Hintergrund 2 Cell Stacking
ist der Konzern jetzt eine Kooperation mit dem schwedischen Hersteller
PowerCell Sweden (…) eingegangen.**
Aus NuCellSys wird Mercedes-Benz Fuel Cell:
Daimler stärkt Brennstoffzelle
Die Mercedes-Benz Fuel Cell hat die Aufgabe das Brennstoffzellensystem +
so zu konzipieren, dass es sich flexibel in den konzernweiten
Elektrobaukasten eingliedern lässt. *
3 Functional Testing
-
Quellen: *www.electrive.net | **www.bosch-presse.de
26Aumann ist attraktiv aufgestellt
Technologischer Fokus auf Unternehmens-
Vorsprung E-mobility struktur und Größe
Exklusive Jahrzehntelange
~ € 300 Millionen
Wickel- Automotive-
Umsatz
technologien Erfahrung
Kundenbeziehungen
Höchstes Maß an 6 Standorte in
zu einschlägigen
Automatisierung Europa, China, USA
OEMs/Tier-1s
Turn-Key Technologien für den Expertise mit
Produktionslinien E-Antriebsstrang Großprojekten
Global führend bei hochautomatisierten Produktionslösungen für die E-Mobilität
27Finanzkalender
Vorläufige Zahlen 2018 und Prognose 2019 28. Februar 2019
Geschäftsbericht 2018 10. April 2019
Bankhaus Lampe German Conference (Baden-Baden) 05. April 2019
Quartalsbericht Q1 2019 15. Mai 2019
Hauck & Aufhäuser Stock Picker Summit (Madrid, Spanien) 16. Mai 2019
Berenberg USA Conference (Tarrytown, NY, USA) 21. Mai 2019
Ordentliche Hauptversammlung 06. Juni 2019
Quartalsbericht Q2 2019 15. August 2019
Commerzbank Sector Conference (Frankfurt am Main) 28. August 2019
Berenberg/Goldman Sachs Conference (München) 24. September 2019
Quartalsbericht Q3 2019 14. November 2019
Deutsches Eigenkapitalforum (Frankfurt am Main) 25. November 2019
Berenberg European Conference (Pennyhill Park, GB) 02. Dezember 2019
Geschäftsjahresende 2019 31. Dezember 2019
28No matter who will prevail in the E-mobility
revolution, they will need Aumann’s
machines for electric drivetrain
manufacturing
www.aumann.com
29Disclaimer
The presentation, including any printed or electronic copy of these slides, the talks given by the presenters, the information communicated during any delivery of the presentation and any question
and answer session and any document or material distributed at or in connection with the presentation (together, the “Presentation”), has been prepared by Aumann AG (the “Company”) is not an
offer of any securities or invitation to purchase securities.
The Presentation is provided for general information only and does not purport to contain all the information that may be required to evaluate the Company or the Company's shareholder, MBB SE.
The information in the Presentation is subject to updating, completion, revision and verification.
No reliance may be placed for any purpose whatsoever on the information or opinions contained or expressed in the Presentation or on the accuracy, completeness or fairness of such information
and opinions. To the extent permitted by law and regulation, no undertaking, representation or warranty or other assurance, express or implied, is made or given by or on behalf of the Company, MBB
SE, or any of their respective parent or subsidiary undertakings or the subsidiary undertakings of any such parent undertakings or any of their respective directors, officers, partners, employees,
agents, affiliates, representatives or advisers, or any other person, as to the accuracy, completeness or fairness of the information or opinions contained in the Presentation.
None of the Company or MBB SE, their respective affiliates and advisers, agents and/or any other party undertakes or is under any duty to update the Presentation or to correct any inaccuracies in
any such information which may become apparent or to provide you with any additional information. Save in the case of fraud, no responsibility or liability is accepted by any such person for any
errors, omissions or inaccuracies in such information or opinions or for any loss, cost or damage suffered or incurred, however arising, directly or indirectly, from any use of, as a result of the reliance
on, or otherwise in connection with, the Presentation. In addition, no duty of care or otherwise is owed by any such person to recipients of the Presentation or any other person in relation to the
Presentation.
The Presentation includes statements that are, or may be deemed to be, forward-looking statements. The words “believes”, “expects”, “may”, “will”, “could”, “should”, “shall”, “risk”, “intends”,
“estimates”, “aims”, “plans”, “predicts”, “continues”, “assumes”, “positioned” or “anticipates” and similar expressions (or their negative) identify certain of these forward-looking statements. These
statements are based on the current views, expectations and assumptions of the management of the Company and involve known and unknown risks and uncertainties that could cause actual
results, performance or events to differ materially from those expressed or implied in such statements. Actual results, performance or events may differ materially from those described in such
statements due to, among other things, changes in the general economic and competitive environment, risks associated with capital markets, currency exchange rate fluctuations and competition
from other companies, changes in international and national laws and regulations, in particular with respect to tax laws and regulations, affecting the Company and other factors. The Company does
not assume any obligations to update any forward- looking statements.
The Presentation includes statistics, data and other information relating to markets, market sizes, market shares, market positions and other industry data pertaining to the Company's business and
markets. Unless otherwise indicated, such information is based on analysis by the Company of multiple sources, including certain studies commissioned from third parties (the “Market Reports”). The
Market Reports may include and be based on, amongst other things, information obtained from primary interviews and field visits conducted by third parties with industry experts and participants, third
parties’ secondary market research and internal financial and operational information supplied by, or on behalf of, the Company, as well as information obtained from (i) data providers; (ii) industry
associations and country organisations; and (iii) publicly available information from other sources, such as information publicly released by the Company’s competitors. To the extent available, the
industry, market and competitive position data contained in the Presentation has come from official or third-party sources. Third-party industry publications, studies and surveys generally state that the
data contained in them have been obtained from sources believed to be reliable, but that there is no guarantee of the accuracy or completeness of such data. While the Company believes that each
of these publications, studies and surveys has been prepared by a reputable source, the Company has not independently verified the data contained therein. In addition, certain of the industry, market
and competitive position data contained in the Presentation come from the Company’s own internal research and estimates based on the knowledge and experience of the Company’s management in
the markets in which the Company operates. While the Company believes that such research and estimates are reasonable and reliable, they, and their underlying methodology and assumptions,
have not been verified by any independent source for accuracy or completeness and are subject to change without notice. Accordingly, undue reliance should not be placed on any of the industry,
market or competitive position data contained in the Presentation. All projections, valuations and statistical analyses are provided to assist the recipient in the evaluation of the matters described in the
Presentation. They may be based on subjective assessments and assumptions and may use one among alternative methodologies that produce different results and, to the extent that they are based
on historical information, they should not be relied upon as an accurate prediction of future performance.
The distribution of this Presentation in certain jurisdictions is restricted by law. Therefore, it must not be distributed, published or reproduced (in whole or in part) or disclosed by its recipients to any
other person for any purpose, other than with the consent of the Company. All trademarks remain the property of their respective owners. By accepting receipt of, attending any delivery of, or
electronically accessing, the Presentation, you agree to be bound by the above limitations and conditions and, in particular, you represent, warrant and undertake to the Company that: (i) you will not
forward the Presentation to any other person or reproduce or publish this document, in whole or in part, for any purpose; and (ii) you have read and agree to comply with the contents of this notice.
30Sie können auch lesen