Local availability of raw materials and increasing global demand - aspects of resilient resource strategies Lokale Verfügbarkeit von Rohstoffen ...
←
→
Transkription von Seiteninhalten
Wenn Ihr Browser die Seite nicht korrekt rendert, bitte, lesen Sie den Inhalt der Seite unten
Mineral Raw Materials                                                                           World of Mining – Surface & Underground 72 (2020) No. 5

Local availability of raw materials and
increasing global demand – aspects of
resilient resource strategies
Lokale Verfügbarkeit von Rohstoffen
bei steigender globaler Nachfrage –
Aspekte zu resilienten Ressourcenstrategien

Christoph Hilgers, Ivy Becker, Germany

The growing world population with increasing prosperity results in         Die wachsende Weltbevölkerung mit zunehmendem Wohlstand
an increasing demand for organic, mineral and metallic raw ma-             hat einen steigenden Bedarf an organischen, mineralischen und
terials, which cannot be met by recycling alone. Demand will also          metallischen Rohstoffen zur Folge, der allein durch Recycling nicht
increase due to the energy- and mobility transition. Germany does          zu decken ist. Der Bedarf wird durch die Energie- und Mobilitäts-
not host any major globally operating company in metal mining,             wende zusätzlich steigen. Deutschland hat keine global agieren-
and the number of companies in the mining, smelting and refining           den Großunternehmen im Bereich Metallrohstoffe, die Anzahl an
sectors is steadily decreasing. Without entrepreneurial activities         Unternehmen im Bereich Bergbau, Verhüttung und Raffination
and geostrategic and political support, resilient supply chains are        nimmt kontinuierlich ab. Ohne unternehmerische Tätigkeiten und
at risk in an increasingly competitive and protectionist environment.      geostrategisch-politische Begleitung sind resiliente Lieferketten in
Keywords:                                                                  einem zunehmend kompetitiven und protektionistischen Umfeld
                                                                           gefährdet.
Exploration – Smelting – Recycling – Energy transition
                                                                           Schlüsselwörter:
1       Introduction                                                       Exploration – Verhüttung – Recycling – Energiewende
New insights into processes and technical innovation in exploration,
mining, smelting and refining deliver the organic, mineral and metallic
                                                                           1      Einleitung
raw materials mined from the subsurface that provide the supply of         Neue Erkenntnisse zu Prozessen und technische Innovation
the technosphere. Primary raw materials extracted from the geo-            bei Exploration, Bergbau, Verhüttung und Raffination liefern die
sphere are and will be required in the long term for an industrialized     organischen, mineralischen und metallischen Rohstoffe aus dem
country such as Germany and the rest of the world, since recycling         Untergrund, um den Bedarf der Technosphäre zu decken. Dabei
and circular economy alone do not cover global demand [1].                 sind und werden aus der Geosphäre gewonnene Primärrohstoffe
Like other industrialized countries, Germany, with its mining and          für ein Industrieland wie Deutschland und die übrige Welt auf
metallurgy skills that it has developed over time, needs strategies        lange Zeit notwendig sein, da Recycling und Kreislaufführung den
to ensure the resilient availability of raw materials. The develop-        globalen Bedarf allein nicht decken [1].
ment of new products in shorter cycles, digitalization, the energy         Deutschland mit seinen über historische Zeiten entwickelten
transition and the mobility transition require internationally resilient   Kompetenzen in Bergbau und Metallurgie benötigt wie andere
                                                                           Industrieländer Strategien, die eine resiliente Verfügbarkeit von
                                                                           Rohstoffen sicherstellen Die Entwicklung von neuen Produkten in
                                                                           kürzeren Zyklen, Digitalisierung, Energiewende und Mobilitätswen-
Univ.-Prof. Dr. Christoph Hilgers1,2,3                                     de erfordern in einem wachsenden, globalen Markt international
Dr. Ivy Becker2,4                                                          resiliente Lieferketten von Rohstoffen. Der Zugang zu Rohstoffen
1
 Karlsruhe Institut für Technologie – KIT, Angewandte Geo-                 wird kompetitiver, da rohstoffreichen Ländern von aufstrebenden
wissenschaften, Adenauerring 20a, 76131 Karlsruhe, Germany                 Schwellen- und Industrieländern auch alternative soziale, ethische
Tel. +49 (0) 721-608-42139                                                 und wirtschaftliche Modelle angeboten werden, um Lieferketten
e-mail: christoph.hilgers@kit.edu                                          zu sichern.
2
 Think Tank Innovative Ressourcenstrategien, angesiedelt am                In diesem Beitrag werden unterschiedliche Aspekte der Energie-
Karlsruhe Institut für Technologie KIT                                     und metallischen Rohstoffversorgung aufgezeigt, die sich im
3
 RohstoffWissen! e.V., Lessenicher Str. 1, 53123 Bonn, Germany             Hinblick auf die erneuerbaren Energien ergeben. Die Frage der
4
 Equinor ASA, Sandsliveien 90, Sandsli, Norway                             Rohstoffstrategien wird vor dem Hintergrund der Wohlstands-
Tel. +47 94170838                                                          wende betrachtet, die erst seit Beginn der Industrialisierung den
e-mail: ivb@equinor.com                                                    Zugang breiter Bevölkerungsschichten zu Waren und Dienstleis-
                                                                           tungen ermöglicht.

254
World of Mining – Surface & Underground 72 (2020) No. 5 Mineral Raw Materials
supply chains of raw materials in a growing, global market. Access 2 Nachfrage
to raw materials is becoming more competitive, since emerging
and industrialized countries offer resource-rich countries alterna- 2.1 Steigende Rohstoffnachfrage durch
tive social, ethical and economic models to secure supply chains. Bevölkerungswachstum und Wohlstand
In this article different aspects of the energy- and metallic raw Die Nachfrage nach Rohstoffen wächst durch eine steigende
material supply are discussed, which arise with renewable ener- Weltbevölkerung mit einem jährlichen Zuwachs äquivalent zur Ge-
gies. The question of raw material strategies is viewed against samtbevölkerung Deutschlands. Dabei nimmt die globale Bevöl-
the background of the increasing prosperity, which has enabled kerung durch den bereits seit 2000 stark steigenden Anteil älterer
broad parts of the population to access goods and services only Gruppen zu (Abbildung 1a). Die bereits sinkende Wachstumsrate
since the beginning of industrialization. von derzeit etwa +1 % sollte im zweiten Teil dieses Jahrhunderts zu
einer Stabilisierung der Weltbevölkerung führen (Abbildung 1a). Der
2 Demand logistische Trend der Bevölkerungszunahme wird sich aufgrund
von höherer Bevölkerungsdichte und steigendem Wohlstand bei
2.1 Rising demand of raw materials due to
etwa 10 Mrd. Menschen einpendeln (Abbildung 1a). Gleichzeitig
population growth and prosperity steigt das globale BIP pro Kopf und wird sich bis 2060 verdreifa-
The demand for raw materials is growing due to an increasing chen, angetrieben durch die wirtschaftliche Entwicklung Chinas
world population with an annual increase equivalent to the total und Indiens, während das Wachstum in Deutschland und Europa
population of Germany. Since 2000, the global growing proportion beschränkt bleibt [2] (Abbildung 1b).
of older people drives global population growth (Figure 1a). The
already declining population growth rate of currently around +1 % 2.2 Steigende Rohstoffnachfrage durch die
should lead to a stabilization of the world population in the second Energiewende
part of this century (Figure 1a). The logistical trend of population Politische Maßnahmen, Effizienzsteigerungen und Kostenreduk-
growth will level off at around 10 billion people due to higher pop- tion führen zu einem Ausbau von Solar- und Windenergie, wobei
ulation density and increasing prosperity (Figure 1a). At the same der nationale Energiemix und der damit assoziierte CO2-Ausstoß
time, global GDP per capita is increasing and will triple by 2060, in Europa, den BRIICS-Staaten (Brasilien, Russland, Indien,
driven by the economic development of China and India, while Indonesien, China und Südafrika) und anderen Industrieländern
growth in Germany and Europe remains limited [2] (Figure 1b). sehr heterogen ist (Abbildung 2). In Deutschland ist der Anteil der
erneuerbaren Energien Solar und Wind an der Primärenergie mit
2.2 Rising demand for raw materials due to the 1,3 % bzw. 3 % gering [5] (Abbildung. 3). Mit dem Ausstieg aus
energy transition Kohle- und Atomverstromung fallen 28 % und mit dem Ausstieg
Political measures, increases in efficiency and cost reduction lead aus Erdöl und Erdgas weitere 57 % der Primärenergie des Landes
to an increase of solar and wind energy, whereby the national weg (Abbildung 3). Der globale Ausbau von Photovoltaik wird mit
energy mix and the associated CO2 emissions in Europe, the einem Anstieg von 0,63 TW im Jahr 2019 auf 10,6 TW Kapazität
BRIICS countries (Brazil, Russia, India, Indonesia, China and mit einer Stromproduktion von 18,7 PWh/a im Jahr 2050, der
South Africa) and other industrialized countries vary significantly globale Ausbau von Windenergie von einer derzeitigen Leistung
(Figure 2). In Germany, the share of renewable energies solar and von 0,73 TW auf 6,2 TW in 2050 mit einer Stromproduktion von
wind in primary energy is low at 1.3 % and 3 % respectively [5] 18,5 PWh/a (derzeit 1,3 PWh/a, 2017) prognostiziert [6].
(Figure 3). With the exit from coal and nuclear power generation, Globales Wachstum von Bevölkerung und Wohlstand, neue Tech-
28 % and with the exit from oil and natural gas a further 57 % nologien und politische Maßnahmen zur Energiewende führen zu
of the country’s primary energy need to be replaced (Figure 3). einer steigenden Nachfrage von Rohstoffen bei steigendem pro
Global photovoltaics is predicted to increase from 0.63 TW in Kopf-Verbrauch. Entsprechend wird sich die globale Förderung
2019 to 10.6 TW capacity with an electricity production of 18.7 metallischer Erze von 9 Gt (2017) auf 20 Gt im Jahr 2060 mehr
PWh/a in 2050, while global wind energy may increase from a als verdoppeln [2]. Der globale Anteil an Erdgas wird auch im Jahr
4 000 000 12 000 000 7.0E+07
3 500 000 6.0E+07
10 000 000
world population (ages)
3 000 000
5.0E+07
GDP [mio USD ppp]
world population
8 000 000
2 500 000
4.0E+07
2 000 000 6 000 000
3.0E+07
1 500 000
4 000 000
2.0E+07
1 000 000
2 000 000 1.0E+07
500 000
0 0 0.0E+00
1990
1993
1996
1999
2002
2005
2008
2011
2014
2017
2020
2023
2026
2029
2032
2035
2038
2041
2044
2047
2050
2053
2056
2059
1950
1960
1970
1980
1990
2000
2010
2020
2030
2040
2050
2060
2070
2080
2090
2100
a) b)
0-14 15-24 25-49 50-69 70-100+ total world DEU JPN KOR USA BRA CHN IND RUS
Fig. 1: a) The world population growth rate decreased from +2 % in the 1970s toMineral Raw Materials World of Mining – Surface & Underground 72 (2020) No. 5
Fig. 2:
100
Primary energy consumption of
selected countries of the EU, BRI- 80
energy mix [%]
ICS, as well as Australia, Canada,
Japan and USA in 2018 as per- 60
centage; CO2 emissions in metric
40
tons per capita and percentage on
global CO2 emissions in brackets 20
(in 2018) (energy data from [7],
CO2 data per capita from [8]) 0
Abb. 2:
Prozentualer Anteil des Primären-
ergieverbrauchs ausgewählter
Länder der EU, BRIICS, sowie von
Australien, Kanada, Japan und
den USA nach Primärenergiever-
brauch im Jahr 2018; in Klammern
der CO2-Ausstoß in metrischen coal % oil % gas % hydro % nuclear % renewable %
Tonnen pro Kopf und der prozen-
tuale Anteil am globalen CO2-Ausstoß (Stand 2018) (Energiedaten aus [7], CO2-Daten pro Kopf aus [8])
Table 1:
Raw material consumption of Wind Solar
wind- and photovoltaic energy kg/MW DD-EESG DD-PMSG GB-DFIG PV-all c-Si a-Si CdTe CIGS
plants providing renewable ener-
concrete 369,000 243,000 355,000 60,700
gies (raw materials from [11], *from
[12]). DD-EESG – direct drive steel 132,000 119,500 113,000 67,900
electrically excited synchronous polymers/plastic 4,600 4,600 4,600 8,600
generator, DD-PMSG – direct
glass/carbon 8,100 8,100 7,700 46,400
drive permanent magnet synchro- composites
nous generator, GB-DFIG – gear
box with doubly fed induction aluminum 700 500 1,400 7,500
generator, PV – photovoltaic, boron 6
c-Si – monocrystalline silicon cell, cadmium 50
a-Si – amorphous silicon cell,
chromium 525 525 470
CdTe – cadmium tellur solar cell,
CIGS – copper indium gallium copper 5,000 3,000 1,400 4,600 884* 22
diselenid solar cell. dysprosium 6 17 2
Tab. 1: gallium 4
Derzeitiger Rohstoffbedarf für
Windkraft- und Solarenergieanla- germanium 48
gen der erneuerbaren Energieträ- indium 15
ger (Rohstoffbedarf aus [11], *aus iron (cast) 20,100 20,100 18,000
[12]). DD-EESG Direktantrieb mit
manganese 790 790 780
elektrisch angeregtem Synchron-
generator, DD-PMSG Direktantrieb molybdenum 109 109 99
mit Permanentmagnetgenerator neodymium 28 180 12
(offshore), GB-DFIG Getriebe-
nickel 340 240 430
antrieb mit doppeltgespeistem
Asynchrongenerator (onshore), praesodymium 9 35
PV Photovoltaik, c-Si monokri- selen 35
stalline Siliziumzelle, a-Si amorphe silicon 4,000 150
Siliziumzelle, CdTe Cadmiumtellu-
rid-Solarzelle, CIGS Kupfer-Indi- silver 20
um-Gallium-Diselenid-Solarzelle. tellurium 52
terbium 1 7
zinc 5,500 5,500 5,500
total 546,808 406,209 508,393 195,700 4,020 198 102 76
current output of 0.73 TW is forecast to 6.2 TW in 2050 with 2050 etwa 30 % der Primärenergie decken, während durch die
an electricity production of 18.5 PWh/a (currently 1.3 PWh/a, Energiewende der Anteil an Wind- und Solarenergie bis 2050 um
2017) [6]. den Faktor 14 bzw. 30 ansteigen wird [6].
Global growth in population and prosperity, new technologies Um den Rohstoffbedarf der Windkraft- und Solarenergieanlagen
and political measures for the energy transition are leading to an mit einer Lebensdauer von etwa 20 bis 30 Jahren zu decken,
increasing demand of raw materials with increasing per capita sind unterschiedlichste organische, mineralische und metallische
256World of Mining – Surface & Underground 72 (2020) No. 5 Mineral Raw Materials
German total energy consumption 2018: 13106 PJ
natural gas natural oil German renewable energy proportion
3071 PJ, 23% 4452 PJ, 34% waste 1%
biofuels 0.9%
solar heat 0.2%
geothermal 0.1%
photo voltaics 1.3%
heat pump 0.4% biomass 6.4%
hydropower 0.5%
hard coal
1428 PJ, 11%
2018 †
wind 3.0%
lignite
1476 PJ, 11% renewables
2038 † 1804 PJ, 14%
nuclear
829 PJ, 6% others
2022 † 46 PJ, 0.35%
Fig. 3: German primary energy raw materials in peta-joule (1015 J) with a contribution of 1.3 % PV and 3 % wind energy [5]
Abb. 3: Energierohstoffe des deutschen Primärenergieverbrauchs in Petajoule (1015 J) mit einem Anteil von 1,3 % Photovoltaik und 3 % Windenergie [5]
900 9,000
800 8,000
700 7,000
Cu, Fe, glass [t/MW]
concrete [t/MW]
600 6,000
500 5,000
400 4,000
Fig. 4:
300 3,000
Raw material volume in tons of
200 2,000 copper, iron, glass and concrete
100 1,000 per generated energy in mega-
watts after [9]; CSP – concen-
0 0 trated solar power
Abb. 4
Rohstoffmenge in Tonnen von
Kupfer, Eisen, Glas und Beton
pro erzeugte Energie in Megawatt
Fe [t/MW] Cu [t/MW] glass [t/MW] concrete [t/MW] nach [9]; CSP – concentrated
solar power
consumption. Accordingly, the global extraction of metallic ores Rohstoffe notwendig (Tabelle 1). Dabei ist die Rohstoffmenge
will more than double from 9 Gt (2017) to 20 Gt in 2060 [2]. While pro Megawatt (Mineralintensität) bei den wenig energiedichten,
the global proportion of natural gas will cover around 30% of erneuerbaren Solar- und Windenergien wesentlich höher und die
primary energy in 2050, the proportion of wind and solar energy Lebensdauer kürzer als die Energiegewinnung durch Kohlenwas-
will increase by a factor of 14 and 30 respectively by 2050 [6]. serstoffe und Atomkraft [9] (Abbildung 4). Daher geht Drexhage
A wide variety of organic, mineral and metallic raw materials are et al. [10] bei Einhaltung des +2-°C-Ziels von einem Anstieg des
required for wind power and solar energy systems with an end-of- Metallbedarfs durch erneuerbare Energien von 250 bis 300 % aus.
life of around 20 to 30 years (Table 1). The amount of raw materials
per megawatt (mineral intensity) is significantly higher and the end- 3 Verfügbarkeit
of-life shorter for the less energy-dense, renewable solar and wind
3.1 Verfügbarkeit durch Exploration und Bergbau
energies, compared to energy generated by hydrocarbons and
nuclear power [9] (Figure 4). Thus, Drexhage et al. [10] assumes Zahlreiche nationale und internationale Studien zeigen regelmäßig
an increase in metal demand from renewable energies of +250 die Kritikalität von Rohstoffen auf, geologische Engpässe sind da-
to 300 % if the +2 °C target is met. bei nicht abzusehen [13]. Trotz zahlreicher, kritisch gelisteter Roh-
stoffe zeigen die Marktdaten bisher auf einen Käufermarkt ohne
3 Supply langfristige Lieferengpässe, selbst bei einer Konzentration von
Rohstoffen auf wenige Lieferländer mit hohem Länderrisiko [14].
3.1 Supply by exploration and mining
Oft wird das schwindende Angebot an metallischen Rohstoffen
Several national and international studies regularly show the criti- mit der Verringerung des Erzgehaltes erklärt. Dabei wird häufig
cality of raw materials, geological shortages are not yet foreseeable nicht die Entwicklung neuer Technologien berücksichtigt, die einen
[13]. Despite numerous raw materials listed as critical, the market ökonomischeren Abbau von weniger angereicherten Erzen aus
257Mineral Raw Materials World of Mining – Surface & Underground 72 (2020) No. 5
data so far indicate a buyer‘s market without long-term supply technischen Gründen ermöglichen. Hierzu gehört der Großtonna-
bottlenecks, even with a concentration of raw materials in a few geabbau, oder auch die vermehrte Gewinnung von möglichen
supplier countries with a high country risk [14]. Nebenprodukten aus der Lagerstätte und dem Abraum [15].
The dwindling supply of metallic raw materials is often explained Einige Studien zeigen auf, dass die bekannten Kupferreserven
by the reduction in ore content. In doing so, the development of durch den erhöhten Kupferbedarf, davon ein Großteil für die
new technologies that prefer a more economical mining of less Energiewende mit geschätzten 550 Mio. t, bis 2050 erschöpft
enriched ores for technical reasons is often not considered. This sein würden (z.B. [16]). Dies wären rund 80 % des bisher in
includes the mining of large tonnages or the increased extraction der Menschheitsgeschichte produzierten Kupfers von etwa
of potential joint products from the deposit and tailings [15]. 700 Mio. t [17]. Dabei werden aber häufig die dynamischen
Some studies show that the known copper reserves would be Mechanismen durch neue Funde und neue Technologie nicht
exhausted by 2050 due to the increased copper demand, a large berücksichtigt [18]. Kesler & Wilkinson [19] ermitteln, dass bei
part of it for the energy transition with an estimated 550 million tons einer Erweiterung des technisch möglichen Tiefbergbaus von
(e.g. [16]). This would be around 80 % of the copper produced 1 km auf 3,3 km beispielsweise Kupfervorräte für die nächsten
so far in human history of around 700 million tons [17]. However, 5500 Jahre vorhanden seien.
several studies do not consider the dynamic mechanisms due to Die Aufsuchung und Gewinnung gehen mit hohen Risiken, langen
new discoveries and new technology [18]. In contrast, Kesler & Vorlaufzeiten und großen Investitionen einher. Die Erfolgsquoten
Wilkinson [19] determine copper reserves for the next 5500 years liegen bei 1 bis 5 % (Braunfeldexploration im Umfeld einer be-
when the technically possible underground mining is expanded kannten Lagerstätte) und 0,03 bis 5 % (Grünfeldexploration in
from 1 km to 3.3 km. unbekanntem Gebiet). Anschließend wird die Mine über 5 bis 15
Exploration and production involve high risks, long lead times and Jahre bis zum Abbau mit einer Investition für Abbau und Aufbe-
large investments. The success rates are 1 to 5 % (brown field reitung von mehreren hundert Millionen bis zu einer Milliarde USD
exploration in the vicinity of a known deposit) and 0.03 to 5 % bei langfristig gebundenem Kapital entwickelt.
(green field exploration in an unknown area). The deposit will then In Deutschland wird derzeit kein Metallbergbau betrieben, den-
be developed over 5 to 15 years to mining with an investment in noch sind Metalllagerstätten vorhanden, die unter geeigneten
mining and processing of several hundred million to one billion politischen und rechtlichen Bedingungen auch wirtschaftlich
US dollars with long-term capital. produzieren könnten. International agierende, große deutsche
There is currently no metal mining in Germany, however metal Unternehmen im Metallbergbau und Rohstoffhandel wurden vor
deposits could also produce economically under suitable political der Jahrtausendwende veräußert und die Kerngeschäfte der
and legal conditions. Globally operating large German companies Unternehmen umstrukturiert. Im Bereich der Massen- und Ener-
in metal mining and raw materials trading were sold before the gierohstoffe sind international operierende Bergbaufirmen noch
turn of the millennium and the company‘s core businesses were in Deutschland ansässig und setzen technisch anspruchsvollen
restructured. With respect to bulk and energy raw materials, inter- Großbergbau erfolgreich um. Zudem stellen zahlreiche klein- und
nationally operating mining companies are still based in Germany mittelständische Unternehmen die Versorgung mit heimischen
and successfully implement technically demanding large-scale Rohstoffen für die Industrie sicher.
mining. In addition, numerous small and medium-sized companies
ensure the supply of domestic raw materials for industry. 3.2 Verfügbarkeit durch Verhüttung und Raffination
Die Verhüttung (Gewinnung des Metalls aus dem Erz) und Raffina-
3.2 Availability through smelting and refining tion (Erhöhung der Metallkonzentration) beschränkt sich nicht nur
Smelters (extraction of the metal from the ore) and refineries (in- auf die Gewinnung von Metallen aus dem Erz, sondern erhöht das
creasing the metal concentration) not only allow the extraction of Recycling von Schrott und die Kreislaufführung. Das heimische
primary metals from mined ore, but also the recycling of scrap in Verhütten und die Raffination ermöglichen die Entwicklung neuer
the circular economy. The domestic smelting and refining enables Technologien und Produkte unter höchsten Umweltstandards
the development of new technologies and products at highest und direkten Zugang zu (kritischen) Metallen. Dazu ist das ge-
environmental standards and direct access to (critical) metals. This samte Spektrum an Anlagen für die Verhüttung und Raffination
requires the entire range of smelters and refineries of all carrier der Trägermetalle notwendig, um gleichzeitig weitere Metalle als
metals in place, which also allows to recover potential (critical) Nebenprodukte aus der Schmelze zu gewinnen. Zahlreiche Metalle
potential joint elements extracted during processing. Numerous für Windkraft- und Solarenergieanlagen werden als Nebenprodukt
metals for wind power and solar energy systems are extracted bei der Zink- (Ga, In), Aluminium- (Ga) und Kupferraffination (Se,
as a by-product of zinc (Ga, In), aluminum (Ga) and copper (Se, Te) gewonnen, eine Gewinnung aus Lagerstätten gibt es nicht.
Te) refining; there is no extraction from deposits. Due to the lack Mangels technischer Anlagen kann bislang keine Raffination von
of technical facilities, it is not yet been possible to refine rare Seltenerdelementen und Lithium in Europa erfolgen, sodass eine
earth elements and lithium in Europe, so that Europe is 100 % 100%-ige Importabhängigkeit Europas besteht.
dependent on imports. Auch das Recycling und die Kreislaufwirtschaft können nur durch
Recycling and the circular economy can only be implemented eine vollständige Infrastruktur von Verhüttung und Raffination um-
through a full smelting and refining infrastructure [20]. Currently gesetzt werden [20]. Derzeit werden z.B. nur etwa 0,7 Mio. t der
e.g. only around 0.7 mill. t of the around 2 mill. t of waste electri- jährlich etwa 2 Mio. t Elektroaltgeräte in Deutschland gesammelt
cal and electronic equipment collected annually in Germany are und in den Recylingprozess überführt, etwa 0,4 Mio. t werden pro
transferred to the recycling process, around 0.4 mill. t are illegally Jahr illegal ausgeführt [21]. Ein illegaler Materialabfluss reduziert
exported each year [21]. An illegal outflow of materials reduces die europäischen Recylingkapazitäten und die Ausbeute an Roh-
the European recycling capacities and the yield of raw materials stoffen (z.B. Gewinnung von ca. 25 % des Golds aus Leiterplatten
(e.g. approx. 25 % extraction of gold from circuit boards in the im „Hinterhof“ vs. 95 % bei einem industriellen Recycler [22]).
“backyard” vs. 95 % at an industrial recycler [22]). In Deutschland sind Anlagen zur Verhüttung und Raffination von
Germany hosts plants for the smelting and refining of copper, Kupfer, Eisen, Stahl, Nickel, Blei, Zink und Titan im Betrieb. Jedoch
iron, steel, nickel, lead, zinc and titanium. However, smelters are werden Hütten verkauft oder befinden sich durch die COVID-19 in-
being sold or are in insolvency proceedings due to the COVID-19 duzierte Wirtschaftskrise im Insolvenzverfahren (Harz-Metall GmbH
induced economic crisis (Harz-Metall GmbH Pb-Zn Recycling, Pb-Zn Recycling, Metallwerke Dinslaken GmbH als Zn-Recycler,
258World of Mining – Surface & Underground 72 (2020) No. 5 Mineral Raw Materials
Metallwerke Dinslaken GmbH as Zn-Recycler, Norzinco GmbH, Norzinco GmbH, PPM Pure Metals GmbH für Ga, Ge, In, Norden-
PPM Pure Metals GmbH for Ga, Ge, In, Nordenhamer Bleihütte hamer Bleihütte (Weser-Metall GmbH) Pb-Hütte und -Recycler).
(Weser-Metall GmbH) Pb smelter and recycler).
4 Strategien ausgewählter
4 Strategies of selected emerging Schwellen- und Industrieländer
and industrialized countries
4.1 China
4.1 China
China investiert global in den Rohstoffsektor und stellt durch den
China invests globally in the raw materials sector, and ensures its Zugang zu Energie- und Metallrohstoffen seine wirtschaftliche Ent-
economic development through access to energy and metals raw wicklung sicher (Abbildung 5). China ist national und international
materials (Figure 5). China is a national and international leader führend bei der Bergbauförderung und der Verhüttung sowie Raffi-
in mining, smelting and refining such as of rare earth metals, or nation wie z.B. von Seltenerdmetallen, oder kauft sich international
buys internationally in mining and refining. According to AEI [23], in Bergbau und Raffination ein. Laut AEI [23] investierte China in
China has invested around USD 340 bn abroad in the sectors den letzten 14 Jahren im Ausland im Bereich Metalle, Erdöl/Erdgas
of metals, oil/natural gas and coal in the last 14 years (Figure 5). und Kohle etwa 340 Mrd. USD (Abbildung 5). Chinesische Roh-
Chinese raw material companies such as Zijn Mining (world # 6, stofffirmen wie die Zijn Mining (Welt #6, 16,3 Mrd. USD Umsatz),
USD 16.3 bio. revenue), China Shenshuan Energy (world # 4, China Shenshuan Energy (Welt #4, Kohle, 37,6 Mrd. USD Umsatz)
coal, USD 37.6 bn revenue) and China National Petroleum CNPC und China National Petroleum CNPC (Welt #3, 392 Mrd. USD
(world # 3, USD 392 bn revenue), Sinopec (world # 1, USD 414 bn Umsatz), Sinopec (Welt #1, 414 Mrd. USD Umsatz) und andere
revenue) and others are among the largest companies in the world gehören zu den größten Unternehmen weltweit und sind global
and operate globally. Investments in mining are also in Europe, tätig. Investitionen in den Bergbau fließen auch nach Europa; so
where Zijn Mining acquired 63 % of the RTB Bor copper deposit erwarb z.B. die Zijn Mining im Jahr 2018/2019 63 % der RTB Bor
and smelting and 100 % of the Timok mine in Serbia for almost Kupferlagerstätte und Verhüttung sowie 100 % der Timok-Mine
USD 2.5 bn in 2018/2019). in Serbien für knapp 2,5 Mrd. USD.
China stocks raw materials through numerous mines, smelters and China hält Rohstoffe durch zahlreiche Minen, Hütten und Raf-
refiners at home and abroad. The Belt and Road Initiative develops fination im In- und Ausland vor. Mit der Belt and Road Initiative
military secured global trading routes. The “Made in China 2025” werden globale Handelswege ausgebaut und militärisch gesichert.
40,000
35,000
30,000
25,000
mill. USD
20,000
15,000
Fig. 5:
10,000
International purchases of Chinese
5,000 companies in the sectors of met-
als, oil/gas and coal (from [23])
0
Abb. 5:
2005 2006 2007 2008 2009 2010 2011 2012 2013 2014 2015 2016 2017 2018 2019
Internationale Zukäufe chine-
metals oil coal sischer Firmen im Bereich Metalle,
Erdöl/Erdgas und Kohle (aus [23])
1,400,000
1.39 mio.
350,000
300,000
patent applications
250,000
200,000
150,000
100,000 Fig. 6:
50,000 Patent applications at large patent
offices in 2018 (data from [24])
0 (EPO – European Patent Office
Abb. 6:
Patentanmeldungen der großen
Patentämter im Jahr 2018 (Daten
office
aus [24]) (EPO – European Patent
by residents from abroad
Office)
259Mineral Raw Materials World of Mining – Surface & Underground 72 (2020) No. 5
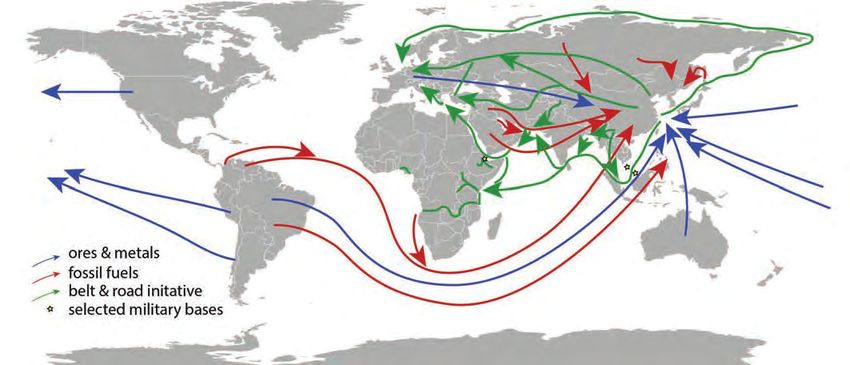
Fig. 7: The Belt & Road Initiative is a diversification of marine and continental trade routes from China to Europe and includes the construction
and purchase of harbors and railways (green arrows) – material flow of large suppliers of fossil energy (red arrows), ore and metals (blue
arrows) to China
Abb. 7: Belt & Road Initiative als maritime and kontinentale Handelswege Chinas nach Europa mit Bau und Erwerb von Häfen und Eisenbahnen
(grüne Pfeile) – Stoffströme der großen Lieferanten fossiler Energie (rote Pfeile) sowie Erze und Metalle (blaue Pfeile) nach China
strategy replaces foreign knowledge with domestic knowledge Die „Made in China 2025“ Strategie ersetzt ausländisches durch
[24] (Figure 6) and, with the “China 2049” strategy, China aims to inländisches Wissen [24] (Abbildung 6) und mit der Strategie
become the world’s innovation and market leader in selected high „China 2049“ will China in ausgewählten Hochtechnologien bis
technologies by 2049. With the ice-free Northeast Passage, the zum Jahr 2049 Innovations- und Weltmarktführer werden. Mit
distance to the European markets will be reduced from 23,800 km der eisfreien Nordostpassage wird die Distanz von China zu den
to 15,600 km and transport costs will be reduced (Figure 7). At the europäischen Märkten von 23 800 km auf 15 600 km verkürzt
same time, China‘s access to raw materials and markets in the und die Transportkosten reduziert (Abbildung 7). Gleichzeitig wird
Russian Arctic will be facilitated both by the Northeast Passage China durch die Nordostpassage und die Sanktionen der EU und
and the EU and US sanctions against Russia. der USA gegen Russland der Zugang zu Rohstoffen und Märkten
der russischen Arktis erleichtert.
4.2 Germany
4.2 Deutschland
The decrease in domestic production of crude oil and natural gas,
triggered by the fracking moratorium, has reduced the revenue Durch die Abnahme der heimischen Förderung von Erdöl und
generated by domestic mining (Figure 8). In the field of mineral Erdgas, ausgelöst durch das Fracking-Moratorium, sinkt der Anteil
raw materials, there are still large companies based in Germany des durch den heimischen Bergbau erwirtschafteten Umsatzes
and operating internationally, such as Knauf AG (€ 10 bn revenue), (Abbildung 8). Im Bereich mineralischer Rohstoffe sind noch große,
HeidelbergCement AG (€ 18.8 bn revenue), K + S AG (€ 4 bn in Deutschland ansässige Unternehmen wie Knauf AG (10 Mrd. €
revenue). Energy and geo-organic raw materials for the chemical Umsatz), HeidelbergCement AG (18,8 Mrd. € Umsatz), K+S AG
industry are explored nationally and internationally by the last (4 Mrd. € Umsatz) u.a. international tätig. Energierohstoffe und
16
14
12
revenue [bn € ]
10
8
6
4
Fig. 8: 2
Revenue of domestic raw materi-
als in Germany (data from [26]) 0
Abb. 8: 2012 2013 2014 2015 2016
Umsatz der heimischen Rohstoffe oil and gas coal mining rocks & minerals others
in Deutschland (Daten aus [26])
260World of Mining – Surface & Underground 72 (2020) No. 5 Mineral Raw Materials
large German based Wintershall Dea GmbH (€ 5.9 bn revenue). geoorganische Rohstoffe für die chemische Industrie werden
Most of the few international ore deposits held by German-based noch von der letzten großen in Deutschland ansässigen Firma
companies were sold, most recently; e.g. by Lanxess AG (chrome Wintershall Dea GmbH (5,9 Mrd. € Umsatz) national und inter-
deposit in South Africa) in 2020 and Cronimet Mining GmbH national gewonnen. Die wenigen von in Deutschland ansässigen
(Armenia and South Africa) in 2019. Firmen betriebenen Metalllagerstätten wurden von Lanxess AG
The German raw materials agency DERA, established in 2010, (Chromlagerstätte in Südafrika) 2020 und der Cronimet Mining
and the Helmholtz Institute Freiberg for Resource Technology, GmbH (Armenien und Südafrika) 2019 verkauft.
established in Freiberg in 2011, were initiated by the German Raw Die von der Bundesregierung im Rahmen der deutschen Rohstoff-
Material Strategy and deliver excellent contributions to market strategie im Jahr 2010 etablierte Deutsche Rohstoffagentur DERA
transparency and the development of new technologies. The und das im Jahr 2011 in Freiberg gegründete Helmholtz-Institut
diversification of supply chains through bilateral raw materials Freiberg für Ressourcentechnologie leisten hervorragende Bei-
agreements between the federal German government and Chile träge zur Markttransparenz und Entwicklung neuer Technologien.
(2013), Kazakhstan (2012), Mongolia (2013) and Peru (2014) and Die Diversifizierung von Lieferketten durch bilaterale Rohstoff-
further contracts with Australia, Canada and Ghana have not yet abkommen des Bundes mit Chile (2013), Kasachstan (2012),
led to significant investments in international mining [25]. der Mongolei (2013) und Peru (2014) sowie weitere Verträge mit
Australien, Kanada und Ghana führten bisher nicht zu signifikanten
5 Discussion Investitionen in den internationalen Bergbau [25].
5.1 Diversification 5 Diskussion
China, Japan, Korea and the USA stockpile strategic metals. They
acquire ore deposits, shares in mines, smelters and refineries, and
5.1 Die Diversifizierung
support national companies in the international acquisition of raw China, Japan, Korea und die USA halten strategische Metalle
material projects. in Lagerhaltung vor. Sie erwerben global Lagerstätten, Anteile
Stockpiling in Germany is limited to crude oil, natural gas and an Minen, Hütten und Raffinationen, und unterstützen nationale
petroleum products for national crisis prevention. There are no Firmen bei der internationalen Akquise von Rohstoffprojekten.
longer large, internationally active companies in ore mining and Die Lagerhaltung in Deutschland beschränkt sich auf Erdöl, Erdgas
raw materials trading based in Germany. The smelting and refining und Erdölerzeugnisse zur nationalen Krisenvorsorge. Große, inter-
of primary and secondary raw materials in Germany and Europe national tätige Unternehmen im Erzbergbau und Rohstoffhandel
allows the provision of pure metals. The raw material country gibt es in Deutschland nicht mehr. Die Verhüttung und Raffination
Germany is still home to internationally active companies in the von Primär- und Sekundärrohstoffen in Deutschland und Euro-
field of bulk raw materials and fossil fuels. A growth in a raw ma- pa erlaubt die Vorhaltung von Reinmetallen. Das Rohstoffland
terials company in the metals sector is not evident. Accordingly, Deutschland beheimatet noch internationale tätige Unternehmen
the resilience of the German raw materials strategy should be im Bereich Massenrohstoffe und fossile Energieträger, jedoch ist
critically evaluated in comparison to other industrialized countries. ein Wachstum eines Rohstoffunternehmens im Bereich Metalle
The EU [27] recognized the lack of resilience in its supply chains nicht erkennbar. Entsprechend sollte die Resilienz der deutschen
and is planning among others in its current strategy: (i) The refining Rohstoffstrategie im Vergleich zu anderen Industrieländern kritisch
of rare earth metals in Europe, the (ii) procurement of critical raw evaluiert werden.
materials within the EU, the (iii) diversification of the raw material Die EU [27] erkannte die fehlende Resilienz ihrer Lieferketten und
supply with selected countries. A national raw material strategy plant in ihrer aktuellen Strategie u.a. (i) die Raffination von Selte-
is not superfluous because manufacturing is high in the industrial nerdmetallen in Europa, die (ii) Beschaffung von kritischen Roh-
country Germany is high and the raw material required for the Ger- stoffen innerhalb der EU, die (iii) Diversifizierung der Rohstoffversor-
man energy transition differs from that of other countries (see Figure gung mit ausgewählten Ländern. Eine nationale Rohstoffstrategie
2). In the automotive industry, supply contracts are concluded erübrigt sich nicht, da der Produktionsanteil des Industriestandorts
to ensure the supply of raw materials for the mobility transition. Deutschland hoch ist und sich der Rohstoffbedarf Deutschlands
Whether further backward integration into other branches of indus- für die Energiewende von dem anderer Länder unterscheidet (s.
try promises successful business models may be questioned. The Abbildung 2). In der Automobilindustrie werden für die Mobilitäts-
necessary conditions to support entrepreneurial activity in the field wende Lieferverträge zur Sicherung der Rohstoffverfügbarkeit
of mining, smelting and refining should be identified and adapted. geschlossen. Ob eine weiterführende Rückwärtsintegration in
andere Industriezweige erfolgreiche Geschäftsmodelle verspricht,
5.2 Know-how kann hinterfragt werden. Die notwendigen Randbedingungen,
Access to metallic raw materials through the rebuilding and buildup unternehmerisches Handeln im Bereich Bergbau, Verhüttung und
of globally active companies hosted in Germany has so far not Raffination zu fördern, sollten identifiziert und angepasst werden.
been successful and entrepreneurial activities remain low [25]. In
terms of primary energy, fossil fuels still contribute around 80 % to 5.2 Die Kompetenz
the country’s primary energy supply (see Figure 3). In contrast to Ein Zugang zu metallischen Rohstoffen durch den Wiederauf-
companies in the field of metallic raw material extraction, a globally und Ausbau von global tätigen und in Deutschland ansässigen
operating company with expertise in securing the primary energy Unternehmen war bislang nicht erfolgreich und unternehmerische
supply (i.e. transitional energy carriers natural gas, blue hydrogen Aktivitäten bleiben gering [25]. Bei der Primärenergie tragen fossile
and CO2 storage) is still based in Germany. It remains to be seen Energieträger noch zu etwa 80 % zur Primärenergieversorgung in
whether exploration and production can further evolve. Deutschland bei (s. Abbildung 3). Im Gegensatz zu nicht vorhan-
Some institutes in Germany provide a research spectrum on denen Firmen im Bereich der metallischen Rohstoffgewinnung ist
exploration, mining, smelting and refining. Few German based noch ein global operierendes Unternehmen mit Kompetenzen zur
companies, however, lead to reduced interaction within the knowl- Sicherung der Primärenergieversorgung (Übergangsenergieträger
edge triangle of education, research and business. Accordingly, the Erdgas, blauer Wasserstoff und CO2-Speicherung) in Deutschland
young generation‘s interest in working in the raw materials sector beheimatet. Ob sich die negative Entwicklung von Firmen im Be-
will continue to decline and it will be more difficult to maintain skills. reich Exploration und Produktion weiter fortsetzt bleibt abzuwarten.
261Mineral Raw Materials World of Mining – Surface & Underground 72 (2020) No. 5
120 620
100 600
occupation services
other occupations
580
80 560
60 540
40 520
500
20 480
0 460
Fig. 9: 1990 1994 1998 2002 2005 2009 2013 2017
Occupation of representatives of beginning of elec�on period
the German Bundestag [28]
agriculture, foresty, horticulture miners
Abb. 9:
Zusammensetzung des Deut- manufacturing technical
schen Bundestags nach Berufs-
others services
gruppen [28]
A limited education of the population on the interrelation of raw Einige Forschungsinstitute halten in Deutschland ein Forschungs-
materials, recycling and prosperity results in a lack of knowledge. spektrum zu Exploration, Bergbau, Verhüttung und Raffination
In the German Bundestag, too, the proportion of parliamentarians vor. Wenige in Deutschland basierte Unternehmen führen jedoch
with a professional background in craft and technical fields has zur reduzierten Interaktion im Wissensdreieck Bildung, Forschung
been falling since 1990 from 22 % to currently 14% [28] (Figure 9). und Wirtschaft. Entsprechend wird Innovation sowie das Interesse
A well-founded, neutral exchange of information, such as through der jungen Generation an einer Tätigkeit im Rohstoffsektor weiter
the association RawMaterialKnowledge! e.V. aims to contribute sinken und der Erhalt von Kompetenzen erschwert.
to an objective discussion. Eine begrenzte Bildung der Bevölkerung zu den Zusammenhängen
Object-oriented discourses with fact-based solutions become von Rohstoff, Recycling und Wohlstand resultiert in mangelnder
less popular even in Western democracies, the science journal- Kenntnis. Auch im Deutschen Bundestag sinkt der Anteil der Par-
ist Ranga Yogeshwar talks about “event management by media lamentarier mit einem beruflichen Hintergrund aus handwerklichen
companies”. Words like crisis (climate crisis, raw material crisis, und technischen Bereichen seit 1990 von 22 % auf derzeit 14 %
energy crisis) and overpopulation in a yet unprecedented time of [28] (Abbildung 9). Eine fundierte, neutrale Informationsvermitt-
peace and global prosperity lead to fears that can limit scientifically lung wie durch RohstoffWissen! e.V. soll zu einer versachlichten
based discussions and innovation. The Baden State Councilor Diskussion beitragen.
Carl Friedrich Nebenius (1784-1857), however, had already written Sachorientierte Diskurse mit faktenbasierten Lösungen finden
about the overpopulation of the Grand Duchy of Baden; the pop- selbst in westlichen Demokratien weniger Zuspruch, der Wissen-
ulation of the city of Karlsruhe rose from 10,597 in 1810 to 23,484
schaftsjournalist Ranga Yogeshwar redet von einer „Ereignisbe-
in 1840, today 313,092 inhabitants – that “only a more skillful use
wirtschaftung der Medienunternehmen“. So führen Worte wie Krise
of the production aids is able to avert the unforeseeable conse-
(Klimakrise, Rohstoffkrise, Energiekrise) und Überbevölkerung in
quences of the overpopulation of Baden ”(from [29]: pp. 34-35).
einer bislang nie dagewesenen Zeit des Friedens und globalen
Wohlstands zu Ängsten, die wissenschaftlich fundierte Diskus-
6 Outlook sionen und Innovation einschränken können. Dabei hatte schon
Resilient supply chains are essential for supplying raw materials der badische Staatsrat Carl Friedrich Nebenius (1784-1857) zur
to an industrial country like Germany. However, the number of Überbevölkerung des Großherzogtums Baden – die Bevölkerung
large, internationally operating companies in the mining, smelt- Karlsruhes stieg von 10 597 im Jahr 1810 auf 23 484 in Jahr
ing and refining sector is continuing to decrease and the applied 1840, heute 313 092 Einwohner – geschrieben, dass „allein ein
competence is dwindling. geschickterer Gebrauch der Hilfsmittel der Produktion imstande
Recycling technology can only deliver a limited amount of the sei, die unabsehbaren Folgen der Überbevölkerung Badens ab-
raw material volume need for an industrial country like Germany. zuwenden“ (aus [29]: S. 34-35).
In addition to investments in recycling technologies, innovative
technologies for exploration, extraction, smelting and refining of 6 Ausblick
primary raw materials need to be developed in order to provide Für die Rohstoffversorgung des Industriestandorts Deutschland
competitive and environmentally-friendly products and establish sind resiliente Lieferketten essentiell. Die Anzahl großer, interna-
resilient supply chains. tional agierender Unternehmen im Bereich Bergbau, Verhüttung
Smelting and refining ensure the production of pure metals using und Raffination verringert sich jedoch und die angewandte Kom-
primary raw materials and scrap. The production of pure metals also petenz schwindet.
increases the volume of stockpiling. Without smelting and refining, Die Recycling-Technologie kann nur eine begrenzte Menge der
there is no recycling and therefore no expansion of relevant skills. Rohstoffe für den Industriestandort Deutschland liefern. Neben Inves-
With increasing protectionism, also in Western countries, the urge titionen in Recyclingtechnologien sind innovative Technologien der
to protect free trade is dwindling. Free trade and innovation are Aufsuchung, Gewinnung, Verhüttung und Raffination von Primärroh-
the guarantee for a resilient supply of raw materials. stoffen zu entwickeln, um wettbewerbsfähige und umweltfreundliche
Produkte anbieten und resiliente Lieferketten erhalten zu können.
Acknowledgement
Verhüttung und Raffination sichern die Produktion von Reinme-
C.H. thanks his colleagues from the ThinkTank Industrial Re- tallen durch Primärrohstoffe und Schrott. Durch die Gewinnung
sources Strategies J. Kolb, M. Schmidt and K. Steinmüller as well von Reinmetallen wird auch die Lagerhaltung erhöht. Ohne Ver-
262World of Mining – Surface & Underground 72 (2020) No. 5 Mineral Raw Materials
as his colleagues from RohstoffWissen!, associations and industry hüttung und Raffination ist kein Recycling und somit kein Ausbau
for many discussions on raw materials and required strategies. entsprechender Kompetenzen möglich.
We thank K. Steiger and A. Monsees for technical assistance to Mit zunehmendem Protektionismus auch westlicher Staaten
complete this manuscript. schwindet der Drang, den freien Handel schützend zu begleiten.
Freier Handel und Innovation sind der Garant für eine resiliente
Rohstoffversorgung.
Danksagung
References/Literatur
C.H. dankt den Kollegen des ThinkTank Industrielle Ressour-
[1] Weltbank (2020): Minerals for climate action: The mineral censtrategien J. Kolb, M. Schmidt sowie K. Steinmüller, den
intensity of the clean energy transition. – World Bank Kollegen von RohstoffWissen!, Verbänden und Firmen für zahl-
Publications, Washington. reiche Diskussionen zum Thema Rohstoff und Strategien. Frau
[2] OECD (2019): Global Material Resources Outlook to 2060: K. Steiger und Herrn A. Monsees wird herzlich für die technische
Economic Drivers and Environmental Consequences. – Unterstützung bei Anfertigung des Manuskripts gedankt.
OECD Publishing, Paris.
[3] UN (2020): World population prospects 2019. – URL:
https://population.un.org/wpp/Download/Standard/Pop-
ulation/
much-copper-has-been-found-world?qt-news_science_
[4] OECD (2020): GDP long-term forecast. – URL: https:// products=0#qt-news_science_products
data.oecd.org/gdp/gdp-long-term-forecast.htm
[18] Castillo, E. & Eggert, R. (2020): Reconciling diverging
[5] BMWI (2019): Energiedaten: Gesamtausgabe. – URL: views on mineral depletion: A modified cumulative availabil-
https://www.bmwi.de/Redaktion/DE/Downloads/Energie- ity curve applied to copper resources. – Resources, Con-
daten/energiedaten-gesamt-pdf-grafiken.pdf?__blob=pu- servation and Recycling 161: 104896 – DOI: 10.1016/j.
blicationFile&v=34 resconrec.2020.104896
[6] DNV-GL (2020): Energy transition outlook 2020 – a global [19] Kesler, S.E. & Wilkinson, B.H. (2008) Earth’s copper
and regional forecast to 2050. resources estimated from tectonic diffusion of porphyry
[7] BP (2019): Statistical review of world energy. https:// copper deposits. – Geology 36: 255-258.
www.bp.com/content/dam/bp/business-sites/en/global/ [20] Reuter, M.A., van Schaik, A., Gutzmer, J., Bartie, N. &
corporate/pdfs/energy-economics/statistical-review/bp- Abadías-Llamas, A. (2019): Challenges of the Circular
stats-review-2019-full-report.pdf Economy: A Material, Metallurgical, and Product Design
[8] Crippa, M. et al. (2019): Fossil CO2 and GHG emissions Perspective. — Annual Review of Materials Research 49:
of all world countries, 2019 report. – EUR 29849 EN, 253-274.
Publications Office of the European Union, Luxembourg, [21] Deutsche Umwelthilfe (2020): Illegaler Export von Elek-
2019. - ISBN 978-92-76-11100-9. troschrott: Deutsche Umwelthilfe fordert Umsetzung
[9] Vidal, O., Goffe, B. & Arndt, N. (2013): Metals for a low-car- der Rücknahmepflicht durch Handelsunternehmen und
bon society. – Nature Geoscience 6: 894-896. mehr Zollkontrollen. – URL: https://www.presseportal.
[10] Drexhage, J.R., La Porta, D., Hund, K.L., Mccormick, M.S. de/pm/22521/4021055https://www.presseportal.de/
& Ningthoujam, J. (2017): The growing role of minerals and pm/22521/4021055
metals for a low carbon future. – World Bank Group, EGPS [22] Hagelüken, C. (2014): Technologiemetalle – Systemische
(Extractives Global Programmatic Support), Washington DC. Voraussetzungen entlang der Recyclingkette. In Kausch,
[11] Carrara, S., Alves Dias, P., Plazzotta, B. & Pavel, C. (2020): P., Bertau, M., Gutzmer, J., Maschullat, J. (Hrsg.): Stra-
Raw materials demand for wind and solar PV technologies tegische Rohstoffe – Risikovorsorge: 161-172; Springer,
in the transition towards a decarbonised energy system. – Berlin, ISBN 978-3-642-39703-5.
EUR 30095 EN, Publication Office of the European Union, [23] AEI (2020). China global investment tracker. – American
Luxembourg. – ISBN 978-92-76-16225-4. Enterprise Institute – URL: https://www.aei.org/china-
[12] Månberger, A. & Stenqvist, B. (2018). Global metals flows global-investment-tracker/
in the renewable energy transition: Exploring the effects of [24] WIPO (2019): World intellectual property indicators 2019.
substitutes, technological mix and development. – Energy – Genf, World Intellectual Property Organization.
Policy 119: 226-241. [25] Deutscher Bundestag (2020). Antwort der Bundesregierung
[13] Acatech (2017): Rohstoffe für die Energiewende, 104 pp. auf die Kleine Anfrage der Abgeordneten Dr. Marcel Klinge,
– URL: https://www.acatech.de/publikation/rohstoffe-fu- Olaf in der Beek, Michael Theurer, weiterer Abgeordneter
er-die-energiewende-wege-zu-einer-sicheren-und-nach- und der Fraktion der FDP. – Drucksache 19/16562 – Roh-
haltigen-versorgung/ stoffpartnerschaften. Drucksache 19/17224
[14] Renner, S. & Wellmer, F.W. (2019): Volatility drivers on the [26] D-EITE (2018): Bericht für 2016. 2. Auflage. – Deutsche Ge-
metal market and exposure of producing countries. – Min- sellschaft für Internationale Zusammenarbeit GmbH, Bonn.
eral Economics – DOI: 10.1007/s13563-019-00200-8 [27] EU (2020): Critical raw materials resilience: Charting a path
[15] Rötzer, N. & Schmidt, M. (2018): Decreasing Metal Ore towards greater security and sustainability. – URL: https://
Grades — Is the Fear of Resource Depletion Justified? – eur-lex.europa.eu/legal-content/EN/TXT/PDF/?uri=CEL-
Resources 7 – DOI: 10.3390/resources7040088 EX:52020DC0474&from=EN
[16] Elskhaki, A., Graedel, T.E., Ciacci, L. & Reck, B.K. (2016): [28] DHB (2018): Datenhandbuch des Deutschen Bundestages
Copper demand, supply, and associated energy use to – Kapitel 3.1.1. Berufsstruktur. https://www.bundestag.de/
2050. – Global Environmental Change 39: 305-315. datenhandbuch
[17] USGS (2020): How much copper has been found in [29] Hoepke, K.-P. (2007): Geschichte der Fridericiana. – Uni-
the world? – URL: https://www.usgs.gov/faqs/how- versitätsverlag Karlsruhe – ISBN 978-3-386644-138-5
263Sie können auch lesen