Datenblatt: Systemleistung - Reloop Platform
←
→
Transkription von Seiteninhalten
Wenn Ihr Browser die Seite nicht korrekt rendert, bitte, lesen Sie den Inhalt der Seite unten
Datenblatt
Pfandsysteme: Systemleistung
Zuletzt aktualisiert: 3 Mai 2021
Datenblatt: Systemleistung
• Länder, Staaten und Provinzen, die Pfandsysteme (DRS) eingeführt haben,
erzielen durchweg höhere Sammelquoten für Getränkeverpackungen als
diejenigen, die sich ausschließlich auf kommunale Sammelsysteme für die
Bordsteinkante verlassen.
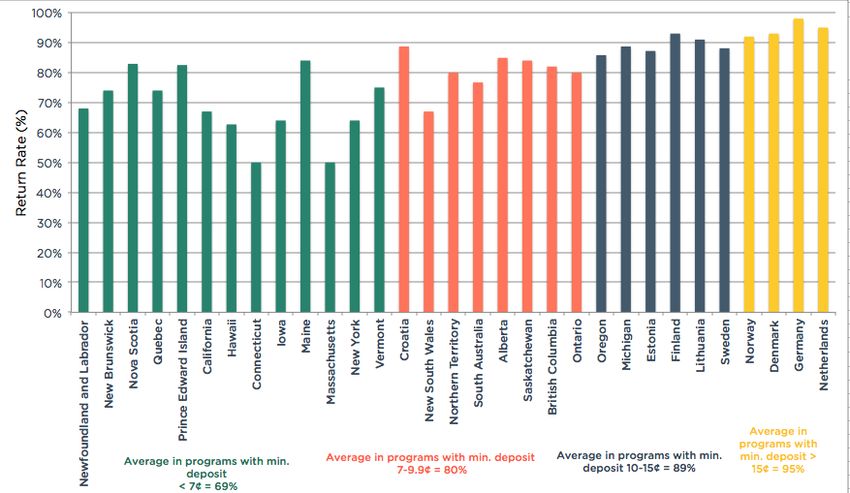
• Im Allgemeinen gilt: Je höher der Einzahlungswert, desto höher die
Rückgabequote.
• Die höchsten Rücklaufquoten sind in Systemen zu verzeichnen, die einen Return-
to-Retail-Ansatz verfolgen, bei dem die Einzelhändler, die Getränke verkaufen,
gesetzlich verpflichtet sind, leere Behälter für das Recycling anzunehmen
In dem Bestreben, das Abfallaufkommen zu reduzieren und das Recycling zu erhöhen,
wenden sich immer mehr Länder an Pfandsystemen für die Rücknahme von
Getränkeverpackungen zu. Ein Pfand, das als wirtschaftlicher Anreiz zum Recycling dienen
soll, ist eine kleine Gebühr, die beim Kauf bestimmter Getränkebehälter erhoben wird und
dem Verbraucher (teilweise oder vollständig) erstattet wird, wenn er den leeren Behälter
an einer Sammelstelle zurückgibt.
Trotz gegenteiliger Behauptungen der Getränkeindustrie zeigen internationale
Erfahrungen immer wieder, dass die Sammelquoten für Getränkeverpackungen in Ländern
mit Pfandrückgabe deutlich höher sind. In Kanada werden in Provinzen mit
Pfandrücknahmeprogrammen durchschnittlich 82 % aller verkauften Einweg-
Getränkeverpackungen zurückgenommen, im Vergleich zu nur 46 % in Ontario, wo
alkoholfreie Verpackungen über kommunale Recyclingprogramme für den Straßenrand
zurückgenommen werden. In einigen Gerichtsbarkeiten sind die Sammelquoten mit mehr
als 95 % deutlich höher. In den USA werden in Bundesstaaten mit aktiven Gesetzen zum
Behälterpfand 50-89 % der erfassten Behälter recycelt, während die allgemeine
Recyclingrate für Getränkebehälter in Bundesstaaten ohne Pfandrückgabe bei etwa 30 %
liegt. Nahezu jedes europäische Land mit DRS meldet Recyclingraten für Einweg-
Getränkeverpackungen von über 85 %.
Außerdem werden in den meisten Nicht-Pfand-Ländern in Nordamerika und Europa die
Sammelraten für Nicht-Pfand-Behälter tendenziell überschätzt, weil sie über die Sammlung
und nicht über das tatsächliche Recycling berichten. Hinzu kommt, dass diese Quoten
nicht für Free-riders gelten und manchmal auch die Tonnage der importierten Wertstoffe
einschließen können.
Die Leistung des Programms wird in der Regel anhand der Sammelquote gemessen, die
die Anzahl der zum Recycling gesammelten Behälter in einem bestimmten Land im
Vergleich zur Anzahl der verkauften Behälter darstellt. Die Bewertung der Leistung eines
Pfandsystems ist unkompliziert, da durch das Pfand, Verkäufe und Rücknahmen bis zur
letzten Einheit verfolgt werden können. Die Messung der Leistung von anderen
Sammelprogrammen ist dagegen komplexer, da Getränkeverpackungen zusammen mit
anderen Materialien wie Papier und Nichtgetränkebehältern gesammelt werden.
1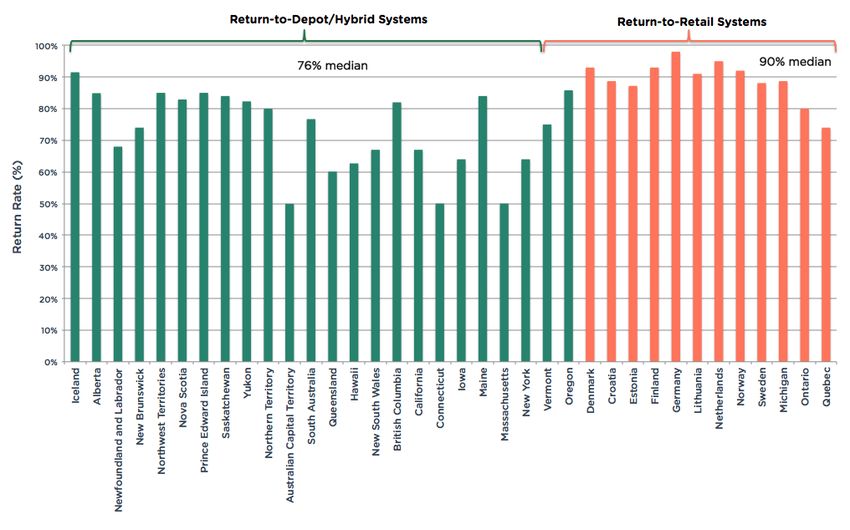
Datenblatt
Pfandsysteme: Systemleistung
Zuletzt aktualisiert: 3 Mai 2021
Im Gegensatz dazu handelt es sich bei der Sammlung in Pfandsystemen um Recycling, weil
die Kontamination gering und die Qualität hoch ist und weil diese Quoten nicht nach
Gewicht, sondern nach Stückzahl angegeben werden.
Die folgende Tabelle enthält eine Zusammenfassung der zuletzt verfügbaren
Leistungsdaten von 42 verschiedenen Systemen weltweit.
Tabelle 1 Rückgabequoten in Gerichtsbarkeiten mit pfandsystemen
Pfand Gesamt
Land / Markt Datenjahr Euro und USD
Lokale Währung
Äquivalent
€0.066 i
Kroatien 2019 0.5 HRK 88,7%
USD$0.07
€0.13- €0.4 ii
Dänemark 2020 1-3 DKK 93%
USD$0.15-$0.45
iii
Estland 2019 €0.10 (USD$0.11) 87.2%
iv
Finnland 2020 €0.10-€0.40 USD$0.11- $0.45 93%
v
Deutschland 2018 €0.25 USD$0.28 98%
15 ISK €0.11 vi,vii
Island 2020 91,5%
USD$0.12
viii
Litauen 2020 €0.10 USD$0.11 91%
ix
Niederlande 2018 €0.25 USD$0.28 95%
€0.13- €0.32 x
Norwegen 2020 1-2.5 NOK 92%
USD$0.12-$0.30
€0.11-€0.22 xi
Schweden 2020 1-2 SEK 88,1%
USD$0.12-$0.24
xii xiii
California 2019 USD$0.05-$0.10 €0.05-€0.09 67%
xiv xv
Connecticut 2019 USD$0.05 €0.05 50%
xvi xvii
Hawaï 2018-19 USD$0.05 €0.05 62,7%
xviii xix
Iowa 2016 USD$0.05 €0.05 64%
xx
Maine 2017 USD$0.05-$0.15 €0.05-€0.14 84%
xxi
Massachusetts 2019 USD$0.05 €0.05 50%
xxii
Michigan 2019 USD$0.10 €0.09 88,7%
xxiii
New York 2019 USD$0.05 €0.05 64%
xxiv xxv
Oregon 2019 USD$0.10 €0.09 85,8% ,
xxvi
Vermont 2013 USD$0.05-$0.15 €0.05-€0.14 75%
€0.07-€0.17 xxvii
Alberta 2019 CAD$0.10-$0.25 85,3%
USD$0.07-$0.18
xxviii €0.03-€0.13 xxix,xxx
British Columbia 2019 CAD$0.05-$0.20 82%
USD$0.04-$0.15
€0.07-€0.13
Manitoba (nur xxxi
2016 CAD$0.10-$0.20 USD$0.10-$0.15 78,5%
Bier)
€0.03-€0.07
Newfoundland xxxiixxxiii
2019 CAD$0.05-$0.10 USD$0.04- 68%
and Labrador
$0.07
€0.03-€0.07
xxxivxxxv
New Brunswick 2018-19 CAD$0.05-$0.10 USD$0.04- 74%
$0.07
Northwest €0.07-€0.17 xxxvi
2018-2019 CAD$0.10-$0.25 85%
Territories USD$0.07-$0.18
€0.03-€0.07
xxxviixxxviii
Nova Scotia 2018-2019 CAD$0.05-$0.10 USD$0.04- 83%
$0.07
Ontario (nur €0.07-€0.13 xxxixxl
2019 CAD$0.10-$0.20 80%
Alkohol-Behälter) USD$0.10-$0.15
€0.03-€0.07
Prince Edward xlixlii
2019 CAD$0.05-$0.10 USD$0.04- 85%
Island
$0.07
xliii
Quebec (nur Bier 2019 CAD$0.05-$0.20 €0.03-€0.13 74%
2
Datenblatt
Pfandsysteme: Systemleistung
Zuletzt aktualisiert: 3 Mai 2021

                                                                  Pfand
                                                                                                  Gesamt
              Land / Markt    Datenjahr                                   Euro und USD
                                             Lokale Währung
                                                                           Äquivalent
       und alkoholfreie                                                   USD$0.04-$0.15
       Getränke)
                                                                           €0.03-€0.27
                                                                                                           xliv
       Saskatchewan           2019-2020          CAD$0.05-$0.40             USD$0.04-                  84%
                                                                              $0.29
                                                                           €0.03-€0.17                        xlv
       Yukon                       2016          CAD$0.05-$0.25                                    82,3%
                                                                          USD$0.04-$0.18
                                                                              €0.06                      xlvi xlvii
       Neusüdwales            2019-2020            AUD $0.10                                     67%          ,
                                                                            USD $0.07
                                                                              €0.06                          xlviii
       Queensland             2019-2020            AUD $0.10                                      60,1%
                                                                            USD $0.07
                                                                              €0.06                          xlix
       Nordterritorium        2019-2020            AUD$0.10                                            80%
                                                                            USD $0.07
       Australisches
                                                                              €0.06                                l
       Hauptstadtterritor     2019-2020            AUD$0.10                                            49,9%
                                                                            USD $0.07
       ium
                                                                              €0.06                               li
       Südaustralien          2019-2020            AUD$0.10                                            76,7%
                                                                            USD $0.07
                                                                              €0.07                          lii
       Israël                      2018              0.3 ILS                                           77%
                                                                            USD$0.08
       Kosrae
       (Föderierte                                                           €0.05                           liii
                                   2017            USD$0.05                                            86%
       Staaten von                                                          USD$0.05
       Mikronesien)
                                                                             €0.05                                liv
       Palau                       2018            USD$0.05                                        90,3%
                                                                            USD$0.05
       Republik der                                                          €0.05                                     lv
                                   2018            USD$0.05                                       ca. 85%
       Marshallinseln                                                       USD$0.05
       Pohnpei
       (Föderierte                                                           €0.05               lvi
                                   2017            USD$0.05                                60%         (geschätzte)
       Staaten von                                                          USD$0.05
       Mikronesien)

       Disclaimer: Im Allgemeinen wurden die Rücklaufquoten vom Programmbetreiber oder von der für
       die Aufsicht zuständigen Regierungsbehörde eingeholt.


       3
Datenblatt
Pfandsysteme: Systemleistung
Zuletzt aktualisiert: 3 Mai 2021
Figure 1 Rückgabequoten in Gerichtsbarkeiten, die Pfandsysteme für Einweg-
Getränkeverpackungen eingeführt haben
Figure 2 Rücklaufquoten nach Erfassungsmethode (Return-to-Depot- oder Hybrid-Modell (grün)
vs. zurück zum Händler (rot))
4Datenblatt
Pfandsysteme: Systemleistung
Zuletzt aktualisiert: 3 Mai 2021
Figure 3 Rückgabequote nach Mindesteinlagewert (USD)
Fazit
Von Nordamerika bis Australien und in ganz Europa nimmt die globale Dynamik für
Pfandsystemen weiter zu. Pfandsystemen erreichen eine hohe Leistung, produzieren
qualitativ hochwertigere Recyclate und fördern den Übergang zu einer Kreislaufwirtschaft.
Angesichts dieser Vorteile und der oft schlechten Leistung von Multimaterial
Sammelprogrammen beschäftigen sich immer mehr Getränkeunternehmen damit, ihre
leeren Behälter kreislaufwirtschaftlich zu bewirtschaften und die wachsenden Probleme
des land- und maritimen Mülls zu lösen.
5Datenblatt
Pfandsysteme: Systemleistung
Zuletzt aktualisiert: 3 Mai 2021
Anmerkungen
i
Ministry of the Environment of the Croatia Republic. Data provided to Reloop via e-mail
correspondence April 7, 2020.
ii
Dansk Retursystem. Årsrapport 2020. Accessed from
iii
Personal communication with Rauno Raal, Eesti Pandipakend OÜ, September 15, 2020
iv
Personal communication with Tommi Vihavainen (Suomen Palautuspakkaus Oy), April 10,
2021
v
ACR+. January 2019. “Deposit-Refund Systems in Europe for One-Way Beverage
Packaging.” < https://www.acrplus.org/images/technical-reports/2019_ACR_Deposit-
refund_systems_in_Europe_Report.pdf>
vi
Personal communication with Helgi Lárusson, Managing Director at Framkvaemdastjóri,
April 12, 2021.
vii
Return rate for containers recovered through deposit system only. An additional 2.1% of
containers are recovered through other systems such as Green Dot programs. If these
containers are included, the total beverage container return rate is 93.6% (91.5% + 2.1%).
viii
Personal communication with Gintaras Varnas, USAD, 13 April 2021.
ix
Personal communication with Raymond Gianotten, SRN, 7 May 2020.
x
Infinitum. Årsrapport 2020. Accessed from
xi
Returpack Svenska AB. “Pantstatistik.” Accessed from
xii
Redemption rate reflects direct CRV redemption. In 2018, curbside programs collected
an additional 9% of CRV beverage containers sold.
xiii
“Redemption Rates and Other Features of 10 U.S. State Deposit Programs.” Document
provided by Susan Collins, Container Recycling Institute. 19 August 2020.
xiv
Before water bottles were added to the deposit system in 2009, redemption rates were
higher (in the range of 65-70%).
xv
Container Recycling Institute. Bottle Bill Resource Guide: Connecticut. Accessed from
xvi
Deposit containers collected at curbside (in Honolulu only) are already included in the
statewide redemption rates.
xvii
Personal communication with Jaylen Ehara, Hawaii State Department of Health, 17
January 2020.
xviii
Recycling rate is 71%; estimate of 7% is through kerbside and other programmes.
xix
Redemption Rates and Other Features of 10 U.S. State Deposit Programs.” Document
provided by Susan Collins, Container Recycling Institute, 19 August 2020.
xx
ibid.
xxi
ibid.
xxii
Michigan Department of Treasury, Office of Revenue and Tax Analysis. May 27, 2020.
“Bottle Deposit Information.” Accessed from
xxiii
“Redemption Rates and Other Features of 10 U.S. State Deposit Programs.” Document
provided by Susan Collins, Container Recycling Institute, 19 August 2020.
xxiv
Oregon Liquor Control Commission. “2019 Beverage Container Return Data.” Accessed
from
xxv
Deposit initiators within the Oregon Beverage Recycling Cooperative (OBRC), which
covers the vast majority of deposit containers sold in the state, reported a 2019 return rate
of 90%.
“Redemption Rates and Other Features of 10 U.S. State Deposit Programs.” Document
provided by Susan Collins, Container Recycling Institute. 19 August 2020.
xxvii
CM Consulting. November 2020. “Who Pays What: An Analysis of Beverage Container
Collection and Costs in Canada.” Accessed from
6Datenblatt
Pfandsysteme: Systemleistung
Zuletzt aktualisiert: 3 Mai 2021
xxviii
On November 1, 2019, Encorp Pacific, BC’s DRS system operator, raised the deposit on
all non-alcoholic beverage containers under and including 1L from 5¢ to 10¢. Then,
on October 1, 2020, deposits on beverage containers over 1L decreased from 20¢ to 10¢.
This means that all containers registered in BC’s DRS now have a unified deposit of 10¢.
xxix
Encorp Pacific (Canada). 25 Years: 2019 Annual Report. Accessed from
xxx
Personal communication with Brewers Distributors Limited.
xxxi
CM Consulting. November 2020. “Who Pays What: An Analysis of Beverage Container
Collection and Costs in Canada.” Accessed from
xxxii
If refillable containers are included, Newfoundland’s total return rate is actually 75% in
2019 (refillable beer containers were returned at a rate of 97%).
xxxiii
Personal communication with Gordon Wall at Multi Material Stewardship Board,
September 2020.
xxxiv
If refillable containers are included, New Brunswick’s total return rate is actually 75% in
2018/19 (refillable beer containers were returned at a rate of 97%).
xxxv
CM Consulting Inc. November 2020. “Who Pays What: An Analysis of Beverage
Container Collection and Costs in Canada.”
xxxvi
ibid.
xxxvii
If refillable containers are included, Nova Scotia’s total return rate is actually 84% in
2018/19 (refillable beer containers were returned at a rate of 97%).
xxxviii
CM Consulting Inc. November 2020. “Who Pays What: An Analysis of Beverage
Container Collection and Costs in Canada.” Accessed from
xxxix
If refillable containers are included, Ontario’s total return rate is actually 83% in 2019
(refillable beer containers were returned at a rate of 97%).
xl
CM Consulting Inc. November 2020. “Who Pays What: An Analysis of Beverage Container
Collection and Costs in Canada.” Accessed from
xli
If refillable containers are included, PEI’s total return rate is actually 86% in 2019
(refillable beer containers were returned at a rate of 97%).
xlii
CM Consulting Inc. November 2020. “Who Pays What: An Analysis of Beverage
Container Collection and Costs in Canada.” Accessed from
xliii
ibid.
xliv
ibid.
xlv
ibid.
xlvi
“Return and Earn Annual Statutory Report 2019-20.”
xlvii
Includes returns through the DRS network and curbside recycling programs (MRF
operators)
xlviii
Container Exchange (CoEX). “Annual Report 2019-2020.”
xlix
Northern Territory Environment Protection Authority. 18 September 2020. Environment
Protection (Beverage Containers and Plastic Bags) Act – Annual Report 2019-20.
l
ACT Government. ”ACT Container Deposit Scheme Annual Statutory Report 2019-20.”
Accessed from https://www.exchangeforchange.com.au/who-we-are/publications-and-
reports.html
li
South Australia Environmental Protection Authority. “Container Deposits.”
www.epa.sa.gov.au/environmental_info/container_deposit
7Datenblatt
Pfandsysteme: Systemleistung
Zuletzt aktualisiert: 3 Mai 2021
li
Personal communication with Carmit Bardugo, Asofta Recycling Corporation, October 7,
2019.
liii
Kosrae State Solid Waste Management Strategy 2018-2027 (Action Plan: 2018-2022).
liv
Republic of Palau, Division of Solid Waste Management Bureau of Public Works.
“Beverage Container Recycling Program Annual Report FY-2018.”
liv
Report provided by Alice Leney (alice@coolcard.co.nz) in April 2020 titled "Annual
Report to the Nitijela for the CDL Recycling Sysm for Year 2019"
liv
Personal communication with Alice Leney (alice@coolcard.co.nz), April 2020
8Sie können auch lesen