Pictet-Environmental Megatrend Selection - Investieren Sie engagiert AUGUST 2010

Die Seite wird erstellt Henrik Otto
 
WEITER LESEN
Pictet-Environmental Megatrend Selection - Investieren Sie engagiert AUGUST 2010
“Eine neue Art von Denken ist
                             notwendig, wenn die Menschheit
                             weiterleben will. “
                             Albert Einstein

Pictet-Environmental Megatrend Selection
Investieren Sie engagiert

AUGUST 2010
Pictet-Environmental Megatrend Selection - Investieren Sie engagiert AUGUST 2010
Inhalt

1. Einführung

2. Umweltbetreffende Megatrends

3. Investmentansatz

4. Nachhaltigkeitspolitik

5. Schlussfolgerungen

6. Technische Daten

                                  2
Pictet-Environmental Megatrend Selection - Investieren Sie engagiert AUGUST 2010
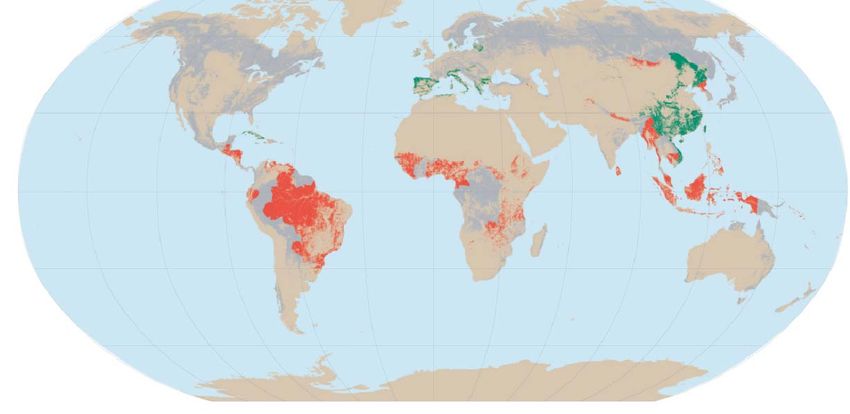
Nachweise unseres nachhaltigen Investments

 HAUPTPRODUKTE                                      INITIATIVEN & VERPFLICHTUNGEN
                                                    ƒ Kooperation mit Ethos
 1999         ƒ Auflegung des Pictet-Ethos (CH) -
                Swiss Sustainable Equities Fonds    ƒ Swiss Carbon Disclosure Project (CDP)
              ƒ Auflegung des Pictet-European       ƒ Mitglied von Eurosif; Unterzeichner der UNPRI
 2002
                Sustainable Equities Fonds            (UN Principles for Responsible Investments);
                                                      Partner des ökolog. Fußabdrucks
 2006         ƒ Management des Ethos Vermögens
                                                    ƒ Umweltinitiativen auf Unternehmensebene
              ƒ Erstes Renten SRI Mandat              (WaterAid, Zisternen in Jordanien, etc.)
 2007         ƒ Erste Balanced SRI und Emerging     ƒ Prix Pictet – The World’s Premier Photographic
                Market SRI Mandate                    Award in Sustainability 2008

 THEMENPRODUKTE                                     AUSZEICHNUNGEN
                                                    PAM* wurde im dritten Jahr in Folge bei den
 2000 ƒ Pioneer: Pictet-Water Fonds                 Global Pension Awards 2009 als SRI Provider
 2007 ƒ Auflegung des Pictet-Clean Energy           des Jahres ausgezeichnet.

  2008 ƒ Auflegung des Pictet-Timber Fonds
  2009 ƒ Auflegung des Pictet-Agriculture
*PAM: Pictet Asset Management
                                                                                                       3
Pictet-Environmental Megatrend Selection - Investieren Sie engagiert AUGUST 2010
Table of contents

1. Einführung

                    4
Pictet-Environmental Megatrend Selection - Investieren Sie engagiert AUGUST 2010
Die BP Ölkatastrophe im Golf von Mexiko

Quelle: Chris Graythen / Getty Image

                                          5
Pictet-Environmental Megatrend Selection - Investieren Sie engagiert AUGUST 2010
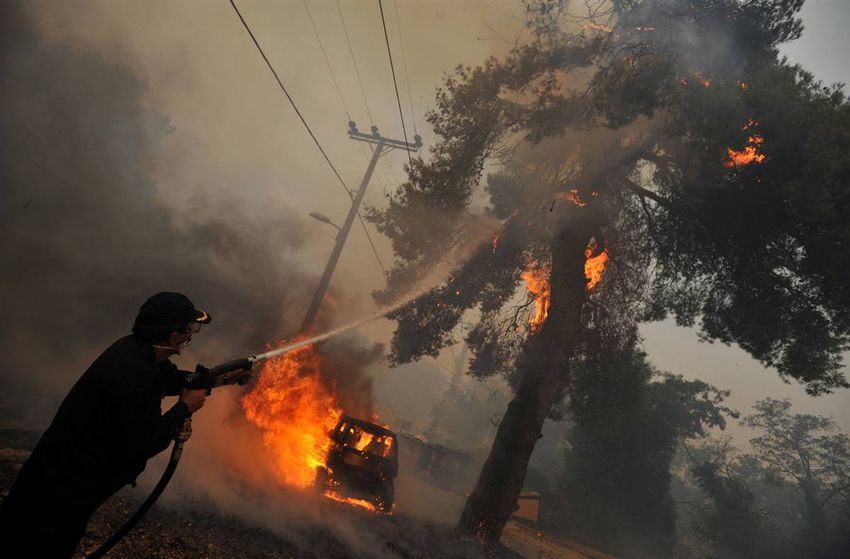
Waldbrände in Russland

Quelle: http://wildfiretoday.com

                                   6
Pictet-Environmental Megatrend Selection - Investieren Sie engagiert AUGUST 2010
… viele Dinge geschehen – unterm Radar

ƒ   Öl tritt aus undichten Pipelines und verseucht Wasser und Erdreich in den
    Entwicklungsländern
ƒ   Nicht nachhaltige Arbeitsbedingungen in neu entstehenden Fabriken
ƒ   Unzureichendes Wissen von Farmern beim Gebrauch von Pestiziden/Herbiziden
ƒ   Regierungsprestigeprojekte mit umweltschädigenden Begleiterscheinungen
ƒ   Illegale Abholzung der Regenwälder
ƒ   Übernutzung der Wasserressourcen

… ohne öffentliche Aufmerksamkeit.

                                                                                7
Pictet-Environmental Megatrend Selection - Investieren Sie engagiert AUGUST 2010
Table of contents

2. Environmental Megatrends

                              8
Pictet-Environmental Megatrend Selection - Investieren Sie engagiert AUGUST 2010
Die Welt wird übermäßig beansprucht
Feuer, Luft, Wasser und Erde

Die vier Grundelemente unter Bedrohung -
es besteht das Risiko, dass Ressourcen übernutzt werden.

                                                           9
Pictet-Environmental Megatrend Selection - Investieren Sie engagiert AUGUST 2010
Environmental Megatrends

                                                                                         Agriculture
                                                          1. Knowledge      Clean Energy                Water
                   Generics             15. Ageing                          2. Environment
                                                                                                        Timber
                14. Democratisation                                                  3. Acceleration

                         13. Health                      Pictet-                        4. Hypercomplexity
Biotech
                                                      Environmental
                                                       Megatrend
              12. Globalisation
                                                        Selection                       5. Networks
                                                                                             Digital Communication
                11. Individualisation                                                6. Commercialisation
Premium Brands
                              10. Immaterialisation                           7. Affluence

                                              9. Polarisation    8. New Technology
                                                                               Security
                                                                                                                 10
Quellen: CIFS Copenhagen, Pictet
Drei Hauptumwelt-Ressourcen

  DREI RESSOURCEN – VIER THEMEN

                 Ressourcen         Themen

                  Wasser             Water

                  Energie         Clean Energy

                                     Timber
                   Land
                                  Agriculture

Quelle: Pictet

                                                 11
Wasser: Lebensnotwendig

1. Wasser ist knapp und kann nicht ersetzt werden.

2. Wachsende Bevölkerung, bis 2050 bis zu 9 Mrd., höherer Wasserbedarf.

3. Veraltetete und fehlende Infrastruktur als große Herausforderung.

4. Regierungen bemühen sich um Outsourcing der Wasserdienstleistungen.

  NUR EIN BRUCHTEIL DES WELTWEITEN WASSERS IST NUTZBAR

                                                                          12
Quelle: Unesco, 2002
Klimawandel erfordert Übergang zu Clean Energy

 1. Heute besteht weltweiter Konsens, dass der vom Menschen verusachte Klimawandel reell ist.
 2. Sicherheit der Energieversorgung und Unabhängigkeit sind für die globale Wirtschaft wesentlich.
 3. Clean Energy profitiert von einer starken Unterstützung seitens Regierung und breiter Öffentlichkeit.
 4. Energieeffizienz bietet ein weites Feld für Verbesserungen.

  KORRELATION ZWISCHEN CO2 KONZENTRATION UND TEMPERATUR

Quellen: University of Bern (Siegenthaler et al., Science 2005; EPICA community members, Nature 2004),   13
 (1) IPCC estimate, average of possible scenarios
(2) Deuterium: proxy used to estimate temperature in Antarctica, www.gettyimages.com
Timber: Eine alte – aber dennoch wichtige “neue” - Ressource

1. Immer mehr und immer wohlhabendere Menschen werden mehr und mehr Holzprodukte
   verbrauchen.
2. Biologische Produktionslimits; Nettoverlust an Waldfläche und immer schwierigerer Zugang.
3. Die Fähigkeit von Wald, Kohlendioxid zu speichern, kann eine Hauptrolle im Klimawandel
   sein; Holz als CO neutraler Energieersatz.

 HOLZNAHE BIOBRENNSTOFFE EFFIZIENT UND UNUMSTRITTEN

                                       18                                          17

                                       16
  Output (BTU) / unit of fossil fuel

                                       14

                                       12

                                       10
                                                                      8
                                        8

                                        6

                                        4
                                                         2.5
                                        2     1.3

                                        0
                                             Corn     Rapeseed    Sugar cane     Cellulose
                                            ethanol   biodiesel    ethanol     based ethanol

                                                                                               14
Quelle: FAO, 2006; *energy-wise
Agriculture: Weltweite landwirtschaftl. Ungleichgewichte lösen

1. Der direkte menschliche Konsum von Getreide und Gemüse ist unabhängig vom Einkommen;
   Eiweiß und pflanzlicher Ölkonsum wächst mit steigendem Vermögen.

2. McKinsey: “…zwischen 2005 und 2025 werden sich allein in China und Indien ca. 1,1 Mrd.
   Menschen in die Einkommensmittelschicht einreihen.”

3. Investments in die Agrar-Wertschöpfungskette sind ein wesentlicher Bestandteil, um der globalen
   Nahrungsmittelherausforderung zu begegnen.
 CA. 80 MIO. ZUSÄTZLICHE MENSCHEN MÜSSEN P.A. ERNÄHRT WERDEN

                      10                                                                                    0.45

                       9                                                                                    0.4

                                                                                                                   Hectares of arable land per capita
                       8
                                                                                                            0.35
                       7
                                                                                                            0.3
  Population in bn.

                       6
                                                                                                            0.25
                       5
                                                                                                            0.2
                       4
                                                                                                            0.15
                       3
                                                                                                            0.1
                       2

                       1                                                                                    0.05

                       0                                                                                    0
                           1960   1970   1980     1990     2000   2010   2020      2030     2040     2050

                                         World population (lhs)     Arable land in ha/capita (rhs)

                                                                                                                                                        15
Quelle: U.N., World Population Prospects, FAO, Pictet, The Mosaic company - ML Agri conference, 2008
Unabhängige Branchendynamik

STARKE VERFLECHTUNG INNERHALB DER BRANCHENDYNAMIK DER VIER THEMEN

                                          Wasserkraft
                                          Entsalzung

 70% des Frischwasser wird                                             Biomasse (z.B. Holzspäne)
   für landwirtschaftliche                                                 Zweite Generation
    Bewässerung genutzt                                                        Biotreibstoffe

                        Wettbewerb für dieselbe Landfläche: unhaltbare
                  Palmölplantagen sind ein Hauptantreiber für die Abholzung in
                                          Südostasien
                                                                                                   16
Kooperation Pictet – Ethos

                                      Investmentübersicht Pictet-Environmental Megatrend Selection

                                                              Philippe de Weck
                                                          Senior Investment Manager

                       Pictet-Water             Pictet-Clean Energy         Pictet-Timber              Pictet-Agriculture
Investmentteams nach

                       Hans-Peter Portner       Philippe de Weck            Gabriel Micheli            Gertjan van der Geer
                       Philippe Rohner          Luciano Diana               Christoph Butz             Cédric Lecamp
                       Arnaud Bisschop
       Themen

                                            Input Unternehmensdialog und aktive Aktionärsbeteiligung
   Mandate

                                                                Ethos Stiftung

                                                                                                                              17
Table of contents

3. Investmentansatz

                      18
Investmentuniversum

•          830 Unternehmen weltweit über 4 Themen hinweg
INVESTMENTUNIVERSUM NACH SUB-THEMEN                                                              INVESTMENT UNIVERSUM NACH REGIONEN

                      Total market cap of EUR 1.54 tr*
                                      Environmental
                                                                                                                 Developed Asia Pacific
       Clean Energy                      Services
                            Energy                                                                                       10%
       Technology &                         2%
         Equipment
                           Efficiency                                                                                                          North America
                               4%                             Clean Energy                                                                         33%
            5%                                                Infrastructure
         Resources                                                22%                                Europe
            6%
                                                                                                      25%

   Water
Technologies
    8%

Water supply
    8%                                                                     Farm Inputs
                                                                              13%

                 Farming
                   9%                                           Agricultural
                                                                                                                                 Emerging Markets
                                                               Supply Chain
                                     Timber                      Services
                                                                                                                                      32%
                                      11%                           12%

(*) This market cap as per May 31, 2010, compares with the the market cap of the Footsie 100, with EUR 1.75 tr
                                                                                                                                                               19
    Quelle: Pictet
Investmentprozess in zwei Stufen

  ZWEISTUFIGER INVESTMENTPROZESS

                         Top-down Investment in 4 Themen mit
                         strategisch festgelegter Gewichtung
                     ƒ Direkter Zugang zu den vier Umweltthemen
                     ƒ Outperformende Themen werden durch unterperformende
                       Themen ersetzt
                     ƒ Festgelegte Asset Allokation zwischen den Themen mit
                       monatlichem Rebalancing

                         Bottom-up Titelauswahl auf Themenebene
                     ƒ   Strategische Unterstützung durch das Advisory Board
                     ƒ   Teamansatz
                     ƒ   Investiert in Titel mit attraktivem Risiko-/Ertragspotential
                     ƒ   Optimiert das Portfolioprofil für langfristige Anleger

Quelle: Pictet

                                                                                        20
Top-down strategische Gewichtung in Themen

 KOMBINATION DER VIER INVESTMENTIDEEN IN EINEM INVESTMENTFONDS            1. Strategische
                                                                             thematische
                   Pictet-Environmental Megatrend Selection                  Gewichtung
                                                                          2. Monatliches
                                                                             Rebalancing
                                                                             ausgelöst durch
                                                                             Performanceunter-
                                                                             schiede der
                                                                             einzelnen Themen
                   Water           Clean Energy    Timber   Agriculture   3. Tägliche
      Themen
                    1/3                1/3           1/6        1/6          Veröffentlichung der
                                                                             unterliegenden
    Ressourcen     Wasser            Energie            Land                 Fonds-NIWs

Quelle: Pictet

                                                                                                    21
Bottom-up stock Auswahl auf Themenebene
Beispiel: Investmentprozess Pictet-Clean Energy

                                             Halbjährliches Meeting des Advisory Board
    STRATEGISCHE DEFINITION DER              - Besprechung der jüngsten Fonds-Performance
        INVESTMENTTHEMEN                     - Diskussion der Wachstumstrends in der Industrie
                                             - Thematische Diskussionen im Kontext des Energiethemas

                                             Datenbank-Screening
  IDENTIFIKATION DES CLEAN ENERGY            - Identifizierung von Unternehmen mit relevanten themenbezogenen
            UNIVERSUMS                          Aktivitäten
  (~730 Unternehmen, $2.660 Mrd Marktkap.)
                                             - Qualitatives Screening der globalen Aktiendatenbank, die aus 40.000
                                                Unternehmen besteht

                                             Quantitatives Screening
 HERAUSFILTERN DES INVESTIERBAREN             Screening des Investmentuniversums nach Net Sales, EBIT, EBITDA
           UNIVERSUMS                         um zu entscheiden, welcher Teil des Unternehmenswerts im Anlage-
   (~250 Unternehmen, $660 Mrd Marktkap.)     thema generiert wird (mind. 20%); daraus wird investierbares Univer-
                                              sum gebildet

                                             Portfoliokonstruktion und Einzeltitelauswahl
           MANAGEMENT                        - Screening und Gewichtung des investierbaren Universums nach Reinheit,
       DES MODELLPORTFOLIOS                    Marktliquidität und Aktienvolatilität, um die Anfangsgewichte zu bestimmen
               (~100 Aktien)                 - Alle Aktien mit Anfangsgewicht von > 0 werden gescored
                                             - Screening des ersten Quartils, dann werden Aktien mit Anfangsgewicht von ≤ 0
                                               gescored

    PICTET-CLEAN ENERGY FONDS
              ~60-80 Aktien
                                                                                                                        22
Beispiel: Iberdrola Renovables

  INVESTMENTPROZESS - BEISPIEL
                                                                                                                                                 Kommentar

    7%                                                                                                                                           1.      Purity: Kein Abzug, da 100% der
                  6.0%            0.0%           -4.4%                                                                                                   Aktivitäten im Clean Energy-Bereich
    6%                                                                                                                                                   stattfinden
    5%                                                                                                                                           2.      Portfolio construction: Discount von
                                                                               2.5%            0.0%             4.1%                                     4.4% wegen Marktliquidität;
     4%                                                                                                                                                  herunterskaliert pro rata, damit die
                                                                                                                                                         Summe der “initial weights” 50%
     3%                                                                                                                                                  umfasst
                                                                  1.6%
     2%                                                                                                                                          3.      Company: +2.5% wegen des guten
                                                                                                                                                         Geschäftsmodells (Score +2.5),
     1%                                                                                                                                                  gutem Management Score (+2.5)
                                                                                                                                                         und Bewertungs-Score (+2.50).
    0%
                                                                                                                                                         Company factor= 2.5*30% +
                  ht

                                                             or
                                                             or

                                                           ht
                ig

                               or

                                                                                                                                                         2.5*20% + 2.4*50% = +2.5%
                                                          ct
                                                          ct

                                                         or
              we

                                                 io o

                                                        ig
                                                         *
                             ct

                                                       fa
                                                       fa

                                                       ct
                                               ct oli

                                                      ht

                                                     we
                           fa

                                                    fa
          ng

                                                    ig
                                          tru rtf

                                                  ny
                                                    n
                         y

                                                we

                                                 io
                                                ry
          ti

                      rit

                                               pa
                                       ns Po

                                              ol
       ar

                                              st
                    Pu

                                            m
                                            al

                                           rtf
    St

                                          du

                                                                                                                                                 4.      Industry: Kein Discount für die
                                         iti

                                        Co

                                       Po
                                       In
                                      In
                                    co

                                                                                                                                                         Industrie, da die Fundamentaldaten
                                                                                                                                                         für Windkraftanlagen gut sind

* Purity, liquidity, and volatility calibrated. The sum of initial weights is calibrated to 50% on a pro rata basis and is a function of the sustainable fund size and the structure of the
investable universe                                                                                                                                                                           23
Source: Pictet Asset Management, as of 30/06/10
Modellportfolio - Struktur

 MODELLPORTFOLIO - STRUKTUR

                                 Cash                                      Consumer HealthCare
                                  4%                                         Discr.      1%    Cash
          Emerging                                                                              4%
                                                                              1% Financials
          Markets                                                          Energy   3%                Utilities
            17%                                                             3%
                                                                                                       30%
                                                                                  IT
 Developed                                          North America                7%
    Asia                                                 46%
    5%                                                                     Consumer
                                                                            Staples
                                                                             10%

                                                                    Cash                              Industrials
                 Europe                                             4%          Materials                23%
                  28%                                                            18%
                                          Small Cap
                                           < 1 bn
                                            EUR
                                            23%                            Large Cap
                                                                            > 5 bn
                                                                             EUR
                                                                             30%

                                        Mid Cap 1
                                         - 5 bn
                                          EUR
                                          43%
                                                                                                                    24

Quelle: Pictet, 31. Juli, 2010
Modellportfolio - Top 10 Titel

                                          % DES                   MARKT-        % THEM.       PRODUKTE UND
UNTERNEHMEN                     DOMIZIL             SEKTOR
                                          FONDS                  KAP.($Mrd.)   EXPOSURE     DIENSTLEISTUNGEN

                                  US      1.7%       WATER           3.7         89%         Regulated Water Utility

                                                                                          Components (Pumps) Municipal
                                  US      1.5%       WATER           8.6         39%
                                                                                                    Markets

                                                                                          Generates and distributes wind
                                 Spain    1.4%    CLEAN ENERGY      14.8         100%
                                                                                                      power

                                                                                                   Engineering
                                  US      1.3%       WATER           5.9         40%
                                                                                                   Technology

                                  US      1.3%       WATER          12,2         100%        Solid Waste Treatement

                                                                                            Concessions, Engineering,
                                FRANCE    1.3%       WATER           9.1         80%
                                                                                                  Technology

                                                                                            Concessions, Engineering,
                                  UK      1.2%       WATER           6.2         87%
                                                                                                  Technology

                                                                                            Manufactures LED lighting
                                  US      1.2%    CLEAN ENERGY       7,6         100%
                                                                                                   solutions

                                                                                             Regulated Water Utility,
                                  UK      1.2%       WATER           4.9         100%             Engineering,
                                                                                                   Technology
                                                                                          Owns and manages timberland
                                  US      1.1%      TIMBER           3,9         100%
                                                                                                 and real estate           25

Quelle: Pictet, 31. Juli 2010
Table of contents

4. Nachhaltigkeitspolitik

                            26
Nachhaltigkeitspolitik

  DREI EBENEN DER NACHHALTIGKEIT

                                            Ethos
                              AKTIVE
                        AKTIONÄRSTEILHABE

                           EINBEZIEHUNG
                                            Pictet
                           AUSSCHLUSS

Quelle: Pictet

                                                     27
Ausschluss

ƒ Vermeidung von Anlagen in Unternehmen, die unakzeptable
  Risiken darstellen, indem sie zu schweren Menschenrechtsverletzungen,
  schwerer Korruption, schwerwiegenden Umweltschäden beitragen…

ƒ Führen einer schwarzen Liste umstrittener Unternehmen,
  basierend auf maßgeblichen Quellen in diesem Bereich, wie
  das Ethikkonzil des norwegischen Staatspensionfonds

ƒ Regelmäßiges Überprüfung und Aktualisierung der schwarzen Liste durch das
  Pictet Sustainable Investment Board (SIB)

                                                                              28
Einbeziehung

ƒ Investment nur in Unternehmen mit einer klaren
  und strategischen Ausrichtung auf eines der Pictet-
  Themen, die aus dem Environmental Megatrend
  stammen:
  Water - Clean Energy - Timber – Agriculture

ƒ Minimum Anteil von 20% - 50% an jedem speziellen Thema
  erforderlich für eine Einbeziehung in die unterliegenden
  Themen; durchschnittlicher Themenanteil des unterliegenden Themenniveaus
  bei bis zu 80%
ƒ Pictets Investmentmanagementteams schließen Umwelt-, soziale und/oder
  Corporate Governance Belange mit ein, als auch Kontroversen, die einen
  negativen Einfluss auf das Geschäftsmodell eines Unternehmens haben
  könnten (langfristige Fähigkeit, Cashflow zu generieren) als Teil des
  Investmentprozesses

                                                                             29
Aktives Aktionärsverhalten

Zwei Instrumente
1. Stimmrechte werden aktiv für die größten Titel
   eines jeden Fonds ausgeübt, basierend auf “Best
   Corporate Governance” und Nachhaltigkeits-
   praktiken, und für diejenigen, mit denen wir
   in einem Dialog engagiert sind.
2. Unternehmen in einen Dialog engagieren mit der Absicht,
   Geschäftsstandards und Best Practice der einzelnen Branchen zu verbessern.

   An die in Genf ansässige Ethos Stiftung, ein Pioneer in Corporate Governance mit einer
   langjährigen Erfolgsgeschichte in diesem Bereich, hat Pictet ein Mandat vergeben, um
   Empfehlungen hinsichtlich der Stimmrechtsvergabe bereitzustellen sowie für Pictet
   ausgewählte Unternehmen zu verpflichten.

                                                                                            30
Ethos – Stiftung für Nachhaltigkeit

ƒ   Das führende Schweizer Institut für Stimmrechtsausübung und
    Unternehmensdialog. Ethos wurde 1997 von zwei Genfer Pensionskassen
    gegründet und umfasst zurzeit über 90 institutionelle Investoren.

ƒ   Ethos fördert sozial verantwortliches Investment und ein dauerhaft gedeihendes
    sozialökonomisches Umfeld.
ƒ   Über das eigene UnternehmenEthos Services bietet Ethos:
     ƒ Investmentfonds und diskretionäre Mandate mit ca. 1,1 Mrd. EUR
     ƒ Analyse von Aktionärs-Hauptversammlungen für einige hundert
       Unternehmenen
     ƒ Engagement Programme für mehr als 50 Schweizer Pensionsfonds mit einem
       Vermögen von 65 Mrd. EUR

ƒ   Ethos erhielt 2009 den angesehenen ICGN Award für seinen signifikanten Beitrag
    hinsichtlich einer verbesserten Corporate Governance in seiner Region. Ethos ist
    ein Unterzeichner der UN Principles for Responsible Investment (UNPRI)
    (Grundsätze für verantwortungsbewusstes Investment).

                                                                                       31
Ethos – aktive Eigentümerschaft für Nachhaltigkeit

 ƒ Fundamentaler Ansatz
       ƒ ‘Stimme’ eher als ‘Austritt’
 ƒ Empfehlungen für Stimmrechtsabgabe und Dialog mit Unternehmen
       ƒ Schutz für langfristiges Aktionärsvermögen
       ƒ Schutz der Aktionärsrechte
       ƒ Corporate Governance verstärken
            – Risiken limitieren, die durch Störung bei Aufsichtsrat und
              Management entstehen
            – Den langfristigen Wert des Unternehmens schützen
       ƒ Bei den Unternehmen Bewusstsein für Unternehmerische
         Sozialverantwortung/Corporate Social Responsibility
         wecken, um so Verbesserungen zu fördern.
       ƒ Den Unternehmenswert für alle Aktionäre auf nachhaltige Art steigern.

                                                                                 32
Empfehlungen bei Stimmrechten

ƒ   Ethos’ Stimmrechtsempfehlungen basieren auf
     ƒ Codes of best practice bei Corporate Governance
     ƒ Ethos’ Satzung basiert auf dem Konzept der nachhaltigen Entwicklung
ƒ   Ziel
     ƒ Den Unternehmenswert für die Aktionäre und Stakeholder auf nachhaltige
       Art zu steigern
ƒ   Ansatz
     ƒ Positiv: Die Vorschläge des Vorstands werden genehmigt sofern sie nicht
       gegen die Aktionärsinteressen gehen
ƒ   Internationale Partnerschaften
     ƒ Ethos ist Mitglied des ECGS (European Corporate Governance Services)
     ƒ Direkte Partnerschaft mit GIR (Kanada) und SIRIS (Australien)

                                                                                 33
Dialog mit Unternehmen

ƒ Ziele beim Dialog mit Unternehmen
      ƒ Verbesserung von Geschäftsstandards und Best Practice, um die
        Nachhaltigkeit der Aktivitäten zu begünstigen
ƒ Selektion von ESG Angelegenheiten
      ƒ Systematische Überwachung der unterliegenden Portfolios hinsichtlich ESG
        Angelegenheiten wie Menschenrechte, Umweltschäden, Korruption,
        unfairer Wettbewerb etc.
ƒ Ressourcen
      ƒ Eigenes Team mit hoher Expertise bei ESG Angelegenheiten
ƒ Gemeinschaftliches Engagement
      ƒ Ethos Engagement Pool (50 Pensionsfonds, AUM 65 Mrd. EUR)
      ƒ Internationales gemeinschaftliches Engagement (CDP, IIGCC, EITI, etc.)
ƒ Ethos Studien für “Engagement”-Aktivitäten
      ƒ Kompenstation der Angestellten, Verhaltenskodex, Carbon Disclosure
        Projekt
                                                                                   34
Übersicht: Engagement des Fonds

ƒ Beispiele für die Überwachung von ESG Angelegenheiten
       ƒ Kinderarbeit und Gesundheitsangelegenheiten (Syngenta)
       ƒ Umweltverschmutzung
       ƒ Kontroverse Staudammprojekte
       ƒ Wettbewerbswidrige Praktiken
       ƒ Arbeitsrechte
ƒ “Engagement” Ziele
      ƒ Fokus auf den am meisten exponierten Unternehmen hinsichtlich ESG
         Kontroversen
      ƒ Engagementhorizont mindestens zwei Jahre pro Unternehmen
      ƒ Alleinige oder gemeinschaftliche Initiativen (Briefe, Besuche,
         Resolutionen)
      ƒ Stimmrechte gemäß der Engagement Ziele gebrauchen
ƒ Ethos Engagement Empfehlungen
       ƒ Strategievorschläge um das Management kontroverser Angelegenheiten zu
         verbessern
       ƒ Wird keine Reaktion gezeigt, kann Disinvestition ein Weg sein, um den   35

         Wert und die Reputation des Fonds gemäß seiner Ziele zu schützen
Engagement: Beispiel Syngenta
Verringerung negativer externer Effekte
                                  Zwei kontroverse Angelegenheiten:
                                  - Kinderarbeit bei Saatanbietern aufdeckt von unabhängigen
        ESG ÜBERWACHUNG
                                    öffentlichen Trägern
                                  - Gesundheits- und Sicherheitsangelegenheiten bei Planzenschutz-
                                    Produkten, die hochgiftiges Paraquat enthalten, in EMs entdeckt
                                   - Kinderarbeit: Zusammenarbeit mit unabhängiger NGO, um einen
 BEST PRACTICE UND VERBESSERUNG      zuverlässigen Plan zur Ausrottung von Kinderarbeit in Indien
         ANFORDERUNGEN               aufzustellen
                                   - Gesundheits- und Sicherheitsangelegenheiten : Eingeschränkte
                                     Verwendung von Paraquat wenn möglich
                                   - Syngenta wurde von Pictet über den Engagementprozess informiert
                                   - Ethos teilte die Ergebnisse der Analyse mit Syngenta und bat das
  DIREKTE UNTERNEHMENSKONTAKTE
                                     Unternehmen zu den Fakten, Initiativen und Projekten Stellung zu
                                     nehmen
                                   - Treffen mit der Syngenta Geschäftleitung am Firmenhauptsitz
                                  - Kinderarbeit: Weiterhin Überwachung in Indien. Ausweitung der
      ETHOS EMPFEHLUNGEN
                                    Kinderarbeit-Ermittlungen in allen Ländern des Betriebes =>
                                    Überprüfung des Fortschritts in 2010
                                  - Gesundheits- und Sicherheitsangelegenheiten : neues Treffen in
                                    2010 vorgeschlagen, um die Restriktion bezüglich Paraquat in EMs
                                    zu bewerten
     ENGAGEMENT AUSWERTUNG

                                                                                                      36
Table of contents

5. Schlussfolgerungen

                        37
Performance Simulation
Performance Backtesting per Ende Juli 2010

  PERFORMANCE BACK TESTING DES PICTET-ENVIRONMENTAL MEGATREND SELECTION
       160

       140

       120

       100

        80

        60

        40
          5

                                   6

                                                            7

                                                                                         8

                                                                                                                9

                                                                                                                                        0
                      06

                                                07

                                                                          08

                                                                                                    09

                                                                                                                            10
        l-0

                                 l-0

                                                           l-0

                                                                                      l-0

                                                                                                               l-0

                                                                                                                                      l-1
                    n-

                                              n-

                                                                        n-

                                                                                                  n-

                                                                                                                          n-
      Ju

                               Ju

                                                         Ju

                                                                                    Ju

                                                                                                             Ju

                                                                                                                                    Ju
                  Ja

                                            Ja

                                                                      Ja

                                                                                                Ja

                                                                                                                        Ja
                     Backtesting EMS                             MSCI World                            MSCI World Small Cap

                                       Perf YTD            Perf 1Y             Perf 3Y       Perf 5Y

  Backtesting Pictet-EMS                 4.1%              13.9%               -18.3%        13.8%
  MSCI World                            11.1%              22.7%               -20.9%        -7.5%
  MSCI World Small Cap                  21.6%              38.1%               -11.9%         3.5%

Quelle: Pictet; Backtesting basiert auf den reinsten Titeln eines jeden zugrundeliegenden Investmentuniversums von Water (60 Titel), Clean   38
Energy (60 Titel), Agriculture (60 Titel) und Timber (20 Titel)
Risiko- / Ertragssimulation
Risiko- / Ertragsbacktesting per Ende Juli 2010

  BACK TESTING DES PICTET-ENVIRONMENTAL MEGATREND SELECTION RISIKO- / ERTRAGSROFILS

                                                                                                                                               Emerging Equities
          50%

          40%

          30%
 Return

          20%
                                                                                      EMS backtesting
          10%

                                                                                                                    Small Cap World Equities
                                                                                        European Equities
           0%
                                                                                        World Equities

          -10%
                                                                                           Japan Equities
                                                                                      S&P 500    Footsie
          -20%
              6%             8%            10%            12%            14%           16%            18%            20%            22%           24%              26%
                                                                                Ann. Volatilität
Quelle: Pictet; Backtesting basiert auf den reinsten Titeln eines jeden zugrundeliegenden Investmentuniversums von Water (60 Titel), Clean                               39
Energy (60 Titel), Agriculture (60 Titel) und Timber (20 Titel)
Schlussfolgerungen

Warum Environmental Megatrends?
    ƒ Die umweltbezogene weltweite Herausforderung ist zu wichtig, um im 21. Jh. ignoriert zu
      werden
    ƒ Vier fundamentale Elemente – Wasser, Luft, Feuer (Energie) und Erde - sind unter
      Bedrohung; wir müssen Wege finden, um die Grundlage unseres Lebens zu schützen

Warum jetzt?
    ƒ Die Welt macht bedeutende Schritte, um den negativen Einflüssen des menschlichen
       Wirkens Einhalt zu gebieten
    ƒ Anleger können an der schnellen Entwicklung neuer Technologien und Lösungen, die die
       Umweltherausforderung betreffen, partizipieren

Warum Pictet-Environmental Megatrend Selection?
    ƒ Systematisch in die vier großen Umwelt-Megatrends investieren
    ƒ 3-stufiger Nachhaltigkeits-Overlay
    ƒ Engagement Prozess und aktive Aktionärsbeteiligung beeinflussen die Unternehmen
      proaktiv, um so bessere Mitglieder der Gesellschaft zu werden
    ƒ Hoch diversifizierte Singlefonds-Struktur ohne zusätzlich Kosten
                                                                                                40
Table of contents

6. Technische Daten

                      41
Technische Daten

ƒ   Name:              Pictet – Environmental Megatrend Selection
ƒ   Rechtsform:        Sicav nach Teil I des Luxemburger Gesetzes vom 20.12.2002
ƒ   Referenzwährung:   USD
ƒ   NIW-Berechnung:    an jedem Handelstag; Abwicklung NAV + 3
ƒ   Auflegungsdatum:   10. September 2010 zu einem NIW von USD 100
ƒ   Dividenden:        reinvestiert (I, P, R) oder ausschüttend (P dy)
ƒ   Benchmark:         MSCI World (net div reinvest)
ƒ   Anteilsklassen:
                                                           ISIN Codes   Mgmt Fee   Admin/Custody   TER*
                       I USD                          LU0503632100        0.80         0.33        1.20
                       I EUR                          LU0503631631        0.80         0.33        1.20
                       P USD                          LU0503632282        1.60         0.33        2.00
                       P EUR                          LU0503631714        1.60         0.33        2.00
                       P dy EUR                       LU0503631805        1.60         0.33        2.00
                       P dy GBP                       LU0503632951        1.60         0.33        2.00
                       P dy CHF                       LU0503632795        1.60         0.33        2.00
                       P dy USD                       LU0503632449        1.60         0.33        2.00
                       R USD                          LU0503632522        2.30         0.33        2.70
                       R EUR                          LU0503631987        2.30         0.33        2.70
                        I-Shares: Minimuminvestment USD 1’000’000
                        *Indikativ
                        Quelle: Pictet Funds, April 30, 2010

                                                                                                          42
Table of contents

Anhang

                    43
Pictet-Agriculture
 Anlageziel                             Der Fonds legt in Aktien von Unternehmen aus der gesamten Agrar-Wertschöpfungskette an. Der
                                        Schwerpunkt liegt bei Unternehmen, die in den Bereichen Produktion, Verarbeitung und Vertrieb
                                        von Agrargütern tätig sind, ebenso Hersteller von Landwirtschaftsausrüstung. Es besteht keine
                                        Einschränkung in regionaler Hinsicht.
 Benchmark                              MSCI World (nr)
 Lancierungsdatum                       29. Mai 2009
 Referenzwährung                        EUR
 Fondsmanagement-Team                   Pictet Asset Management (PAM)
                                        Gerardus van der Geer            9 Jahre Investmenterfahrung
                                        Cédric Lecamp                    2 Jahre Investmenterfahrung

 Fondsvolumen (Mio. EUR)               139           ( 99.5% geschätzte Veränderung des Fondsvolumens in 2010)
 Performance (ytd)                     Fonds         Benchmark
                                       6.32%          7.35%
 Anlagestil                             GARP, konzentriertes Portfolio (69 Titel)
 Portfoliostruktur Pictet-Agriculture

                                                                                                             5%
                                                                                                        3%
                     5%                                           5%   32%
                              37%   Farm Inputs              5%
                                                                              Australasia                         48%
                                                                                                                        Large Caps
           28%                      Supply Chain                              North America
                                    Services                                                                            Mid & Small Caps
                                                       26%
                                                                              EMEA                                      Micro Caps
                                    Farming
                                                                              South America       44%                   Cash
                                    Cash                                      Cash
                    30%
                                                                   32%

                                                                                                                                           44

Quelle: Pictet, per 31. Juli 2010
Pictet-Agriculture – Portfolioeigenschaften

ƒ Bevölkerungswachstum, wachsender Wohl-
  stand in den Schwellenländern sowie Bio-           SEKTORCHARAKTERISTIKA RELATIV ZUM WELTAKTIENMARKT
  treibstoffe sorgen für eine langfristig steigende       40

  Nachfrage nach Agrarprodukten. Gleichzeitig ist         35                                                                          34,39

  die Anbaufläche nicht beliebig erweiterbar.
                                                          30
ƒ Im Fokus stehen nicht nur Produzenten,
  sondern auch Unternehmen für Lagerung und               25

  Logistik von Agrargütern.                               20

ƒ Der Fonds investiert nur in Aktien, nicht in            15                                                          14,39
  Rohstoffe, da letztere über Spekulation von
                                                                                                                      13,87
                                                                                                                                      11,73

  steigenden Lebensmittelpreisen profitieren.             10                                          9,57
                                                                                                      9,31

  Dies kann nachteilige soziale Folgen haben.               5
                                                                                      2,66                                                            2,66
ƒ Gleichzeitig werden Unternehmen, die mehr als
                                                                                      2,07                                                            1,64
                                                            0

  10% des Umsatzes mit gentechnisch                                  P/BV            PCF Fy1 (exc
                                                                                      financials )
                                                                                                            PE Fy1           EPS Growth Fy1 Div yield Fy1

  veränderten Pflanzen generieren, ausge-
                                                                                         Pictet-Agriculture       MSCI World
  schlossen.
ƒ Trotz einer sehr guten Wertentwicklung des        Quelle: MSCI, IBES, Worldscope, Pictet Asset Management, per 30.06.2010

  Segments in den letzten 12 Monaten sind die
  Bewertungen noch günstig, bei gleichzeitig
  überproportionalem Gewinnwachstum. Leicht
  geringere Dividendenrendite als die Benchmark.

                                                                                                                                                             45
Pictet-Clean Energy
Anlageziel                                        Der Fonds investiert in Aktien von Unternehmen, die vom weltweiten Übergang zu einer geringeren
                                                  Nutzung fossiler Energieformen profitieren. Der Schwerpunkt liegt auf Unternehmen der Bereiche
                                                  erneuerbare Energien, Infrastruktur, Ausrüstung und Technologien sowie Energieeffizienz. Es
                                                  besteht keine Einschränkung in regionaler Hinsicht.
Benchmark                                         MSCI World (nr)
Lancierungsdatum                                  14. Mai 2007
Referenzwährung                                   USD
Fondsmanagement-Team                              Pictet Asset Management (PAM)
                                                  Philippe de Weck,                11 Jahre Investmenterfahrung
                                                  Philippe Rohner                  12 Jahre Investmenterfahrung
                                                  Luciano Diana                    11 Jahre Investmenterfahrung
Fondsvolumen (Mio. USD)                           648         ( -13.9% geschätzte Veränderung des Fondsvolumens in 2010)
                                                  Fonds       Benchmark
Performance (ytd)                                -11.14%       -2.53% Anlagestil : Growth, Small-Mid Cap Bias, konz. Portfolio (67 Titel)

 Portfoliostruktur Pictet-Clean Energy

                    4%
             8%                           Infrastructure                   4%                                     2% 4%
                                    42%                              10%
                                                                                        North America                            Large Cap > USD
                                          Energy Efficiency                                                                32%   10bn
      20%                                                                               Europe          25%                      Mid Cap USD 2bn
                                                                                  54%                                            - 10bn
                                          Technology &                                  Rest of the
                                          Equipment                                                                              Small Cap USD
                                                                                        World                                    150m - 2bn
                                                               32%
                                          Resources                                     Cash                                     Micro Cap < USD
                                                                                                                                 150m
                                          Cash                                                                                   Cash
              27%
                                                                                                                     38%
                                                                                                                                                   46

Quelle: Pictet, per 31. Juli 2010
Pictet-Clean Energy – Portfolioeigenschaften

ƒ Der Fonds investiert nicht nur in Erneuerbare
  Energien, sondern auch in Erdgas, da dieser        SEKTORCHARAKTERISTIKA RELATIV ZUM WELTAKTIENMARKT
  Energieträger als Übergang bis zur                       20

  Konkurrenzfähigkeit CO2-freier Energieträger
                                                                                                                   18,30

                                                           15
  notwendig ist. Nicht in das Portfolio gelangen                                                                   14,39

                                                                                                                                  11,73

  jedoch Nuklear- sowie Kohleenergie.                      10                                       10,14
                                                                                                    9,31

ƒ Außerdem nimmt der Bereich Energieeffizienz                5

  eine wichtige Rolle ein.
                                                                                     2,66                                                         2,66
                                                                                     2,06                                                         1,64
                                                             0

ƒ Im Vergleich zu Wettbewerbern ist der Anteil
                                                            -5
  von größeren Unternehmen, die marktfähige
  Produkte besitzen, tendenziell höher.                   -10

  Unternehmen im Forschungs- und                          -15
                                                                                                                                  -14,17

  Entwicklungsstadium finden i.d.R. keine
                                                          -20
  Berücksichtigung. Keine Investments in                             P/BV            PCF Fy1 (exc         PE Fy1         EPS Growth Fy1 Div yield Fy1
                                                                                      financials )
  ungelistete Unternehmen.
ƒ Im bisherigen Jahresverlauf erlebten Aktien im                                     Pictet-Clean Energy     MSCI World

  Bereich Clean Energy eine ausgeprägte
  Korrektur. Dadurch haben sich die Bewer-          Quelle: MSCI, IBES, Worldscope, Pictet Asset Management, per 30.06.2010
  tungen im Vergleich zum MSCI deutlich
  verbilligt. Die negative Gewinnprognose für den
  Sektor sollte sich im Folgejahr wieder in solides
  Gewinnwachstum umkehren.
                                                                                                                                                         47
Pictet-Timber
Anlageziel                                 Der Fonds investiert in Unternehmen entlang der gesamten Holzindustrie-Wert-
                                           schöpfungskette. Der Schwerpunkt liegt in Unternehmen, die Waldflächen besitzen
                                           oder bewirtschaften, die in der Finanzierung, Verarbeitung, Herstellung und Vertrieb
                                           von Holz für die Bauindustrie tätig sind oder sonstige Dienstleistungen anbieten.
Benchmark                                  MSCI World (nr)
Lancierungsdatum                           30. September 2008
Referenzwährung                            USD
Fondsmanagement-Team                       Pictet Asset Management (PAM)
                                           Gabriel Micheli                            2 Jahre Investmenterfahrung
                                           Christoph Butz                             11 Jahre Investmenterfahrung

Fondsvolumen (Mio. USD)                    100             ( 74.8% geschätzte Veränderung des Fondsvolumens in 2010)
Performance (ytd)                          Fonds          Benchmark
                                           0.14%               -2.53%
Anlagestil                                 GARP, konzentriertes Portfolio (43 Titel)
  Portfoliostruktur Pictet-Timber

                   6%                                                         3% 6%       42%                              6%   30%
                                                                                                                                      Large Cap
                                                                                                   North America     13%
         17%                         27%   Pure Timber Value                                                                          (>5bn USD)
                                                                        19%
                                                                                                   Rest of the
                                           Medium Timber Value                                                                        Mid Cap
                                                                                                   World
                                                                                                                                      (1bn-5bn
                                                                                                   Europe
                                           High Timber Value                                                                          USD)
                                                                                                                                      Small Cap
                                                                                                   Japan                              (
Pictet-Timber – Portfolioeigenschaften

ƒ Die wachsende Weltbevölkerung sorgt für
  steigende Nachfrage nach Holzprodukten (für      SEKTORCHARAKTERISTIKA RELATIV ZUM WELTAKTIENMARKT
  Papier, Bau, Feuerholz etc.), während die              30
  weltweiten Waldflächen schrumpfen.                                                                                             26,86

ƒ Der Fonds investiert nur in börsengelistete            25

  Aktien von Forstunternehmen, nicht in Private          20
  Equity-Beteiligungen. Aktuell sind diese Aktien                                                                 17,95

  ca. 40% günstiger bewertet als vergleichbare           15                                                       14,39

  PE-Transaktionen.                                                                                                              11,73
                                                                                                   10,33
                                                         10
ƒ Dabei werden nur solche Unternehmen gekauft,                                                     9,31

  deren nachhaltige Waldbewirtschaftung                   5

  zertifiziert ist.                                                                 2,66
                                                                                    1,88
                                                                                                                                                2,66
                                                                                                                                                2,29

ƒ Das Anlageuniversum ist – obgleich die meisten          0
                                                                   P/BV              PCF Fy1 (exc          PE Fy1      EPS Growth Fy1 Div yield Fy1

  Unternehmen wenig bekannt sind – mit >200                                           financials )

  Titeln ausreichend breit.                                             Pictet-Timber Fund         MSCI World

ƒ Nach zwei schwierigen Jahren infolge der
  Immobilienkrise in den USA sind die Forst-
  unternehmen wieder auf einen soliden            Quelle: MSCI, IBES, Worldscope, Pictet Asset Management, per 30.06.2010
  Wachstumspfad eingeschwenkt. Gleichzeitig
  hat der Sektor sehr gut performt, wodurch ein
  Teil der Unterbewertung aufgeholt wurde.

                                                                                                                                                       49
Pictet-Water
Anlageziel                                       Der Fonds investiert in Unternehmen, die im Wassersektor tätig sind. Der Schwerpunkt liegt in
                                                 Unternehmen der Bereiche Wasserversorgung und –behandlung, Wassertechnologie und
                                                 Umweltdienste. Es besteht keine Einschränkung in regionaler Hinsicht.

Benchmark                                        MSCI World (nr)
Lancierungsdatum                                 20. Januar 2000
Referenzwährung *                                EUR
Fondsmanagement-Team                             Pictet Asset Management (PAM)
                                                 Hans Peter Portner                               17 Jahre Investmenterfahrung
                                                 Philippe Rohner                                  12 Jahre Investmenterfahrung
Fondsvolumen (Mio. EUR)                          2.348                 ( 31.1% geschätzte Veränderung des Fondsvolumens in 2010)
                                                 Fonds               Benchmark
Performance (ytd)                                9.27%                7.35%
Anlagestil                                       GARP, Small-Mid Cap Bias, konzentriertes Portfolio (71 Titel)

 Portfoliostruktur Pictet-Water

                                                                                           3.1%                                                3%
                     3%                                                                                                                   2%
            13%                 45%                                               18.2%                                                             28%   Large Cap (>5bn
                                          Water Supply &                                                        North America
                                                                                                                                                          EUR)
                                          Treatment
                                                                                                                Europe                                    Mid Cap (
Pictet-Water – Portfolioeigenschaften

ƒ Bei der Wasserver- und entsorgung ist weltweit
  ein riesiger Bedarf an Infrastrukturinvestitionen SEKTORCHARAKTERISTIKA RELATIV ZUM WELTAKTIENMARKT
  notwendig, da einerseits der Wasserverbrauch             18

  kontinuierlich steigt und andererseits die               16                                                       15,75
  Verfügbarkeit sauberen Wassers regional sehr                                                                      14,39

  unterschiedlich ist.
                                                           14

ƒ Diese langfristigen Werttreiber machen                   12                                                                      11,73

  Unternehmen aus dem Wassersektor trotz ihrer             10
                                                                                                    9,31
                                                                                                                                   10,14

                                                                                                    8,77
  „defensiven“ Qualitäten zu strukturellen                  8

  Gewinnern. Dies hat der Markt jedoch bisher               6

  unterschätzt.
                                                            4
ƒ Die Industrie ist stark fragmentiert, so dass die                                  2,66
                                                                                     2,35
                                                                                                                                                   2,66
                                                                                                                                                   2,49
                                                            2
  regionalen Korrelationen gering sind. Zusätzlich
  gibt es einen Trend zur Konsolidierung des                0
                                                                     P/BV             PCF Fy1 (exc        PE Fy1          EPS Growth Fy1 Div yield Fy1

  Sektors, aber auch zur Privatisierung von                                            financials )

  Wasserversorgern aus vormals staatlicher Hand.                                           Pictet-Water        MSCI World

ƒ Der Fonds kombiniert defensive Wasserver-
  sorger mit stärker wachsenden Unternehmen,        Quelle: MSCI, IBES, Worldscope, Pictet Asset Management, per 30.06.2010

  die in der Wassertechnologie tätig sind. Dieser
  Mix schlägt sich in den Bewertungskennzahlen
  nieder, die leicht unter dem MSCI liegen.

                                                                                                                                                          51
Bottom-up stock selection at thematic level
Example: investment process Pictet-Clean Energy

                                           Semi-annual advisory board meeting
      STRATEGIC DEFINITION OF              - review of recent fund performance
        INVESTMENT THEMES                  - update of industry growth trends
                                           - topical discussions related to the themes

                                           Database screening
           IDENTIFICATION                  - identification of companies with relevant theme related activities
      OF INVESTMENT UNIVERSE               - qualitative screening of world equity database of 40’000 companies
   (~730 companies, $2’660bn market cap)
                                           - one formal review of the investment universe each year

                                           Quantitative screening
    CREATION AND MAINTENANCE                Screen of the investment universe for net sales, EBIT, EBITDA to
     OF INVESTABLE UNIVERSE                 determine the percent enterprise value of the overall group related to
   (~250 companies, $660bn market cap)
                                            the theme (minimum 20%) and thus creating the investable universe
                                            of stocks
                                           Portfolio construction and stock selection
           MANAGEMENT                      - screen and calibrate investable universe for purity, trading liquidity and share
     OF INVESTMENT PORTFOLIO                 price volatility in order to determine the initial portfolio weights
               (~100 stocks)               - score all the stocks with initial weight > 0
                                           - screen top quartile, then score the stocks with initial weight ≤ 0

    PICTET-CLEAN ENERGY FUND
           ~60-80 stocks
                                                                                                                            52
Example: Iberdrola Renovables

  INVESTMENT PROCESS EXAMPLE
                                                                                                                                                 Comments

    7%                                                                                                                                           1. Purity: No deduction as 100% of
                  6.0%            0.0%           -4.4%                                                                                              activity is Clean Energy related
    6%
                                                                                                                                                 2. Portfolio construction: Deduction of
    5%                                                                                                                                              4.4% for liquidity and scaled down
                                                                               2.5%            0.0%             4.1%                                pro rata so the sum of initial weights
     4%                                                                                                                                             comprises 50%
     3%                                                                                                                                          3. Company: +2.5% due to good
                                                                  1.6%                                                                              business franchise (score +2.5),
     2%                                                                                                                                             management score (+2.5) and
                                                                                                                                                    valuation score (+2.5).
     1%                                                                                                                                             Company factor= 2.5*30% +
                                                                                                                                                    2.5*20% + 2.4*50% = +2.5%
    0%
                  ht

                                                                                                                                                 4. Industry: No industry discount as
                                                             or
                                                             or

                                                           ht
                ig

                               or

                                                          ct
                                                          ct

                                                         or
              we

                                                 io o

                                                        ig
                                                         *
                             ct

                                                                                                                                                    wind farm fundamentals are good
                                                       fa
                                                       fa

                                                       ct
                                               ct oli

                                                      ht

                                                     we
                           fa

                                                    fa
          ng

                                                    ig
                                          tru rtf

                                                  ny
                                                    n
                         y

                                                we

                                                 io
                                                ry
          ti

                      rit

                                               pa
                                       ns Po

                                              ol
       ar

                                              st
                    Pu

                                            m
                                            al

                                           rtf
    St

                                          du
                                         iti

                                        Co

                                       Po
                                       In
                                      In
                                    co

* Purity, liquidity, and volatility calibrated. The sum of initial weights is calibrated to 50% on a pro rata basis and is a function of the sustainable fund size and the structure of the
investable universe                                                                                                                                                                           53
Source: Pictet Asset Management, as of 30/06/10
Bottom-up stock selection at thematic level
Example: investment process Pictet - Water

                                          Semi-annual advisory board meeting
      STRATEGIC DEFINITION OF             - review of recent fund performance
        INVESTMENT THEMES                 - update of industry growth trends
                                          - topical discussions related to the themes

                                          Database screening
           IDENTIFICATION                 - identification of companies with relevant theme related activities
      OF INVESTMENT UNIVERSE              - qualitative screening of world equity database of 40’000 companies
    (~750 companies, €850bn market cap)   - one formal review of the investment universe each year

                                          Quantitative screening
    CREATION AND MAINTENANCE               Screen of the investment universe for net sales, EBIT, EBITDA to
     OF INVESTABLE UNIVERSE                determine the percent enterprise value of the overall group related to
    (~270 companies, €360bn market cap)
                                           the theme and thus creating the investable universe of stocks

                                          Portfolio construction and stock selection
           MANAGEMENT                     - screen and calibrate investable universe for purity, trading liquidity and share
     OF INVESTMENT PORTFOLIO                price volatility in order to determine the initial portfolio weights
               (~110 stocks)              - score all the stocks with initial weight > 0
                                          - screen top quartile, then score the stocks with initial weight ≤ 0

         PICTET-WATER FUND
             ~60-80 stocks
                                                                                                                           54
Example: Veolia Environnement

  INVESTMENT PROCESS EXAMPLE
                                                                                                                                                   Comments

                                                                                                                                                   1. Purity: no deduction as 70% of
      %                                                                                                                                               activity is water / waste related
   9.0                                                                                                                                             2. Portfolio construction:
   8.0                                                                                                                                                     ƒ No adjustment for liquidity, as
                                                                                                                                                             % of fund exposure bought in
   7.0
                 6.0
                                                                                                                                                             20 days, at 20% volume is >
                                                      0.0
   6.0                                                                                                                                                       5%.
                                                                                            0.9                                  5.4
   5.0                                                                                                         0.0                                         ƒ No deduction as annualised
                                   -1.5                                  4.5
                                                                                                                                                             volatility ~ 42% which is
   4.0                                                                                                                                                       slightly lower than universe
                                                                                                                                                             median of 44%
   3.0
                                                                                                                                                   3. Company factor: 0.8 % due to strong
   2.0
                                                                                                                                                      business franchise (score +1.9),
   1.0                                                                                                                                                negative management score (score
                                                                                                                                                      -0.7) and positive attractiveness
   0.0                                                                                                                                                (score +0.7).
              Starting         Purity factor      Portfolio             Initial         Company         Industry factor       Portfolio               Score = 1.9*30% - 0.7*20% +
               weight                           construction           weight*           factor                                weight                 0.7*50% = +0.8%
                                                   factor
                                                                                                                                                   4. Industry factor : no discount as
                                                                                                                                                      industry fundamentals are positive

* Purity, liquidity, volatility and calibrated. The sum of initial weights is calibrated to 50% on a pro rata basis and is a function of the sustainable fund size and the structure of the
                                                                                                                                                                                              55
investable universe
Source: Pictet Asset Management, as of 31/05/10
Bottom-up stock selection at thematic level
Example: investment process Pictet-Timber

                                          Semi-annual advisory board meeting
     STRATEGIC DEFINITION OF              - review of recent fund performance
       INVESTMENT THEMES                  - update of industry growth trends
                                          - topical discussions related to the themes

                                          Database screening
          IDENTIFICATION                  - identification of companies with relevant theme related activities
     OF INVESTMENT UNIVERSE               - qualitative screening of world equity database of 40’000 companies
   (~200 companies, $600bn market cap)    - one formal review of the investment universe each year

                                          Quantitative screening
   CREATION AND MAINTENANCE                Screen of the investment universe for net sales, EBIT, EBITDA to
    OF INVESTABLE UNIVERSE                 determine the percent enterprise value of the overall group related to
   (~110 companies, $200 bn market cap)
                                           the theme and thus creating the investable universe of stocks

                                          Portfolio construction and stock selection
          MANAGEMENT                      - screen and calibrate investable universe for purity, trading liquidity and share
    OF INVESTMENT PORTFOLIO                 price volatility in order to determine the initial portfolio weights
               (~70 stocks)               - score all the stocks with initial weight > 0
                                          - screen top quartile, then score the stocks with initial weight ≤ 0

        PICTET-TIMBER FUND
            ~40-60 stocks
                                                                                                                           56
Example: Plum Creek

   INVESTMENT PROCESS EXAMPLE                                                                                                                     Comments
           9%
                                                                                                                                                  1.      Purity: no deduction as forest assets
           8%                                                                                                                                             >100% of enterprise value
           7%                                                                                                                                     2.      Portfolio construction: no discount
                        6.0%          0.0%          -0.5%                       0.2%          0.0%          5.7%                                          for liquidity. No deduction for
           6%                                                     5.5%                                                                                    volatility as it is 34%, which is
           5%                                                                                                                                             below universe median of 45%.
                                                                                                                                                          Discount of -0.5% to calibrate
           4%
                                                                                                                                                          initial weights to 60%
           3%
                                                                                                                                                  3.      Company factor: 0.2% due to
           2%                                                                                                                                             business franchise (score +0.0),
                                                                                                                                                          good management score (+1.0) and
           1%
                                                                                                                                                          neutral valuation (+0.0).
           0%                                                                                                                                             Alpha score = 0.0*30% + 1.0*20%
                                                                                                                                                          + 0.0*50% = 0.2%
                                                              or
                       ht

                                                            or
                                    or

                                                            or

                                                           ht
                                                           ct
                     ig

                                                           *
                                                   io o

                                                         ct
                                  ct

                                                         ct

                                                        ig
                                                        ht
                                                        fa
                                                ct oli
                   we

                                                      fa
                                fa

                                                      fa

                                                     we
                                                                                                                                                  4.      Industry: no discount as industry
                                                     ig
                                            tru rtf

                                                     n
               ng

                                                  we

                                                  ry
                              y

                                                  ny
                                        ns Po

                                                 io
                           rit

                                                                                                                                                          fundamentals are good
                                                st
               ti

                                              pa

                                               ol
                                              al
                         Pu
            ar

                                            du

                                           rtf
                                           iti

                                           m
         St

                                         In
                                       Co

                                       Po
                                        In
                                      co

* Purity, liquidity, volatility and calibrated. The sum of initial weights is calibrated to 60% on a pro rata basis and is a function of the sustainable ($500m) fund size and the structure of
                                                                                                                                                                                                  57
the investable universe
Source: Pictet Asset Management, as of 30/06/10
Bottom-up stock selection at thematic level
Example: investment process Pictet-Agriculture

                                          Semi-annual advisory board meeting
      STRATEGIC DEFINITION OF             - review of recent fund performance
        INVESTMENT THEMES                 - update of industry growth trends
                                          - topical discussions related to the themes

                                          Database screening
          IDENTIFICATION                  - identification of companies with relevant theme related activities
     OF INVESTMENT UNIVERSE               - qualitative screening of world equity database of 40’000 companies
    (~700 companies, $1.2bn market cap)   - one formal review of the investment universe each year

                                          Quantitative screening
    CREATION AND MAINTENANCE               Screen of the investment universe for net sales, EBIT, EBITDA to
     OF INVESTABLE UNIVERSE                determine the percent enterprise value of the overall group related to
   (~287 companies, $700 bn market cap)
                                           the theme and thus creating the investable universe of stocks

                                          Portfolio construction and stock selection
           MANAGEMENT                     - screen and calibrate investable universe for purity, trading liquidity and share
     OF INVESTMENT PORTFOLIO                price volatility in order to determine the initial portfolio weights
                                          - score all the stocks with initial weight > 0
                                          - screen top quartile, then score the stocks with initial weight ≤ 0

    PICTET-AGRICULTURE FUND
           ~45-75 stocks
                                                                                                                           58
Investment process example: Mosaic Co

                                                                                                                                                   Comments
  INVESTMENT PROCESS EXAMPLE

                                                                                                                                                   1.      Purity:
                                                                                                                                                           Discount based on resource
          %                                                                                                                                                efficiency: -1.5%.
       7.0                                                                                                                                                 No discount from agriculture
                  6.0%
                                    -1.5%
                                                                                                                                                           exposure.
       6.0

       5.0                                          -0.-7%                                                               4.4%                      2.      Portfolio construction:
                                                                                       0.6%             -0.0%
                                                                      3.8%                                                                                 No discount for liquidity.
       4.0                                                                                                                                                 Discount of 0.7% due to higher
                                                                                                                                                           than average stock price
       3.0                                                                                                                                                 volatility

       2.0
                                                                                                                                                   3.      Company:
       1.0                                                                                                                                                 0.6% taking into account:
                                                                                                                                                           0.9% business franchise,
       0.0                                                                                                                                                 1.3% management score, and
                 Starting       Purity factor     Portfolio           Initial        Company       Industry factor     Portfolio
                                                                                                                                                           0.1% valuation score
                  weight                        construction         weight*          factor                            weight
                                                     factor
                                                                                                                                                           (0.3x0.9+0.2x1.3 +0.5x0.1)

                                                                                                                                                   4.      Industry: No discount

* Purity, liquidity, volatility and calibrated. The sum of initial weights is calibrated to 40-60% on a pro rata basis and is a function of the sustainable ($500m) fund size and the structure
of the investable universe                                                                                                                                                                        59
Source: Pictet Asset Management, hypothetical example
Backtesting methods

ƒ       As all stocks within each fund’s investment universe could not be considered in the
        backtesting (i.e. number of stocks to backtest),
         Æ Need to choose a sub-perimeter in each investment universe

ƒ       Different sub-perimeters have been defined for the backtesting and only one has been
        detailed in this presentation:

                                                                           Include/
Case Sub-perimeter for backtesting                                         Exclude Comments

                                                                                  Investment managers try to invest in high purity stocks to play
    1    Stocks with the highest purity related to each investment theme     3    the investment theme

                                                                                  Small/mid cap bias already soften by market cap weighted
    2    Stocks with the biggest market cap                                  ²    indices
                                                                                  Results not significantly different from case 1

                                                                                  Highest investment manager conviction but insufficient number
    3    Top 10 holdings (as at end of May 2009)                             ²    of stocks for the backtesing

                                                                                  Usually stocks with low liquidity and insufficient number of
    4    Bottom 10 holdings (as at end of May 2009)                          ²    stocks for the backtesing

                                                                                                                                                    60
Correlation and relative performance of EMS Backtesting
Data as per end July 2010

  CORRELATION DATA OF PICTET-ENVIRONMENTAL MEGATREND SELECTION BACK TESTING

                                                                                        Small Cap                                             Emerging European     Japan
                                          EMS backtesting         World Equities                             Footsie          S&P 500
                                                                                       World Equities                                          Equities Equities   Equities
 EMS backtesting                                   1                    0.89                 0.88              0.89              0.77           0.89     0.90       0.67
 World Equities                                                          1                   0.95              0.91              0.95           0.84     0.94       0.72
 Small Cap World Equities                                                                      1               0.86              0.89           0.84     0.90       0.73
 Footsie                                                                                                        1                0.81           0.82     0.93       0.67
 S&P 500                                                                                                                           1            0.70     0.82       0.63
 Emerging Equities                                                                                                                               1       0.87       0.61
 European Equities                                                                                                                                        1         0.64
 Japan Equities                                                                                                                                                       1

  RELATIVE PERFORMANCE OF PICTET-ENVIRONMENTAL MEGATREND SELECTION WITH MAJOR INDICES

       Performance of EMS
      backtesting relative to                       Perf 3Y                  Perf 5Y
    World Equities                                    1.0%                    16.2%
    Small Cap World Equities                         -4.5%                   10.1%
    Footsie                                         14.7%                     31.3%
    S&P 500                                           2.1%                    30.6%
    Emerging Equities                               -12.4%                   -42.1%
    European Equities                                 8.1%                    12.0%
    Japan Equities                                    9.5%                    28.5%

Source: Pictet; backtesting based on purest stocks from each underlying investment universe of Water (60 stocks), Clean Energy (60 stocks),
Agriculture (60 stocks) and Timber (20 stocks)                                                                                                                                61
Water: steady growth at low price volatility

GROWTH AND LOW VOLATILITY

500%
450%                          Water
400%                          Oil

350%
300%
250%
200%
150%
100%
  50%
    0%
           1989

                       1991

                                    1993

                                           1995

                                                  1997

                                                         1999

                                                                2001

                                                                        2003

                                                                                2005

                                                                                          2007

                                                                                                       2009
                                                                               AVERAGE PRICE     VOLATILITY
                                                                                 INCREASE

                                                                       Water       6.4%            3.8%
                                                                       Oil         7.7%           49.2%

Source : American Water Works - Pictet

                                                                                                              62
Water: mostly owned and operated by public entities

  GLOBAL WATER MARKET: A USD 260 BN OPPORTUNITY GROWING AT 6% PER ANNUM

                                                                                                          Population (2009)          Potential
                                                                                                                                      2015

                                                                                                                Already completed
                                                                                                                 privatisation (%)

                                                   29%
                                                                        405m        53%
                                        358m
                                                                                    330m          20%
                                                                        45%
                                         21%
                                                                       Western      10%           1’750m
                                        North                          Europe                                  3%
                                       America                                     Central &                        2’100m
                                                                                 Eastern Europe
                                                                                                    1%                            20%
                      6’828m
                                                     476m        24%
                                      16%                                   721m                                     12%
                                                       18%                                        Middle &
                                                                                          9%      South Asia

                                                   Middle- &                 5%
                                                                                                                South East Asia
                        12%                      South America

                                                                          Middle East
                                                                            & Africa

                        World

Source: David Owen, Managing Director Envisager Ltd, 2007                                                                                        63
Clean Energy: transition to a lower carbon intensity

  CO2 EMISSIONS BY ENERGIES SOURCES

    g CO2/KWh
     1'000

                        857

         800
                                          714

         600
                                                              Average emissions of today’s energy supply1: 530

         400                                       336

         200
                                                                80
                                                                             10            7            4
             0
                        Coal              Oil   Natural Gas    Solar        Wind        Nuclear       Hydro

Source: CLSA, Ecoinvent
1 Pictet Asset Management’s calculation
                                                                                                                 64
Clean Energy: historical evolution of the energy mix

 US ENERGY CONSUMPTION BY TYPE
                                                                  100%

                                                                  90%
        Consumption of products as a % of US energy consumption

                                                                  80%

                                                                  70%

                                                                  60%

                                                                  50%

                                                                  40%

                                                                  30%

                                                                  20%

                                                                  10%

                                                                   0%
                                                                         1850
                                                                                1855
                                                                                       1860
                                                                                              1865
                                                                                                     1870
                                                                                                            1875
                                                                                                                   1880
                                                                                                                          1885
                                                                                                                                 1890
                                                                                                                                        1895
                                                                                                                                               1900
                                                                                                                                                      1905
                                                                                                                                                             1910
                                                                                                                                                                    1915
                                                                                                                                                                           1920
                                                                                                                                                                                  1925
                                                                                                                                                                                          1930
                                                                                                                                                                                                 1935
                                                                                                                                                                                                        1940
                                                                                                                                                                                                               1945
                                                                                                                                                                                                                      1950
                                                                                                                                                                                                                             1955
                                                                                                                                                                                                                                    1960
                                                                                                                                                                                                                                           1965
                                                                                                                                                                                                                                                  1970
                                                                                                                                                                                                                                                         1975
                                                                                                                                                                                                                                                                1980
                                                                                                                                                                                                                                                                       1985
                                                                                                                                                                                                                                                                              1990
                                                                                                                                                                                                                                                                                     1995
                                                                                                                                                                                                                                                                                            2000
                                                                                                                   Wood          Coal      Petroleum           Natural Gas               Hydroelectric Power                 Nuclear Electric Power

Source: U.S: Department of Energy
                                                                                                                                                                                                                                                                                                   65
Clean Energy: where are the renewable energy sources?

 TODAY’S WORLD TOTAL ENERGY SUPPLY

                    Natural Gas                                                                             Solar 0.07%
                      21.0%                                                                                 Wind 0.12%
                                            Nuclear                                                         Renewable waste 0.11%
                                                                      "New renewables"
                                             5.9%                           3.4%                            Biomass gas 0.14%

                                                                                          Geothermal 0.4%   Liquid biomass 0.30%
                                                  Renewables
                                                   12.4%                         Solid
                                                                               Biomass/
                                                                               Charcoal     Hydro 2.2%
                                                                                 9.0%

  Oil
 34.1%                                 Coal
                                      26.5%

Source: International Energy Agency; Statistics: 2009 Renewables Information
                                                                                                                                    66
Timber: Forest resources are limited and over-exploited

                                                      Russia is enforcing a progressive export
                                                      tax on logs likely to choke roundwood
Ontario will permanently exempt                       exports from Russia                                   Russian Far East/Siberia:
225,000 km2 of boreal forest                                                                                Significant resource base, but
from exploitation...                                                                                        logging is often illegal and
                                                                                                            unsustainable

                                                                                                                  Wood imports to China
                                                                                                                  have quadrupled in the last
Mountain Pine Beetle has                                                                                          few years; it is now
destroyed over 13m ha of                                                                                          aggressively pushing
forest in British Columbia…                                                                                       plantations to reduce its
                                                                                                                  dependence on imports

Brazil has a net loss of forest of
over 3m ha per year; unabated
forest conversion might eventually
destroy up to 50% of Brazil‘s forest                                                                            Indonesia is losing its forests
resources                                                                                                       at a rate of almost 2m ha per
                                                                                                                year, mostly due to the
                                                                                                                uncontrolled spread of palm
                   Net forest loss of African tropical                                                          oil plantations and illegal
                   forests has been over 3m ha per                                                              logging
                   year from 1990 to 2005.                                    > 0.50% decrease per year
                                                                              > 0.50% increase per year
                                                                              > Change rate between -0.50
                                                                                                                                                  67
   Source: The world’s forests; FAO 2006 / Pictet Asset Management              and 0.50% per year
Timber: value of forests increases with age

  BIOLOGICAL GROWTH: TIMBER VALUE AND GRADE YIELD IN SOUTHERN YELLOW PINE

                                                                                            HARVEST MIX:
                                                                                           20% PULPWOOD
                                                                     HARVEST MIX:          30% CHIP-N-SAW
     Height
                                                                   42% PULPWOOD            50% SAWTIMBER
     in feet                                                       50% CHIP-N-SAW
                                                                    8% SAWTIMBER        $32/ton average value
                                                                $21/ton average value
           80                               HARVEST MIX:
                                           100% PULPWOOD

           70                            $8/ton average value

           50            pre-
                     merchantable

          30                                                                                             14 in.
                                                                               10 in.                     dia.
                                                       7 in.                    dia.
                              5.25 in.
                                                       dia.
                                dia.

                          8 Yrs                   13 Yrs:               19 Yrs:                24 Yrs:
                                                 1st THIN              2nd THIN            FINAL HARVEST

                                                                                                                  68
Source: Plum Creek Annual Report, 2006
Agriculture: rising income as a challenge
Protein and vegetable oil consumption is growing steadily

  EMERGENCE OF MIDDLE CLASS IN DEVELOPING COUNTRIES                ƒ Especially protein and
  CHANGES DIETARY PATTERNS                                           vegetable oil consumption
                                                                     increases with an increase
       >$10                                                          in wealth
       per day
                                                                   ƒ This will result in shifts in
                                                                     demand within agriculture
       $2-10
       per day
                                                                     from humans consuming
                                                                     agricultural produce to
                                                                     animals
        $1-2         27% of world population
       per day       Most hunger problems solved at 2$ threshold
Agriculture: too much is wasted
Wastage must be reduced to accommodate demand growth

FROM FARM TO PLATE, MUCH IS LOST ALONG THE WAY

 Estimated 20-40% loss
 of yield due to pests,     Transport, Storage, Processing result in estimated loss of 10-15%
 inefficient farming,                             (source: Kader 2005)
 weather, or other causes
 (source: Kader 2005)

                               Wastage estimated for vegetables and fruits in the US to be 23-25%
                                       in retail to consumers (source: Kantor et al 1997)
                                                                                                    70
Global SRI market: approximately USD 5000bn

 GLOBAL SRI MARKET (APPROX. EUR 5000BN)

              Rest of the World
                     8%

            U.S.                          Europe
            39%                            53%

Source: EUROSIF European SRI Study 2008
                                                   71
Breakdown of European SRI market: EUR 2’665bn AuM

 BREAKDOWN OF EUROPEAN BROAD AND CORE SRI MARKET

                                                                  «Core» SRI:
                                          Integration             EUR 512bn
                                           EUR 969
                                                                                Ethical exclusions
                                                                                EUR 398bn
                Engagement
                                                          Core
                 EUR 1,291
                                                        EUR 512                 Best-in-Class
                                                                                EUR 103bn

                                      Simple                                    Environmental & SRI
                                     Exclusion                                  Theme Funds EUR 26bn
                                    EUR 1'204
                                                                                Other positive screens
                                                                                EUR 25bn

                              «Broad» SRI

Source: EUROSIF European SRI Study 2008
                                                                                                         72
This marketing document is issued by Pictet Funds (Europe) S.A.. It is not directed to, or intended for distribution to use by, any person or entity who is a citizen or resident of or located in any
  locality, state, country or jurisdiction where such distribution, publication, availability or use would be contrary to law or regulation. Only the latest version of the fund’s prospectus, regulations,
annual and semi-annual reports may be relied upon as fund publications on the basis of which investment decisions are made. These documents are available on www.pictetfunds.com or at Pictet
                                                                        Funds (Europe) S.A., 3 Boulevard Royal, L-2449 Luxembourg.
              The information and data presented in this document are not to be considered as an offer or solicitation to buy, sell or subscribe to any securities or financial instruments.
 Information, opinions and estimates expressed in this document reflect a judgment at its original date of publication and are subject to change without notice. Pictet Funds (Europe) S.A. has not
    taken any steps to ensure that the securities referred to in this document are suitable for any particular investor and this document is not to be relied upon in substitution for the exercise of
 independent judgment. Tax treatment depends on the individual circumstances of each investor and may be subject to change in the future. You should obtain specific professional advice before
                                                                                       making any investment decision.
  The value and income of any of the securities or financial instruments mentioned in this document can fall as well as rise and, as a consequence, investors may receive back less than originally
                                         invested. Risk factors are listed in the fund’s prospectus and are not intended to be reproduced in full in this document.
Past performance is no guarantee nor a reliable indicator of future results. Performance data does not include the commissions and fees charged at the time of subscribing for or redeeming shares.
This marketing material is not intended to be substitute to the fund’s full documentation and to any information which investors must obtain from their financial intermediaries acting in relation to
                                                                                    their investment in Pictet Funds (Lux).

                                                                                                                                                                                                              73
Sie können auch lesen