In-Situ Research Work of GRS at the Mont Terri Rock Laboratory and Related Modelling Experiments HE-E, FE-M, DM-A, SB-A
←
→
Transkription von Seiteninhalten
Wenn Ihr Browser die Seite nicht korrekt rendert, bitte, lesen Sie den Inhalt der Seite unten
In-Situ Research
Work of GRS
at the Mont Terri
Rock Laboratory and
Related Modelling

Experiments HE-E,
FE-M, DM-A, SB-A,
DB, MB-A, Virtus

GRS - 556

Gesellschaft für Anlagen-
und Reaktorsicherheit
(GRS) gGmbH

In-Situ Research
Work of GRS
at the Mont Terri
Rock Laboratory and
Related Modelling

Experiments HE-E,
FE-M, DM-A, SB-A,
DB, MB-A, Virtus

Klaus Wieczorek
Oliver Czaikowski
Larissa Friedenberg
Kyra Jantschik
Michael Komischke
Michael Kröhn

March 2020

Remark:
This report refers to the research
project 02E11304 which has been
funded by the German Federal Mi-
nistry for Economic affairs and En-
ergy (BMWi).

The work was conducted by
the Gesellschaft für Anlagen- und
Reaktorsicherheit (GRS) gGmbH.

The authors are responsible for the
content of this report.

GRS - 556
ISBN 978-3-947685-41-7
Keywords:
engineered barrier, in-situ testing, numerical simulation, Opalinus clay, THM behaviour
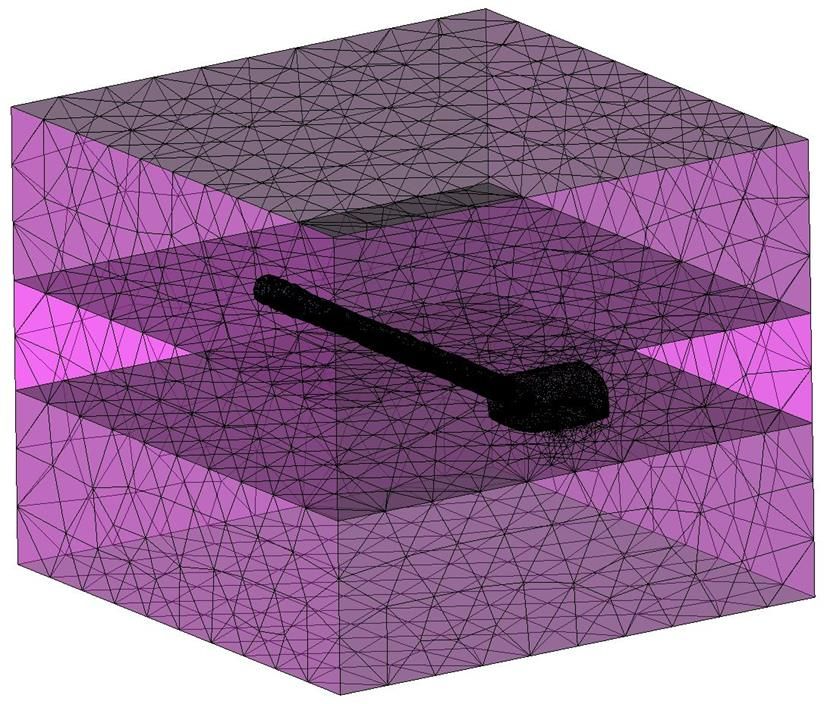
Zusammenfassung

Im vorliegenden Bericht werden die In-situ-Forschungsarbeit der GRS im Felslabor Mont
Terri (MTRL) und die damit verbundenen Modellrechnungen im Zeitraum zwischen 2014
und 2019 dargestellt. Die Arbeiten beinhalten die Teilnahme an großmaßstäblichen Simu-
lationsexperimenten wie dem HE-E und dem FE Experiment, aber auch die Untersuchun-
gen zum hydromechanischen Verhalten (DM-A, SB-A und MB-A Experiment) und zur
Charakterisierung des Opalinustons (DB Experiment).

HE-E und FE wurden bereits vor dem Berichtszeitraum gestartet und haben bereits eine
große Menge zuverlässiger Daten produziert. Sie laufen weiterhin ohne größere Proble-
me, und trotz ihrer langen Dauer ist der Ausfall von Messsensoren begrenzt.

Problematisch ist beim HE-E (Erhitzerexperiment im 1:2 Maßstab) der sehr geringe Po-
renwasserdruck im umgebenden Gebirge, der dazu führt, dass im Inneren des bentonit-
haltigen Buffers bisher keine signifikante Aufsättigung durch Porenwasser aus dem Opali-
nuston festgestellt werden kann – stattdessen nahm die Sättigung im Buffer durch Ver-
dampfung ab. Da sich die Porendruck-Situation nicht verändern wird, kann in den kom-
menden Jahren nicht mit einer Änderung des Sättigungszustandes des Buffers gerechnet
werden. Daher müssen die Experimentpartner entscheiden, ob das Experiment beendet
werden soll und welche Nachuntersuchungen mit welchen Zielen ggf. durchzuführen sind.
Diese Entscheidung braucht einige Vorbereitung und ist für 2020 geplant.

Das FE Experiment wurde in einem neu aufgefahrenen Tunnel in einem ungestörten Be-
reich des Opalinustons mit ursprünglicher Porendruckverteilung aufgebaut. Wegen seines
realistischen Maßstabs (die 1:1 Umsetzung eines Einlagerungstunnels nach dem Schwei-
zer Entsorgungskonzept) ist die Bufferaufsättigung allerdings ebenfalls langsam. Poren-
druckmessungen im umgebenden Opalinuston zeigen abhängig vom Messort den nahezu
ungestörten Druck fern vom FE-Tunnel, den gemäßigt beeinflussten Druck in der Umge-
bung des mit Spritzbeton ausgekleideten Tunnelbereichs und den stark gestörten Druck,
wo in der Tunnelumgebung ein Stahlringausbau ohne Spritzbeton eine weitergehende
Entwicklung von Gebirgsschädigung ermöglichte.

Beide großmaßstäblichen Experimente erfordern Modellsimulationen zu ihrer Interpreta-
tion. Verschiedene Modellierungsgruppen haben solche bereits durchgeführt. Allerdings
fehlt bisher eine realistische Simulation, die die tatsächliche komplizierte Geometrie der
Versuche abbildet. GRS nähert sich dieser Aufgabe mit der Hilfe von Virtus, dem virtuel-

 I
len Untertagelabor. Erste orientierende Modellrechnungen wurden durchgeführt, und ob-
wohl numerische Herausforderungen bestehen, wird ein weiterer Fortschritt erwartet. Das
FE Experiment soll im Rahmen eines Decovalex Tasks simuliert werden, an dem GRS
teilnehmen wird.

Das DB Experiment (Kernbohrung durch die gesamte Opalinuston-Formation) hat eine
große Menge von Daten zum ungestörten Opalinuston geliefert, die sowohl in sich selbst
wertvoll sind, als dass sie auch Anfangs- und Randbedingungen für Modellrechnungen
liefern. Es wurden repräsentative petrophysikalische Daten sowie Temperatur- und
Druckprofile der ganzen Formation ermittelt, die frühere Annahmen bestätigt haben.

Das hydromechanische Verhalten des Opalinustons wurde in den Experimenten DM-A,
SB-A und MB-A untersucht. Bei DM-A wird das Langzeit-Deformationsverhalten beobach-
tet, und es wurde gezeigt, dass Porendruckänderungen im Gebirge nur eine untergeord-
nete Rolle bei der Langzeitverformung spielen. Ob tatsächliches Kriechen, also viskoses
Verhalten, relevant ist oder nicht, konnte noch nicht zweifelsfrei ermittelt werden.

Das MB-A Experiment war ein Mine-by-Versuch, das einen wertvollen Datensatz zum
hydromechanischen Verhalten der sandigen Fazies des Opalinustons geliefert hat. Dazu
gehören Daten zur Spannungsentwicklung, zur Verformung und zur Porendruckentwick-
lung. Für die Interpretation dieses Versuchs sind ebenfalls Modellrechnungen erforderlich.
Ein entsprechendes Experiment, die Simulation des MB-A, ist von den Partnern geplant
und soll 2020 beginnen.

 II

Table of contents

1 Introduction ..............................................................................................1

2 Processes in a nuclear waste repository in claystone ..........................3

3 Mont Terri Rock Laboratory ....................................................................7

4 Overview of experiments ....................................................................... 11

5 In-situ measurements ............................................................................ 13
5.1 Pore-water pressure measurement .......................................................... 13
5.2 Experiments in detail ................................................................................ 16
5.2.1 HE-E ........................................................................................................ 16
5.2.2 FE-M ........................................................................................................ 27
5.2.3 DM-A ........................................................................................................ 35
5.2.4 SB-A ........................................................................................................ 39
5.2.5 DB ............................................................................................................ 41
5.2.6 MB-A ........................................................................................................ 48

6 Model simulation .................................................................................... 57
6.1 Virtus adaptation ...................................................................................... 57
6.2 HE-E simulation ....................................................................................... 61
6.2.1 Geometrical model ................................................................................... 62
6.2.2 Physical model ......................................................................................... 64
6.2.3 Material data and initial parameters .......................................................... 65
6.2.4 Schedule and boundary conditions........................................................... 67

6.2.5 Results ..................................................................................................... 68
6.3 FE-M modelling ........................................................................................ 71

 III
7 Conclusions and future work ................................................................ 75

8 Acknowledgements................................................................................ 77

 References .............................................................................................. 79

 List of figures ......................................................................................... 85

 List of tables ........................................................................................... 91

 IV
1 Introduction

Operation of nuclear power plants creates heat-generating radioactive waste which,
according to international consensus /OEC 08/ and to the concepts most countries us-
ing nuclear power are developing, should be disposed of in deep geological formations.
In different countries, different host rocks are considered owing to their respective geo-
logical situations. In Germany, a decision on the host rock has not yet been taken –
rock salt, claystone, and crystalline rocks are under investigation.

The overall objective of nuclear waste disposal in geological formations is to ensure
permanent containment of the waste, concentrating and isolating it for very long time
from the biosphere. Claystone has a very low permeability, and water pathways are
naturally closed by plastic deformation and swelling. Although claystone in its natural
state is water-saturated, transport processes are dominated by very slow diffusion pro-
cesses. This makes claystone a candidate host rock for a repository, and several Eu-
ropean countries (e. g., France, Switzerland, Belgium) have developed repository con-
cepts in a clay environment.

In Germany, a safety concept for a repository in claystone has been developed in a
joint project of the Bundesanstalt für Geowissenschaften und Rohstoffe (BGR), the
DBE TECHNOLOGY GmbH and the GRS /RUE 14/. Among others, integrity criteria for
the clay rock had to be concretized, since the safety case requires a statement on long-
term integrity of the geological and engineered barriers /BMU 10/.

For constructing a repository and for ensuring that the safety criteria are met over very
long time periods, profound knowledge about the material behaviour of the coupled
system of waste containers, engineered barriers (EBS), and the rock is indispensable.
In addition to theoretical and laboratory-scale work, some countries run underground
research laboratories (URLs) in order to obtain this knowledge, following the guidelines
of OECD-NEA /OEC 01/.

The Mont Terri Rock Laboratory (MTRL) is a unique facility where repository research
is performed in a clay rock environment. It is run by an international consortium which
GRS is a member of, with the motivation of

• Gaining profound understanding of the safety-relevant coupled thermal-hydraulic-
 mechanical (THM) processes running in a repository in clay rock,

 1
• Developing appropriate process models which are needed for long-term prediction
 of the system evolution, by comparison of simulation results with representative la-
 boratory and in-situ experiments,

• Obtaining reliable data for qualification of process models (including development
 and improvement of measuring techniques),

• Gaining knowledge by international co-operation,

• Know-how transfer to German clay formations.

The Opalinus clay at the MTRL is of special interest for Germany, since potential Ger-
man host formations are either the southern German Opalinus clay or northern German
lower cretaceous clays which, when compared to claystones accessible in under-
ground laboratories, seem to be closest to the sandy facies of the Opalinus clay
/HOT 07/.

This report summarizes the GRS in-situ work at the MTRL and related model simula-
tions performed in the frame of various experiments between July 2014 and June 2019.
Additional extensive laboratory work addressing the sandy facies of the Opalinus clay
is presented in a separate report /ZHA 19/. Some of the in-situ experiments were start-
ed before 2014 and intermediate results have been published earlier /WIE 14a,
ZHA 14/. Some will also continue in the future. For these this report describes an inter-
im state.

 2
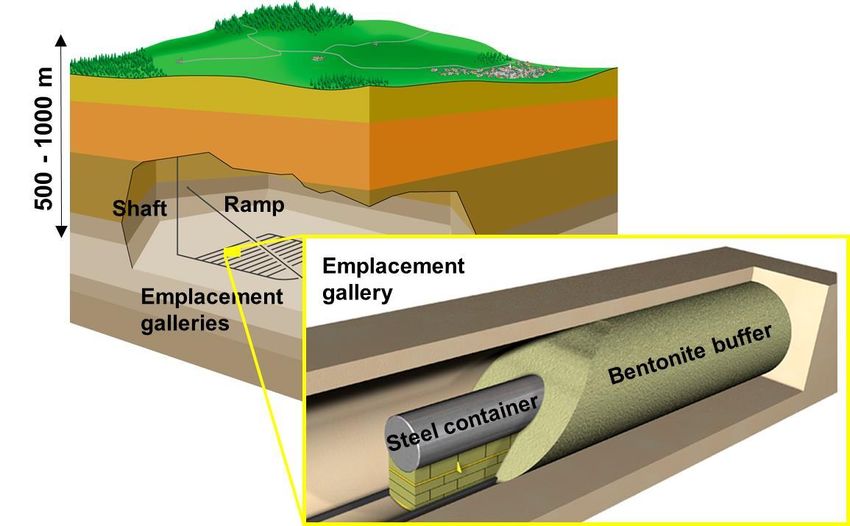
2 Processes in a nuclear waste repository in claystone

In addition to the geological barrier, engineered barriers are required in a repository in
order to account for the disturbance introduced by mining and waste emplacement.
Repository concepts have to include provisions to emplace the waste containers, back-
fill remaining voids and seal galleries and shafts.

Many concepts involve a clay-bearing “buffer” which surrounds the waste containers
and fills the void between them and the host rock. The buffer generally consists of ben-
tonite or bentonite-bearing material and is re-saturated over time by water from the
host rock. This results in an increasing swelling pressure and thermal conductivity and
decreasing hydraulic conductivity. Thus, the buffer provides containment of the waste,
limits advective flow, and enables heat dissipation into the rock. It also provides chemi-
cal buffering and long-term retardation of radionuclides.

Figure 2.1 shows the Swiss repository concept as an example. The waste containers
are placed on highly compacted bentonite blocks in horizontal galleries, and the re-
maining voids are filled with granular bentonite buffer material.

Fig. 2.1 The Swiss repository concept for clay rock /JAE 11/

 3
In Germany, both horizontal disposal in galleries and waste emplacement in vertical
boreholes drilled from access galleries are considered as possibilities. Both concepts
will also involve bentonite-bearing buffer.

Many physicochemical processes which affect system evolution will run in a repository
during the phases of excavation, waste emplacement, and post-closure. These can be
divided into mechanical, hydraulic, thermal, chemical and possibly biological (microbial)
processes which are generally coupled among one another. Figure 2.2 gives an over-
view of the most important processes and the phase in which they are relevant.

Fig. 2.2 Processes in a repository in clay (red: thermal, blue: hydraulic, grey:
 mechanical, yellow: chemical/biological). DB, HE-E, DM-A, FE: selected
 Mont Terri experiments addressing different processes

During excavation, the mechanical state of the rock is changed, an excavation-
damaged zone (EDZ) evolves, and ventilation of the openings may lead to desaturation
of the adjacent rock. Emplacement leads to substantial temperature increase in the
nearfield of the waste, resulting in an increase in pore water pressure due to thermal
strain. During the transient post-closure phase, temperature gradually decreases, while
the buffer is re-saturated by pore water from the surrounding rock which leads to swell-
ing of the bentonite. Buffer swelling and gallery convergence driven by the rock stress
lead to re-compaction and closure of the EDZ.

 4
When, after a few thousand years, the thermal pulse has passed and the pore pressure
in the system has equilibrated, there are practically no more driving forces for thermal-
hydraulic-mechanical processes. Chemical and microbial processes however, like cor-
rosion and related gas generation, chemical interaction between steel containers and
buffer, and alteration processes in the bentonite, will remain active.

All the phases of repository evolution and the related coupled processes relevant in
each phase are addressed by experiments performed by differently grouped partners
at the MTRL.

 5
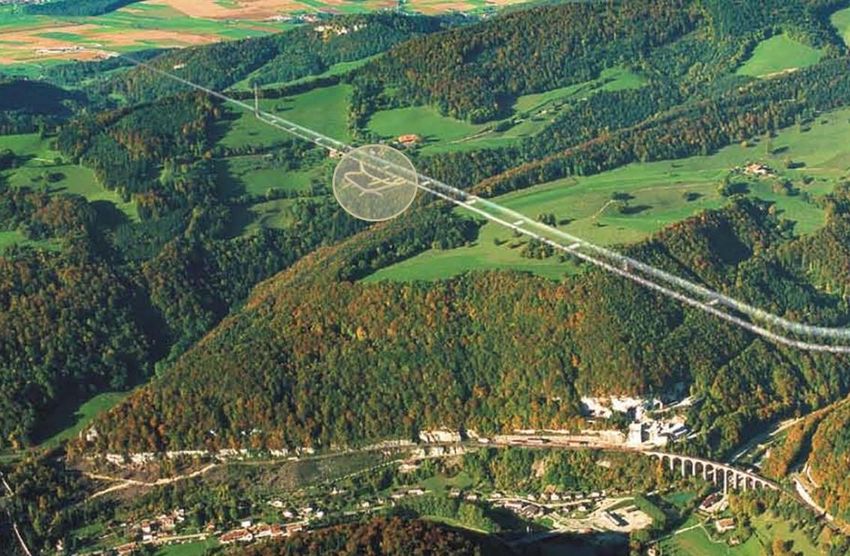
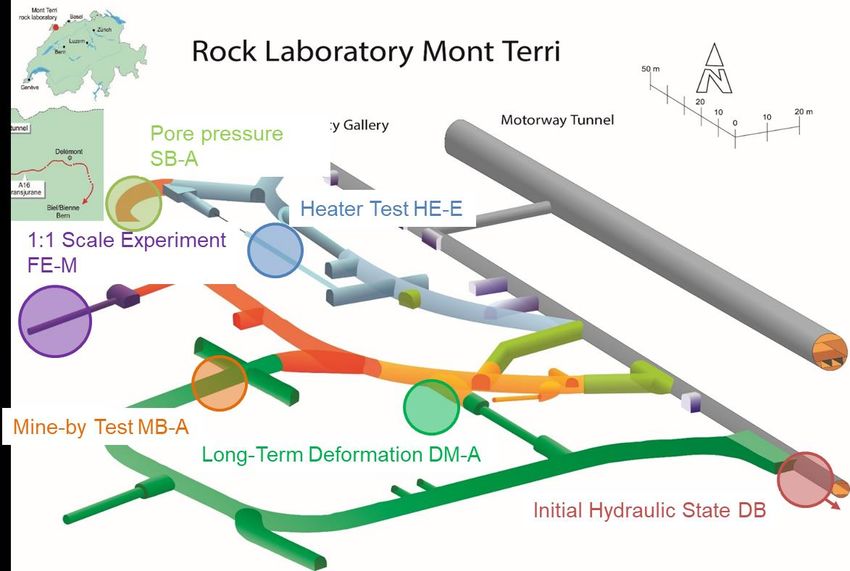
3 Mont Terri Rock Laboratory

The Mont Terri Rock Laboratory /MON 20/ is situated in the north-western part of Swit-
zerland in the Kanton of Jura, where it has been excavated parallel to the security gal-
lery of the Mont Terri motorway tunnel on the south-western slope of the Mont Terri an-
ticline (Figures 3.1 and 3.2). It is run by a consortium of 21 international partners under
the directorate of the Swiss geological survey (Swisstopo). The partners are Swisstopo,
Nagra, ENSI, ETH (Switzerland), ANDRA, IRSN, Total (France), BGR, GRS, Helm-
holtz, BASE (Germany), SCK-CEN, FANC (Belgium), Enresa (Spain), RWM (UK),
JAEA, CRIEPI, Obayashi (Japan), NWMO (Canada), DOE and CHEVRON (USA).
GRS has performed experimental work at the MTRL since 1998.

Fig. 3.1 The Mont Terri Rock Laboratory in the Swiss Jura

The MTRL is located in the Opalinus clay formation consisting of three main facies: the
sandy facies, the shaly facies, and the sandy carbonate-rich facies (Fig. 3.3). The bed-
ding planes plunge towards the south-east with an azimuth of 140° – 150° (Fig. 3.4).
The apparent thickness of the Opalinus clay is about 160 m. Its current overlay varies
between 250 and 320 m, while it is estimated to have reached at least 1000 m in the
past. The clay rock is saturated with water, but water circulations are practically negli-
gible due to its very low permeability and pressure gradient.

 7
Fig. 3.2 The MTRL tunnel system. Different colours of the tunnel system mark
 the respective year of excavation

Fig. 3.3 Plan view of the Mont Terri rock laboratory showing the geology (green:
 recently excavated lab extension with the locations of new experiments)

 8
Fig. 3.4 Geological section along the Mont Terri motorway tunnel showing the lo-
 cation of the rock laboratory (DB borehole: see Section 5.2.5)

More information on the MTRL is given in /BOS 17/ and on the Mont Terri website
/MON 20/.

 9
4 Overview of experiments

GRS’ involvement in the MTRL focuses on the thermo-hydro-mechanical (THM) behav-
iour of the Opalinus clay or of the combined system of clay and engineered barrier. The
locations of the experiments reported here are shown in Fig. 4.1. The experiments are
presented in detail in Section 5.2. Specific measurement methods, especially pore-
water pressure measurement using GRS’ in-house developed minipiezometers, are
used in several of the experiments (Section 5.1).

Fig. 4.1 Experiment locations HE-E, FE-M, DM-A, SB-A, DB, and MB-A

The HE-E heater experiment was started in 2011 as part of the 7th Framework
EURATOM project “Long-term Performance of Engineered Barrier Systems” (PEBS).
The main objective of the HE-E is to gain insight in the early non-isothermal re-
saturation period of the buffer and its impact on the THM behaviour. It has been the
first near real-scale in-situ experiment involving granular buffer at high temperature.

In 2012, Nagra together with some of the Mont Terri partners including GRS started
construction of an emplacement experiment following the Swiss concept at 1:1 scale,
involving a realistic temperature evolution and natural buffer re-saturation. The objec-
tive of the experiment is to study the THM-coupled processes in the clay rock and buff-

 11
er induced by waste emplacement. The monitoring part of this experiment, in which
GRS is involved with the study of pore pressure evolution in the Opalinus clay, is ab-
breviated FE-M.

The DM-A experiment performed by GRS addresses long-term deformation mecha-
nisms of the clay rock. In the frame of this experiment, a borehole dilatometer probe
measures deformation in a horizontal borehole since June 2009. Additional measure-
ments comprise temperature, humidity, and pore pressure in the rock.

In BGR’s SB-A experiment on borehole sealing performance and stability of sealing
material and methods, GRS participated with pore pressure measurements around a
borehole.

The DB experiment addressed the initial (undisturbed) hydraulic state of the rock. A
250 m long inclined borehole was drilled through the Opalinus clay and the neighbour-
ing formations from outside the laboratory. Samples were taken and the borehole was
equipped with a multi-point probe for hydraulic conductivity and pore pressure meas-
urement.

While a wide database on the hydraulic and mechanical (short-term) behaviour is
available for the shaly facies, characterization of the sandy facies is less advanced. In
the MB-A experiment performed by BGR, GRS, and Swisstopo, the rock mass re-
sponse to excavation of Gallery 18 in the sandy facies and the sandy carbonate-rich
facies was investigated (Fig. 2.3).

A part of GRS’ work in the frame of the Mont Terri project was not connected to in-situ
experimentation. The virtual underground laboratory Virtus which had been developed
for a URL in rock salt was adapted for use with the MTRL.

GRS is also involved in an experiment that concentrates on laboratory investigations of
the sandy facies of the Opalinus clay (LT-A) which is not presented here, but in a sepa-
rate report /ZHA 19/.

 12
5 In-situ measurements

The first section of this chapter describes the GRS minipiezometers used for pore-
water pressure measurements in nearly all the experiments reported here. In the sec-
ond section the various experiments are described in detail.

5.1 Pore-water pressure measurement

The fluid pressure inside the undisturbed pore space of the Opalinus clay can be quite
different from the theoretical hydraulic head (e.g., due to osmosis, diffusional or me-
chanical processes). The pore-water pressure is highly important for the hydro-
mechanical behaviour of the rock, but also for the re-saturation of areas bordering ex-
cavations, which can be de-saturated due to the excavation process and to ventilation.
It is also important for the re-saturation of clay-bearing backfill and sealing materials.
Therefore, pore pressure measurements are performed in all experiments where the
hydro-mechanical behavior of the claystone is involved.

Conventional pore pressure measurements involve multi-packer probes installed in
boreholes. The sealing elements (pressurized rubber cylinders) seal off test intervals
inside the borehole which are filled with (possibly artificial) pore-water. With time the
pressure measured in the interval equilibrates with the surrounding pore pressure.

The conventional method has several drawbacks: Drilling of the packer boreholes dis-
turbs the pore pressure field in the vicinity, not only as a consequence of the mechani-
cal load change, but also due to air flushing. The disturbance is related to the borehole
diameter – large diameter boreholes cause large disturbance. A second drawback is
the fact that packer pressure needs to be considerably higher than the pore pressure o
be measured, in order to avoid packer bypass flow. The packer probe therefore influ-
ences the pressure field itself.

To reduce these effects as much as possible, GRS has developed a minipiezometer
system which is installed in small-diameter boreholes (typically 20 mm) and dispenses
with active pressurization.

 13
The system is made up of the following components:

• A single mechanical minipacker with a crown head to be installed at the bottom of a
 small-diameter borehole (Fig. 5.1)

• A coaxial double tubing of stainless steel (outer tube) and polyamide (inner tube) to
 connect the test interval at the borehole bottom with the transducer rack outside
 the borehole (Fig. 5.2, left)

• A rack with valves, pressure gauge, and pressure transducer to which the tubes
 are connected (Fig. 5.2, right)

Fig. 5.1 GRS minipiezometer – photo (left) and sketch (right)

Fig. 5.2 Coaxial tubing (left) and transducer rack (right)

For installation the minipiezometer probe is pushed into the borehole until the teeth at
the front end reach the borehole bottom. The setting tool (right side in the photo of

 14
Fig. 5.1) is then used to load the rubber packer (red in the photo) so that good contact
between the borehole wall and the packer is reached. Afterwards the setting tool is re-
moved and all the void of the borehole above the packer is filled with synthetic resin for
sealing.

The test interval at the borehole bottom is connected to the transducer rack via the co-
axial double tubing allowing for injection and extraction of fluids. After installation, the
test interval is flushed with synthetic pore-water (Pearson water) and then pressurized
to a low overpressure. With time, the pressure in the test interval equilibrates with the
surrounding pore pressure.

The advantages of the minipiezometer system are

• The small borehole diameter reducing the influence of drilling

• No active pressurization of sealing elements

• Sealing of the complete remaining borehole, which avoids pore pressure loss

• Low cost

The system was originally developed for use in crystalline rock at Äspö. It was first
used in Opalinus clay at the MTRL in 2002 /KUL 02/. Since then, it has been success-
fully used in many experiments /ZHA 07, MIE 10, ZHA 14, WIE 14a/.

A drawback of the system is the fact that one borehole can only take one minipiezome-
ter. Also, the borehole length is limited due to the installation procedure. Boreholes up
to 15 m length are feasible and have been used. For such borehole lengths, however,
the 20 mm drill rods are not stable enough. Therefore, longer boreholes are drilled in
42 mm diameter, and only the last 36 mm are drilled with 20 mm diameter. This facili-
tates drilling and installation while keeping the influence of drilling in the vicinity of the
minipiezometer low.

The system described here was installed in the HE-E, FE-M, DM-A, SB-A, and MB-A
experiments reported in the next section.

 15
5.2 Experiments in detail

5.2.1 HE-E

The HE-E experiment was started in 2011 as part of the 7th Framework EURATOM
project “Long-term Performance of Engineered Barrier Systems” (PEBS). The idea of
PEBS was to evaluate the sealing and barrier performance of the EBS with time,
through development of a comprehensive approach, involving experiments, model de-
velopment, and consideration of the potential impact on safety functions /SCH 14/. The
main objective of the HE-E was to gain insight in the early non-isothermal re-saturation
period of the buffer and its impact on the THM behaviour. Particular objectives were to
provide the experimental database required for the calibration and validation of existing
thermo-hydro-mechanical models of the early re-saturation phase and to verify upscal-
ing of the thermal conductivity of the partially saturated buffer from laboratory to field
scale for two types of candidate buffer materials: pure bentonite and sand-bentonite
mixture /GAU 14/. The HE-E experiment has been the first near-real scale in-situ ex-
periment involving granular buffer at high temperature. Detailed information about the
first years of the HE-E can be found in the following PEBS deliverables:

• Design and predictive modelling of the HE-E test (Deliverable D3.2-1) /CZA 12/

• Report on the construction of the HE-E experiment (Deliverable D2.2-3) /TEO 12/

• The HE-E Experiment: Lay-out, Interpretation and THM Modelling (the HE-E final
 report, Deliverable D2.2-11 and D3.2-2) /GAU 14/

An overview is also found in /WIE 14a/.

After completion of the PEBS project in 2014, the experiment partners Nagra, Enresa,
BGR, and GRS decided to continue the HE-E experiment with national funding. In
2016, Obayashi joined in as a fifth partner.

 16
5.2.1.1 Experiment design and construction

The experiment was set up in a microtunnel of 1.3 m diameter which had been used
earlier for the Mont Terri ventilation experiment VE /MAY 07/. Until 2006, the VE exper-
iment was performed in the micro-tunnel. Advantage could be taken of the extensive
instrumentation of the VE section. Only a few additions were needed to complete rock
instrumentation for the HE-E.

The location of the microtunnel in the Mont Terri rock laboratory is marked in Fig. 4.1.
The HE-E experiment (Figs. 5.3 and 5.4) consists of two independently heated sec-
tions, each 4 metres long, separated by a concrete plug. Both sections are equipped
with an electrical heater bedded on highly compacted bentonite blocks. The remaining
void is backfilled with granular bentonite buffer (Section 1) or 65/35 sand/bentonite mix-
ture (Section 2). Especially Section 1 represents Nagra’s emplacement concept in a
near 1:2 scale. The sand/bentonite mixture was chosen as an alternative potential
buffer material after the experiences of the SB experiment /ROT 12/. In the HE-E ex-
periment, the bentonite used for all buffer types was sodium bentonite (Wyoming ben-
tonite).

Fig. 5.3 Overview of the HE-E experiment layout /TEO 12/

 17
The Opalinus Clay around the microtunnel had already been instrumented for the VE
experiment; sensors had been installed in different cross sections (Fig. 5.4): tempera-
ture and pore pressure sensors (SA and SD), temperature and humidity sensors (SB),
and extensometers (SD). In 2010/11, the rock instrumentation was completed by addi-
tional temperature and pore pressure sensors (both minipiezometers installed from in-
side the microtunnel and multipacker probes) and a seismic array.

Fig. 5.4 Longitudinal section of the microtunnel showing the instrumentation
 cross sections /GAU 14/. Sections SA, SB, SD denote rock instrumenta-
 tion, sections N1–N3 and G1–G3 denote buffer instrumentation

The spatial restrictions of the microtunnel proved a challenge for the installation of
heaters, buffer, and instrumentation. The solution was to construct a unit of bentonite
block support, heater liner, and sensor carrier outside the microtunnel which was then
inserted into the tunnel as one package (Fig. 5.5). The sensor carriers support temper-
ature and humidity sensors at defined radial distances from the heater liner in six cross
sections (Fig. 5.4). A total of 18 humidity/temperature sensors were emplaced at the
tunnel wall and an additional 60 humidity/temperature sensors were emplaced within
the sand/bentonite or bentonite section. The position of the sensors is shown in Figs.
5.5 and 5.6. The sensors closest to the heater (first layer) have a distance of 250 mm
to the centre of the tube or 100 mm to the surface of the liner. The second layer of sen-
sors has a distance of 400 mm to the centre or 250 mm to the liner surface. The third
layer of sensors is attached to the wall; the distance to the centre varies with the
roughness of the wall /GAU 14/.

 18
Fig. 5.5 Integrated buffer installation and instrumentation. Left: design of a buffer
 instrumentation module, right: complete bentonite block/liner/sensor car-
 rier module before insertion into the microtunnel /GAU 14/

Fig. 5.6 Position of sensors in the buffer and on the microtunnel wall /GAU 14/

 19
After installation of each block/liner/carrier package the heater was inserted and the
remaining void backfilled with granular buffer material using an auger system (Fig. 5.7,
left). An additional compaction of the buffer was not possible. The three buffer materi-
als (blocks, granular bentonite, and sand/bentonite) were characterized in the laborato-
ry in terms of their petrophysical, thermal and hydraulic properties. Table 5.1 summa-
rizes the basic properties. On-site measurements gave slightly different values for the
granular materials. Emplacement density was estimated by comparison to the total
emplaced buffer mass and the microtunnel volume obtained from a 3D scan of the mi-
crotunnel geometry (Fig. 5.7, right).

Two 4 m long electrical heaters (providing each a maximum power of 2400 W) were in-
stalled in the central steel liner (Figs. 5.4 and 5.5, right). Heaters were designed to be
operated by either power or temperature control, and they function independently for
the two sections. 24 thermocouples (12 for each section), placed on 6 radial planes at
the inner part of the 8 mm thick heater liner allow for monitoring of the heater surface
temperature in four radial directions. Heat transmission between the sections and
through the front and back plug of the test section is limited by the thermal insulation of
the plugs.

Fig. 5.7 Left: Granular buffer emplacement using an auger system, right: 3D im-
 age of the microtunnel test section before installation for volume calcula-
 tion /GAU 14/

 20
Table 5.1 Basic properties of HE-E buffer materials

 Bentonite Blocks Granular Bentonite Sand/Bentonite
Water content (% by 10.34 5.4 4.1
mass)
Bulk density (kg/m³), 1993 1595 1440
preceding laboratory
measurement
Dry density (kg/m³), 1806 1513 1383
preceding laboratory
measurement
Bulk density (kg/m³), 1543 1500
samples prepared as
during emplacement

Installation of the HE-E was finished by mid 2011, and on June 30, 2011 the heaters
were started. Since then, the experiment has been running without major problems.
Three main heating phases can be distinguished: A first phase of 3 months with a line-
ar liner temperature increase to 80 – 90 °C, a second phase with linear temperature in-
crease of another 9 months to reach 140 °C on the liner, followed by the third phase
with a constant liner temperature which has been maintained to date.

5.2.1.2 Monitoring results

Since start-up of heating in 2011, a vast amount of data has been recorded. In this re-
port, only the most important results can be shown. More details about the data accu-
mulated until 2014 can be found in the PEBS reports /GAU 14, WIE 14a/. Since then,
the system showed very little evolution.

As planned, external temperature at the heater liner reached 80 °C on day 95 day of
the heating phase for the sand/bentonite heater (Heater HE-E SB) and on day 93 for
the bentonite heater (Heater HE-E B). The maximal temperature of 140 °C was
reached on day 368 and 390, respectively. Since then the heaters have been run at
constant temperature. The liner temperature in the center of the sand-bentonite section
is shown in Fig. 5.8.

 21
Fig. 5.8 Heater liner temperature in the central part of the sand-bentonite sec-
 tion. Red: top of liner, blue: bottom of liner /AMB 19/

A few electricity supply incidents caused short-term disruptions of the heating, other-
wise the system ran without major problems. Note that the temperature at the top of the
liner is slightly higher than at the bottom. This is due to the higher thermal conductivity
of the bentonite blocks below the liner in comparison to the granular buffer material –
heat is conducted away from the heater more easily at the liner bottom.

Figure 5.9 shows the liner temperature in the center of the pure bentonite section. The
picture is similar to Fig. 5.8, however, the power needed to maintain the constant tem-
perature of 140 °C is slightly different in the two sections of the experiment, as a con-
sequence of a slight difference in thermal conductivity of the various buffer materials.
From October 1 – 3, 2016, an accidental overheating happened in the bentonite sec-
tion, recognizable by the temperature peak up to 200 °C. While the overall effect of this
incident was very small, the difference between top and bottom liner temperature was
larger afterwards. A possible explanation could be an extra drying of the immediate lin-
er vicinity, impairing the contact especially to the granular bentonite.

 22
Fig. 5.9 Heater liner temperature in the central part of the bentonite section. Red:
 top of liner, blue: bottom of liner /AMB 19/

Examples of the temperature evolution in the buffer are shown in Figs. 5.10 and 5.11.
The results shown have been measured in the heater midplane of the sand-bentonite
and the pure bentonite section. Temperature evolution in both sections is very similar
due to similar thermal properties of the two granular materials (the overheating incident
in the bentonite section is not visible in the buffer temperature measurements,
Fig. 5.11). The temperatures in the bentonite blocks (7Bt and 5Bl) are slightly higher
than those at comparable distance from the heater in the sand-bentonite buffer (12C
and 12M, Fig. 5.10) because of the higher thermal conductivity of the blocks. This is
less pronounced in the pure bentonite section due to a slightly higher thermal conduc-
tivity of granular bentonite in comparison to the sand-bentonite. Due to the overall low
thermal conductivity of the dry buffer the thermal gradient is quite high in both sections
(from 140 °C on the heater surface to 45 °C on the microtunnel surface, 12H).

 23
Fig. 5.10 Temperature evolution at selected points in the central part of the sand-
 bentonite section

Fig. 5.11 Temperature evolution at selected points in the central part of the pure
 bentonite section

 24
Relative humidity measurements inside the EBS show a similar behaviour in both
heated sections: a fast increase in the relative humidity close to the rock, with almost
all sensors at that location showing a relative humidity of 100 % before the end of the
second year of heating and a strong reduction in the relative humidity for those sensors
located near the heaters. Figure 5.12 shows this for the sand-bentonite section.

Fig. 5.12 Relative humidity evolution at selected points in the central part of the
 sand-bentonite section

Water vapour is expelled to the outer and cooler parts of the buffer, where full satura-
tion and 100 % relative humidity are reached after 5 months of heating. Similar results
are obtained for the pure bentonite buffer (Fig. 5.13), although it takes about one year
to reach 100 % humidity, due to the higher bentonite content.

Re-saturation of the inner buffer is slow, as it is governed by pore-water supply from
the surrounding clay. As mentioned earlier, the microtunnel was not excavated for the
HE-E, but had undergone a complex de-saturation/re-saturation history during the pre-
ceding ventilation test. Pore pressure measurements in the rock close to the microtun-
nel show that the near-field was and still is in suction, and only at distances over 1 m
from the tunnel surface positive pore-water pressures are observed. Therefore, consid-
erably more time will be needed until a significant re-saturation inside the buffer can be

 25
expected. Since no significant changes in the buffer evolution can be expected during
the next few years, different options of continuing or shutting down the experiment are
currently discussed between the partners.

Fig. 5.13 Relative humidity evolution at selected points in the central part of the
 pure bentonite section

The hydraulic conductivity and swelling pressure of the buffer materials cannot be
evaluated in the in-situ test, since the buffer is still very dry. The pure granular benton-
ite buffer could be installed with a density of more than 1500 kg/m³, which makes ac-
ceptable hydro-mechanical (HM) properties after re-saturation probable. The em-
placement density of the sand/bentonite buffer, however, is very poor (1383 kg/m³).
This is a result of the narrow grain distribution of the material which was chosen to
avoid segregation during the emplacement, and of the impossibility of additional com-
paction after emplacement. Consequently, laboratory measurements showed insuffi-
ciently low permeability /WIE 13/ and too low swelling pressure /VIL 14/ of this material
at the density achieved on site, making modifications necessary.

 26
5.2.2 FE-M

The Swiss repository concept for spent fuel or vitrified high-level waste foresees the
sequential emplacement of self-shielding waste containers in several hundred-metre-
long horizontals in Opalinus clay /MUE 17/. The containers are to be emplaced in the
centre of the tunnel section, resting on highly compacted bentonite blocks. The remain-
ing void is backfilled with granular bentonite (compare the setup of the HE-E, Section
5.2.1.1). The bentonite buffer (blocks and granular bentonite) is an important part of the
engineered barrier system.

The FE (Full-scale Emplacement) experiment was designed by Nagra to realistically
simulate the conditions in a single emplacement tunnel at the MTRL. It involves a real-
istic geometry and temperature evolution and natural buffer re-saturation. The main
aim is the investigation of high-level waste repository induced THM coupled effects on
the host rock and validation of respective models. Further objectives are the technical
feasibility of disposal tunnel construction, the optimisation of buffer material production,
and the investigation of emplacement procedures /MUE 17/. Nagra’s partners in the FE
are Andra, BGR, DOE, FANC, NWMO, and RWM. GRS is taking part in the FE moni-
toring (FE-M), with pore pressure monitoring near the front and rear ends of the gallery
using minipiezometers (Section 5.1). An overview of the FE layout is shown in
Fig. 5.14.

Fig. 5.14 General experiment layout of the Full-scale Emplacement (FE) experi-
 ment at MTRL; sensors and granular backfill are not displayed /MUE 15/

5.2.2.1 Construction and instrumentation

The 50 m long FE tunnel was excavated between April and July 2012. Excavation
steps were limited to 1.5 m/day to allow early rock support to be installed on the same
day /MUE 17/. The rear 12 m of the tunnel are equipped with steel sets and reinforce-

 27
ment mesh (Fig. 5.14). The rest of the tunnel is supported by mesh-reinforced shot-
crete.

Rock instrumentation started already prior to tunnel construction, using boreholes
drilled from the FE cavern (Fig. 5.14). More sensor boreholes were drilled radially from
the tunnel after its construction. Rock sensors include more than 600 temperature sen-
sors, relative humidity and water content sensors, deformation sensors, total pressure
and pore-water pressure sensors. An overview of the instrumentation boreholes is giv-
en in Fig. 5.15. Four GRS minipiezometers were installed around the shotcrete-lined
front part of the tunnel in 6 m deep boreholes drilled from the FE cavern in March 2013.
Another four minipiezometers were placed in 3 m deep radial boreholes around the
rear part of the FE tunnel, plus one piezometer in a borehole of 10 m depth drilled axi-
ally into the heading face, in September 2013. All minipiezometers are equipped with
RTDs (resistance temperature detectors) for additional temperature measurement.

Fig. 5.15 Sketch of the FE monitoring boreholes (red lines). GRS minipiezometers
 are located around the plug (blue area on the left) and at the tunnel rear
 end (blue area on the right)

Figure 5.16 shows impressions from the drilling of the minipiezometer boreholes. For
the minipiezometers at the tunnel rear, the transducer racks had to be installed in wa-
ter-tight boxes (Fig. 5.17) and are no longer accessible because of the tunnel backfill.

 28
Fig. 5.16 Drilling of the minipiezometer boreholes: tunnel front (left), radial bore-
 hole at the tunnel rear (right)

Fig. 5.17 Installation of the transducer racks in the rear part of the tunnel

The positions of the minipiezometers are shown in more detail in Figs. 5.18 and 5.19.

Fig. 5.18 Location of minipiezometers 6 m from the tunnel front

 29
Fig. 5.19 Location of minipiezometers close to the rear part of the tunnel

After completion of rock instrumentation and instrumentation of the tunnel wall, the
granular buffer, bentonite blocks, and three mock-up containers equipped with electri-
cal heaters were emplaced between July 2014 and March 2015 (Fig. 5.20).

Fig. 5.20 Sketch of the emplacement and backfilling sequence in the FE tunnel at
 Mont Terri /MUE 15/

Heating was started in December 2014 with the “deepest” heater. In February 2015,
the central heater and the heater closest to the plug were switched on. The heaters are
power-controlled. For the first heater, power was increased in three steps to the design
value of 1350 W, the other heaters were run at 1350 W from the beginning. Maximum
temperatures on the containers between 130 °C and 150 °C were expected. Fig-
ure 5.21 shows the temperature on the central heater at different locations. The maxi-
mum temperature (on top the heater, compare Section 5.2.1.2) is 131 °C and has re-
mained nearly constant since 2017.

 30
Fig. 5.21 FE central heater temperature evolution at different locations on the con-
 tainer /FIR 19/

5.2.2.2 Pore pressure and related temperature monitoring results

The temperature measured at the minipiezometers located 6 m from the tunnel front is
shown in Fig. 5.22. Start-up of heating leads to a very moderate temperature increase
by about 2.5 °C in more than four years, a consequence of the large distance to the
heaters. Superimposed is a seasonal change in temperature, since the transducers are
only 6 m from the ventilated FE cavern.

Figure 5.23 shows the pore-water pressure measured at the four minipiezometers near
the tunnel front. After a transient period during the ongoing works in the tunnel the
measured pressures stabilized between 0.6 MPa and 1.2 MPa. This is in the range of
what was expected. Seasonal changes are visible also in the pressure curves and can
be correlated to the temperatures. Since 2018 the pressure values seem to increase
steadily, at the same time the rate of temperature rise accelerated (Fig. 5.22).

 31
Fig. 5.22 Temperature measured at the minipiezometers located 6 m from the
 tunnel front

Fig. 5.23 Pore-water pressure measured at the minipiezometers located 6 m from
 the tunnel front

 32
The temperature measured at the minipiezometers located in the rear part of the tunnel
is shown in Fig. 5.24. There is an early and very significant temperature peak in July
2014. The reason is the installation of a concrete wall in the rear part of the tunnel, af-
ter backfilling the last few tunnel metres. The hydration heat of the concrete causes the
temperature peak. With some delay after start-up of heating, temperature rises again at
all measuring points. At the minipiezometers arranged radially around the FE tunnel,
the temperature rise in four years is slightly above 2 °C. At the minipiezometer located
10 m behind the tunnel face (BFEB048, see Fig. 5.19), the temperature rises only by
about 1 °C, because this measuring point is much farther away from the heaters.

Seasonal changes of temperature are not observed, because the minipiezometers in
the rear part of the FE tunnel are far away from any ventilated part of the MTRL.

Fig. 5.24 Temperature measured at the minipiezometers located in the rear part of
 the tunnel

Measured pore-water pressures around the rear part of the FE tunnel (Fig. 5.25) are
rather different from those near the tunnel front. Due to the missing shotcrete lining the
rock is more damaged, which was already detected during drilling of the instrumenta-
tion boreholes. Especially the minipiezometers located in the inclined upward bore-
holes (BFEB044 and BFEB047, see Fig. 5.19) show little more than ambient pressure.
In the inclined downward boreholes (BFEB045 and BFEB046), pressures consolidated

 33
and rise more or less significantly with heating, although they are still lower than the
pressures measured in the front part of the tunnel.

The minipiezometer installed 10 m behind the FE tunnel face (BFEB048 in Fig. 5.25,
left scale) showed a pressure of more than 2.1 MPa shortly after installation, which is
probably higher than the pore pressure in the undisturbed rock, due to increased
stresses in the course of tunnel excavation. Pore pressure diminished slightly with time
due to stress redistribution around the tunnel and has stabilized at 1.8 MPa, which
seems in good agreement with the undisturbed pore pressure (compare Section 5.2.5).

Fig. 5.25 Pore-water pressure measured at the minipiezometers located in the
 rear part of the tunnel (BFEB048: scale on the right)

 34
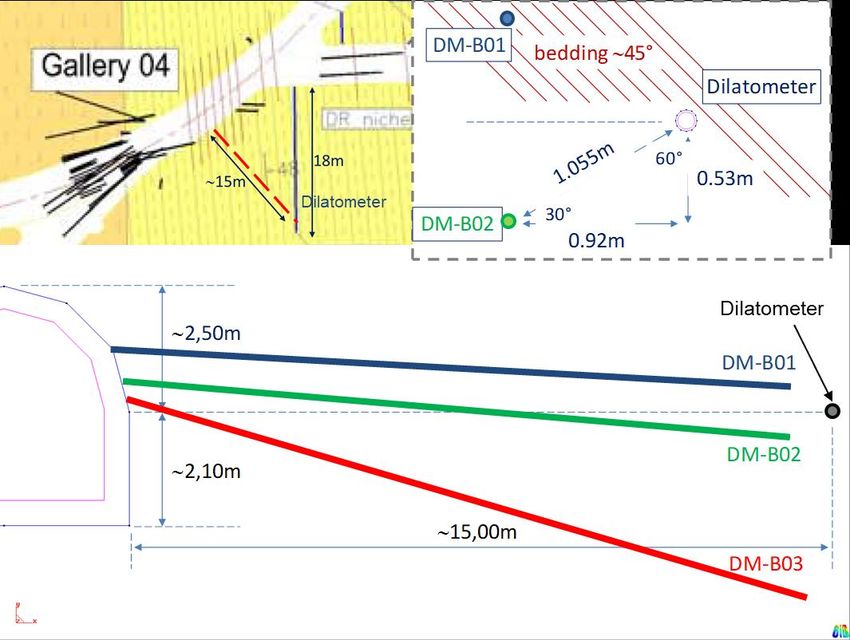
5.2.3 DM-A

The DM-A experiment addresses long-term deformation mechanisms of the clay rock.
In the frame of this experiment, a borehole dilatometer probe was installed in a horizon-
tal borehole of 18 m depth drilled in June 2009 parallel to the bedding. The first four
years of deformation monitoring were already reported /ZHA 14/.

The probe (Fig. 5.26) consists of a packer inflated with water at low pressure
(0.5 MPa). Differently oriented deformation sensors integrated in the packer are thus
coupled to the borehole wall. Borehole wall convergence has been recorded since in-
stallation, as well as temperature and relative humidity in the borehole. When the de-
formation sensors seemed to approach the end of the measurement range, a second
load level with increased packer pressure (1 MPa) was started in November 2011.

Fig. 5.26 Dilatometer probe for borehole deformation monitoring (sensor 1 – 3:
 temperature/relative humidity sensors)

100 % relative humidity was reached at sensor 3 on the borehole wall shortly after in-
stallation. While sensor 2 failed after 18 months, sensor 1 reached 100 % relative hu-
midity about three years after installation. Temperature at sensor 3 (0.5 m from the
tunnel surface) shows the typical seasonal variations, while sensor 1 (16 m in the
borehole) measured a constant temperature of about 14 °C. Before mid of 2017, how-
ever, all coupled temperature/relative humidity sensors had failed.

Figure 5.27 shows the readings of the deformation sensors. At first, only the sensors
no. 2 and 3 worked, and it was assumed that sensor no. 1 had been broken during the
installation. The other two sensor showed different deformation rates at first, but after
the packer pressure increase the curves were nearly parallel, with a deformation rate in
the range of 10-8 s-1. Towards the end of 2015, the vertically oriented deformation sen-

 35
sor no. 1 started measuring. It is assumed that, due to the installation procedure, the
sensor had become stuck and had no contact to the borehole wall. Later this contact
was established and the sensor started measuring.

Fig. 5.27 Deformation sensor readings of the dilatometer probe

With the start of the excavation work of Gallery 18 in March 2018, the deformation
rates of all sensors increased temporarily by 1 – 2 orders of magnitude. At this time,
the SW and CS-D niches were excavated (Figs. 3.3 and 4.1) at a distance between
30 m and 50 m to the dilatometer borehole. The excavation work had a significant ef-
fect on both the air temperature in the MTRL and the rock temperature as shown in
Fig. 5.28 (air and rock temperature are measured about 20 m away from dilatometer
borehole – in a direction away from the excavation). The rock temperature increase by
2 °C is clearly out of the range of the seasonal changes.

After completion of the excavation in the middle of 2019 the deformation rate
(Fig. 5.27) seems to increase again. The reason for this behaviour is not clear yet.

 36
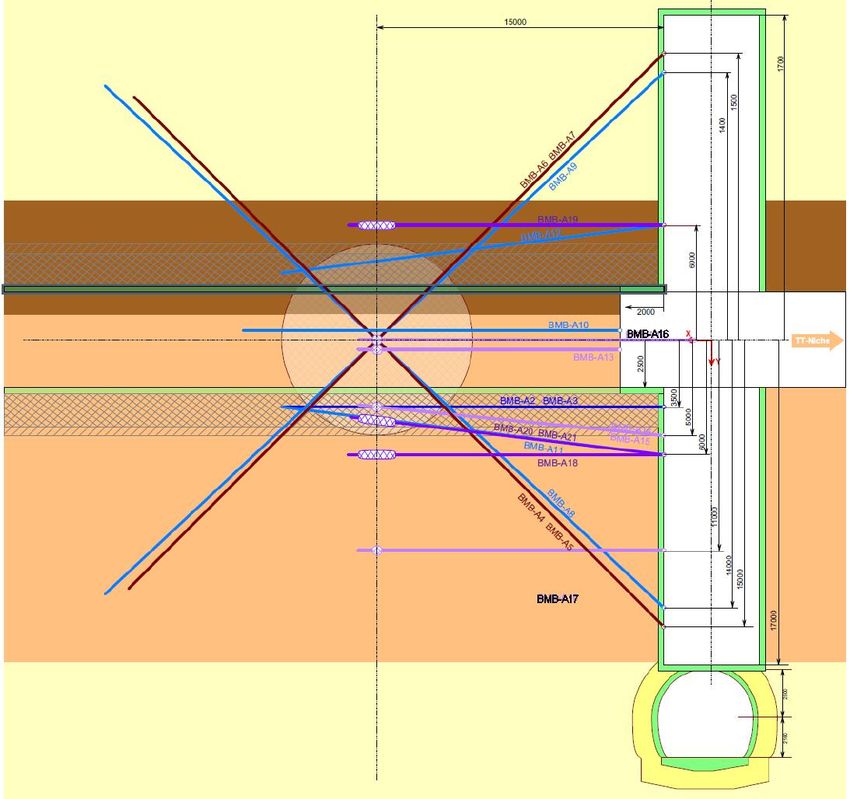
Fig. 5.28 Air and rock temperature measured in the SB niche, about 20 m from
 the dilatometer borehole

An important aspect of the long-term deformation monitoring is the characterization of
deformation mechanisms. Time-dependent deformation can occur as a consequence
of stress and pore pressure changes, swelling/shrinking processes, or damage. It is not
yet clearly proven whether creep, as it is known from rock salt, is relevant. To deter-
mine whether pore pressure changes play a role in the long-term deformation meas-
ured in the dilatometer borehole, a set of minipiezometers had been installed in the vi-
cinity in 2011. Figure 5.29 shows their location in relation to the dilatometer probe. Two
minipiezometers (DM-B01 and DM-B02) are located at about 1 m distance to the
probe, roughly in direction of the bedding and perpendicular to it, respectively. A third
reference minipiezometer (DM-B03) is located about 4 m below the dilatometer, in a
region that is expected not to be influenced by the dilatometer borehole.

The measured pore-water pressure is shown in Fig. 5.30. The reference minipiezome-
ter equilibrates with the surrounding pressure very quickly and shows a stable pressure
of 1.4 MPa, which is increasing very slowly. For the other two minipiezometers, equili-
bration takes much longer, and the measured pressures are much lower: 0.3 MPa par-
allel to the bedding and 1.0 MPa perpendicular (in relation to the dilatometer probe).

 37
Fig. 5.29 Location of minipiezometer boreholes near the dilatometer probe

Fig. 5.30 Measured pore-water pressure at the minipiezometers in the vicinity of
 the dilatometer probe

 38
Between 2015 and 2017 there is no significant change in pore pressure close to the
dilatometer borehole while deformation continues. This is a clear hint that pore pres-
sure change alone cannot be the reason for time-dependent deformation of the Opal-
inus clay. This was also confirmed by earlier model simulations /ZHA 14/. Whether still-
ongoing swelling processes or actual creep are the cause of the borehole wall defor-
mation cannot be decided at the present stage.

With the start of Gallery 18 excavation, the pore pressure near the dilatometer probe
starts increasing (Fig. 5.30), the increase, however, is more gradual than those of tem-
perature and borehole deformation. Pore pressure seems again to play a minor role in
time-dependent deformation.

5.2.4 SB-A

The SB-A experiment was initiated by BGR in 2013 with the aim of testing borehole
sealing materials and methods. Several boreholes (Fig. 5.31) were sealed and tested
in terms of in-situ permeability changes of the total system of sealing material and
borehole EDZ.

In September 2014, GRS drilled and instrumented two minipiezometer boreholes paral-
lel to the test borehole SB-A3 (Fig. 5.32) before the latter was drilled. The idea was to
monitor pore-water pressure prior, during and after drilling of the test borehole.

Figure 5.33 shows the pressure evolution in the two minipiezometers SB-A6 and SB-
A7. After a short equilibration time of three weeks, SB-A6 showed the expected pres-
sure of about 1.5 MPa, while the pressure at SB-A7 was significantly lower (0.7 MPa),
which is possibly due to a near-borehole damage.

The test borehole SB-A3, 0.5 m away from each of the two piezometer boreholes, was
drilled between March 8 and 10, 2016. Both piezometers show an instant reaction: a
pressure increase at SB-A6 and a slight pressure decrease at SB-A7. Afterwards,
pressure at SB-A6 decreases in the long term and stabilises at values comparable to
those of SB-A7. Obviously, the vicinity of SB-A6 was unloaded by the drilling of SB-A3,
so that conditions comparable to SB-A7 were created. The further evolution of the
measured pressures shows, however, that there is no hydraulic shortcut between the
two boreholes, so damage induced by drilling is very limited.

 39
Fig. 5.31 SB-A experiment location and boreholes /HES 16/

 40
Fig. 5.32 Location of minipiezometer boreholes (SB-A6 and SB-A7) in relation to
 the experiment borehole SB-A3 (left), piezometer borehole drilling (right)

Fig. 5.33 Pore-water pressure measured at minipiezometers SB-A6 and SB-A7

5.2.5 DB

For evaluation and prediction of rock performance in the various in-situ experiments
knowledge of the initial mechanical and hydraulic conditions is of special importance.
Measurement of these, however, is not easy, since the original state is disturbed in the
vicinity of the MTRL by the many existing excavations which, by unloading and ventila-
tion, may have a large effect especially on the pore pressure distribution. Pore pres-

 41
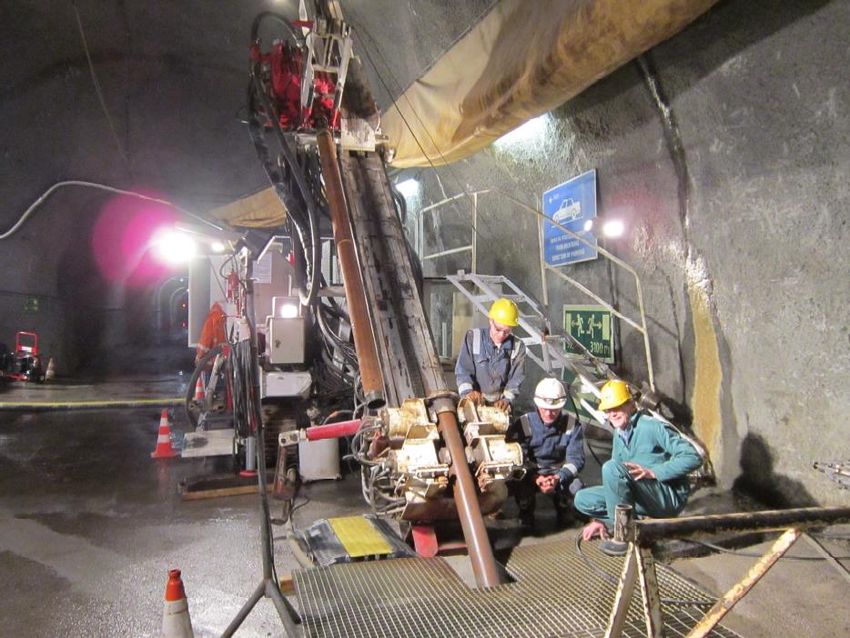
sure, on the other hand, is extremely important since it provides the driving force for
buffer re-saturation and is also an indicator for rock saturation.

In order to gain knowledge on the pore pressure distribution in the undisturbed rock, as
well as on hydraulic conductivity and thermal and chemical potentials, a 247.5 m long
inclined borehole was drilled through the Opalinus clay and the neighbouring for-
mations from the access gallery to the laboratory (BDB-1, Figs. 5.34 and 5.35). Sam-
ples were taken and the borehole was equipped with a multi-point probe for hydraulic
conductivity and pore pressure measurement. This project was run as a joint effort of
Swisstopo, IRSN, Nagra, NWMO, BGR, and GRS. Several detailed reports are availa-
ble /YUC 15, YUC 16, YUC 17/.

Fig. 5.34 Geological cross section of the Mont Terri anticline, showing the location
 of the MTRL (white line) and of the borehole BDB-1 (heavy black line),
 crossing the lower art of the Dogger aquifer, the entire Opalinus clay
 formation and the upper part of the Liassic marls /YUC 17/

 42
Fig. 5.35 Drilling of the 250-m-borehole BDB-1

The borehole was drilled with a diameter of 156 mm and an inclination of 45° in De-
cember 2013 and January 2014. At the end of January, a multipacker probe (Solex-
perts, CH) was installed. Figure 5.36 shows the stratigraphic sequence along the bore-
hole, an overview showing the packer measuring interval locations, and a blow-up of a
single interval. The probe features five double packer testing intervals and an interval
port in the Opalinus clay, a single packer in the Staffelegg formation at the borehole
bottom, and a double packer interval in the lowermost zone of the Passwang formation
above the Opalinus clay /YUC 17/. Intervals were equipped with downhole temperature
sensors and connected to pressure sensors at the borehole collar via stainless steel
lines. Both the test intervals as well as the open borehole spaces between the packers
were filled with Pearson water.

 43
Sie können auch lesen