MARKTBERICHT MARKET REPORT - Bulwiengesa

Die Seite wird erstellt Hildegard-Juliane Metz
 
WEITER LESEN
MARKTBERICHT MARKET REPORT - Bulwiengesa
MARKTBERICHT
MARKET REPORT
Transparenz auf dem      Transparency on
deutschen Markt der      Germany’s Industrial
Unternehmensimmobilien   Real Estate Market

1. Halbjahr 2019         H1 2019
MARKTBERICHT MARKET REPORT - Bulwiengesa
Inhaltsverzeichnis
           Contents

                               Executive Summary                    Die Märkte                                       Nachwort
                                                                        _The Markets                                     _Postscript

                               4 	
                                  Marktbericht Nr. 11 der           6   Der Investmentmarkt für                      46 Hinweise zur Analyse
                                  INITIATIVE UNTERNEHMENS­              Unternehmensimmobilien im 1. Halbjahr 2019      Notes on the Analysis
                                  IMMOBILIEN                            The Investment Market for
                                                                                                                     47 Abbildungsverzeichnis
                                  The Market Report No. 11 of the       Unternehmensimmobilien in H1 2019
                                                                                                                        List of Figures
                                  INITIATIVE UNTERNEHMENS­
                                                                    26 Der Vermietungsmarkt für
                                  IMMOBILIEN                                                                         48 Glossar
                                                                       Unternehmensimmobilien im 1. Halbjahr 2019
                                                                                                                        Glossary
                                                                       The Letting Market for
                                                                       Unternehmensimmobilien in H1 2019             50 Kontakt, Copyright und Disclaimer
                                                                                                                        Contact, Copyright and Disclaimer
                                                                    42 Fertigstellungen und Pipeline für
                                                                       Unternehmensimmobilien
                                                                       Completions and Pipeline for
                                                                       Unternehmensimmobilien

                                                                    44 Marktwerte und Flächenvolumen für
                                                                       Unternehmensimmobilien
                                                                       Market-value and Floor Space for
                                                                       Unternehmensimmobilien

2   Die Märkte | The Markets                                                                                                       1. Halbjahr 2019 | H1 2019   3
MARKTBERICHT MARKET REPORT - Bulwiengesa
Der Marktbericht Nr. 11                                                                                                                           Flächenumsätze nach Objektkategorie in Tsd. m², 1. Hj. 2019

         The Market Report No. 11
                                                                                                                                                  Take-ups by property type in '000 sqm, H1 2019

                                                                                                                                                                  Transformationsimmobilien
                                                                                                                                                        21,0      Converted properties

                                                                                                                                                                                                                Gewerbeparks
                                                                                                                                                                                                       93,5
                         der INITIATIVE UNTERNEHMENSIMMOBILIEN                                                                                                                                                  Business parks
                                                                                                                                                                                                                        Lager-/Logistikimmobilien
                                                                                                                                                                                                              106,5
                         of the INITIATIVE UNTERNEHMENSIMMOBILIEN
                                                                                                                                                                                                                        Warehouse/logistics properties
                                                                                                                                                                    Produktionsimmobilien
                                                                                                                                                           25,0     Light manufacturing properties

                                                                                                                                                                                                 Mangel an Investmentmöglich­                                         _Shortage in Investment Opportunities
                                                                                                                                                                                                 keiten – Mangel bei Flächen                                          and in Accommodation
          Investmentvolumen nach Objektkategorie in Mio. Euro, 1. Hj. 2019
          Investment volume by property category in million euros, H1 2019                                                                                                                       Auch bei den Unternehmensimmobilien ist eine                         The segment for Unternehmensimmobilien, mean-
                                                                                                                                                                                                 hohe Nachfrage nach Investmentobjekten und an                        ing multi-use and multi-let commercial real estate,
                                                                                                                                                                                                 Flächen für Anmietungen festzustellen. Dem steht                     shows a similarly keen demand for properties to
                                                                     Transformationsimmobilien                                                                                                   ein Mangel an beidem gegenüber. Es ist daher                         sell or to let. Either type is in short supply at the
                                                         197,5       Converted properties                                                                                                        nicht verwunderlich, dass das Investmentvolumen                      moment. It comes as no surprise therefore that the
                                                                                                                         438,9
                                                                                                                                 Gewerbeparks                                                    ebenso wie das Vermietungsvolumen im ersten                          investment volume during the first half-year of
                                                                                                                                 Business parks
                                                                                                                                                                                                 Halbjahr 2019 gegenüber dem zweiten Halbjahr                         2019 declined since the second half-year of 2018.
                                                                 Lager-/Logistikimmobilien
                                                      182,2      Warehouse/logistics properties
                                                                                                                                                                                                 2018 zurückgeht.
                                                                                        Produktionsimmobilien
                                                                           265,0        Light manufacturing properties                                                                                                                                                _Third-Highest Transaction Turnover
                                                                                                                                                                                                 Trotz Objektmangel dritthöchster                                     since the Initiative was Formed, Despite
                                                                                                                                                                                                 Transaktionsumsatz seit Bestehen                                     Property Shortage
                                                                                                                                                                                                 der Initiative
                                                                                                                                                                                                                                                                      It is true that the transaction turnover dropped by
                                                                                                                                                                                                 Zwar sinkt der Transaktionsumsatz im Vergleich                       40% compared to the second half-year of 2018.
                         Hohe Objektnachfrage und Flächen­                                                                                                                                       zum zweiten Halbjahr 2018 um 40 %. Mit einer                         But at one billion euros, it was still the third high-
                         bedarf treffen auf immer weniger                                                                                                                                        Mrd. Euro wird aber dennoch der dritthöchste                         est total on record since Initiative Unternehmen-
                         Angebot                                                                                                                                                                 Transaktionsumsatz in der Marktberichterstattung                     simmobilien started its market reporting. The drop
                                                                                                                                                                                                 der Initiative Unternehmensimmobilien erzielt. Das                   in investment volume is explained primarily by the
                         Der deutsche Immobilieninvestmentmarkt ist in                                                                                                                           gesunkene Investmentvolumen lässt sich vor allem                     lack of suitable investment-grade properties.
                         einer lang anhaltenden Hochphase – beflügelt                 _Strong Demand for Property and Floor                                                                      durch das Fehlen geeigneter Investmentobjekte
                         durch die andauernde Null-Zins-Politik der EZB               Space Coincides with Shrinking Supply                                                                      erklären.
                         und eine hohe Liquidität. Ein klarer Wendepunkt                                                                                                                                                                                              _Barely any Accommodation on the
                         lässt sich bislang nicht erkennen. Zwar sind erste           Germany’s real estate investment market is going                                                                                                                                Market – Take-up during First Half-Year
                         Zeichen einer Stimmungseintrübung erkennbar:                 through a sustained peak phase – fuelled by the                                                            Kaum verfügbare Flächen vorhan­                                      of 2019 down to 246,000 sqm
                         Einzelne Marktbarometer wie das Deutsche Hypo                ECB’s sustained zero-interest policy and a high                                                            den – Flächenumsatz im ersten Halb­
                         Immobilienklima1 und der Deutsche Hypo Real                  level of liquidity. There have been no clear signs of                                                      jahr 2019 bei nur 246 Tsd. m²                                        As a result of the short supply in accommodation
                         Estate Economy Index (REECOX2) deuten schon                  a turning point so far. There are admittedly first                                                                                                                              to let, the take-up during the first half-year of
                         seit Längerem an, dass „der Zenit überschritten“             indications of deteriorating sentiment: Certain                                                            Angesichts des geringen Angebots an vermietba-                       2019 dropped to just 246,000 sqm. Making more
                         sein könnte. Doch scheint der Investmenthunger               market barometers such as the Deutsche Hypo                                                                rer Fläche betrug der Flächenumsatz im ersten                        properties available is evidently needed to dissolve
                         vieler Investoren auf deutsche Immobilien längst             Real Estate Climate 1 and the Deutsche Hypo Real                                                           Halbjahr 2019 nur 246.000 m². Offenbar sind                          the bottleneck. This could be done by stepping up
                         noch nicht gestillt zu sein. Dies zeigen zumindest           Estate Economy Index (REECOX 2) have for some                                                              neue Objekte notwendig, um den Engpass wieder                        construction activities or by companies divesting
                         die laufenden Transaktionsmeldungen an. Die                  time now suggested that the cycle has “passed its                                                          aufzulösen. Dies könnte durch eine stärkere Neu-                     themselves of owner-occupied properties and put-
                         Renditen fallen weiterhin und das Investmentvolu-            zenith.” Among many market players, however,                                                               bautätigkeit oder durch Herauslösen von eigenge-                     ting them on the real estate investment market.
                         men befindet sich in den meisten Assetklassen auf            the thirst for German real estate investments is far                                                       nutzten Objekten mit Einbringung in den Immobi-
                         Rekordkurs.                                                  from quenched. Or so the latest transaction                                                                lieninvestmentmarkt erfolgen.
                                                                                      reports suggest. Yield rates continue to harden,
                                                                                      and the investment volume in most asset classes is
                                                                                                                                                                                                                                 Herausgeber und Redaktion durch      Publisher and editing by
                                                                                      at a record high.                                           1) siehe / see www.immoklima.de                                                die Geschäftsstelle der Initiative   the Office of the Initiative
                                                                                                                                                  2) siehe / see www.reecox.de                                                   Unternehmensimmobilien               Unternehmensimmobilien:

4   Executive Summary                                                                                                                                                                                                                                                                       1. Halbjahr 2019 | H1 2019   5
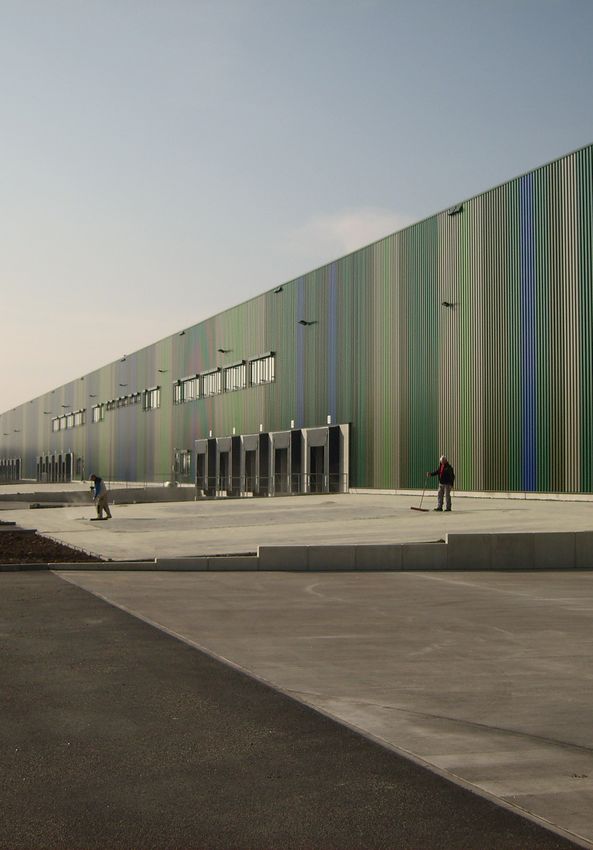
MARKTBERICHT MARKET REPORT - Bulwiengesa
Der Investmentmarkt
                      The Investment Market
                                               für Unternehmensimmobilien im 1. Halbjahr 2019
                                               for Unternehmensimmobilien in H1 2019

                                                                                                                                                                                         Investmentbedarf bei Unterneh­

                                                                                       Quelle/Source: Corestate Capital Group, Fotograf/Photographer: Magnus Contzen, projekt m/c GmbH
                                                                                                                                                                                         mensimmobilien längst noch nicht
                                                                                                                                                                                         gestillt
                                                                                                                                                                                         Das Transaktionsvolumen für Unternehmensimmo-          _Investment Demand for Unterneh-
                                                                                                                                                                                         bilien hat im ersten Halbjahr 2019 erneut auf          mensimmobilien Assets Not Nearly
                                                                                                                                                                                         einem sehr respektablen Niveau gelegen. Lediglich      Satisfied
                                                                                                                                                                                         im ersten Halbjahr 2015 und im ersten Halbjahr
                                                                                                                                                                                         2017 konnten größere Volumina präsentiert wer-         The transaction volume in the Unternehmensim-
                                                                                                                                                                                         den. Das Ergebnis des ersten Halbjahres 2015           mobilien segment maintained an impressive level
                                                                                                                                                                                         wurde nur um 1,1 Mio. Euro verfehlt. Das Ergebnis      during the first half-year of 2019. The only years
                                                                                                                                                                                         des Rekordhalbjahres 2017 mit knapp 1 Mrd. Euro        with yet higher mid-year totals were 2015 and
                                                                                                                                                                                         Differenz dagegen liegt in weiter Ferne. Das           2017. The result of the first half-year of 2015 was
                                                                                                                                                                                         Gesamtjahr 2018 zeigte aber bereits, dass in der       missed by only 1.1 million euros. By contrast, the
                                                                                                                                                                                         zweiten Jahreshälfte viel Potenzial steckt und somit   sum total of the record-breaking H1 2017, being
                                                                                                                                                                                         auch 2019 wieder ein Rekordjahr werden kann.           nearly 1 billion euros higher, was clearly out of
                                                                                                                                                                                         Die Nachfrage ist ungebrochen und selbst die kon-      reach. But the year 2018 as a whole already sug-
                                                                                                                                                                                         junkturellen Risiken kratzen kaum am Anlagebe-         gested that the second half of the year harbours
                                                                                                                                                                                         darf der Investoren. Dem steht derzeit das man-        plenty of potential, and that 2019 could thus
                                                                                                                                                                                         gelnde     Angebot      an     Investmentobjekten      become another bumper year. Demand is as strong
                                                                                                                                                                                         gegenüber. Gerade Transformationsimmobilien            as ever, and even economic risks are barely affect-
                                                                                                                                                                                         und Gewerbeparks sind nur begrenzt am Markt            ing the investors’ need to commit themselves. For
                                                                                                                                                                                         verfügbar. Produktionsimmobilien befinden sich         the time being, this contrasts with the short supply
                                                                                                                                                                                         nach wie vor mehrheitlich im Besitz der Unterneh-      in investment-grade properties. Particularly low is
                                                                                                                                                                                         men und werden nur sehr selten als Investmentob-       the number of conversion properties and business
                                                                                                                                                                                         jekt dem Markt zugeführt.                              parks on the market. The majority of light manu-
                                                                                                                                                                                                                                                facturing properties remain in the possession of
                                                                                                                                                                                                                                                the companies occupying them and are rarely put
                                                                                                                                                                                                                                                on the market as investment properties.

Außenansicht des SIGMA Technopark in Augsburg
Exterior view of the SIGMA Technopark in Augsburg

6              Der Investmentmarkt | The Investment Market                                                                                                                                                                                                     1. Halbjahr 2019 | H1 2019         7
MARKTBERICHT MARKET REPORT - Bulwiengesa
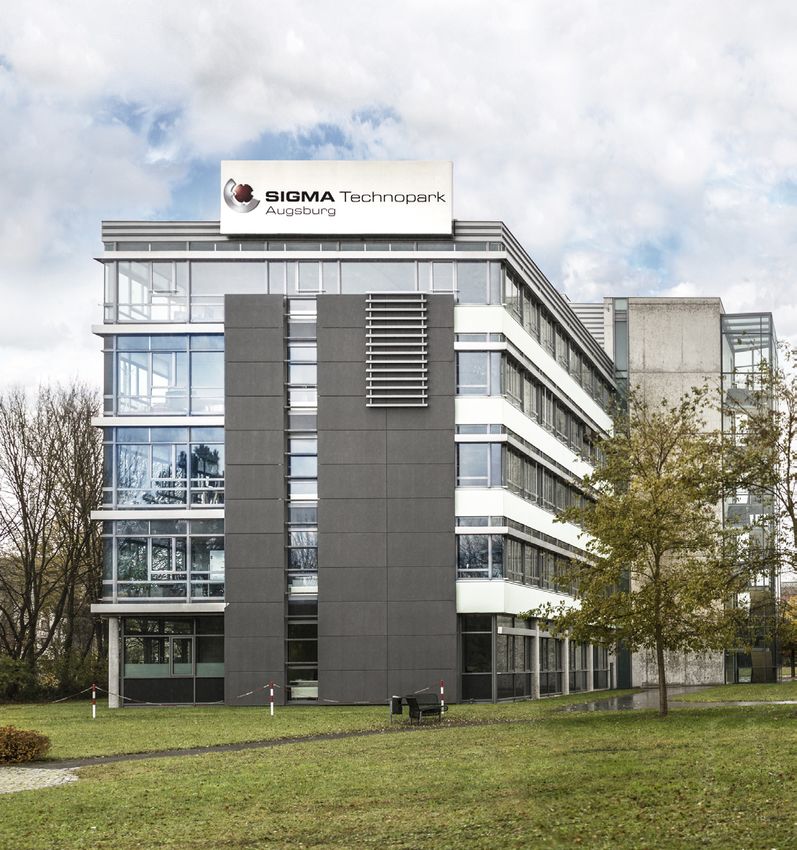
Quelle/Source: Siemens Real Estate
                                                                      Gewerbeparks als begehrteste
                                                                      Objektkategorie

                                                                      Mit Ausnahme der Gewerbeparks (+ 1,3 %) büß-
                                                                      ten zuletzt alle Objektkategorien im Vergleich zum
                                                                      5-Jahres-Schnitt an Transaktionsvolumen ein.
                                                                      Gewerbeparks sind die am stärksten gehandelte               _Business Parks the Most Desirable
                                                                      Objektkategorie im ersten Halbjahr 2019. Mit                Asset Category
                                                                      knapp 440 Mio. Euro Transaktionsumsatz stellten
                                                                      sie knapp 41 % des gesamten Investmentvolu-                 With the exception of business parks (+1.3%), all
                                                                      mens dar. Produktionsimmobilien kamen immerhin              asset categories saw their transaction volumes
                                                                      mit 265 Mio. Euro auf knapp ein Viertel der Trans-          decrease compared to the five-year average. The
                                                                      aktionssumme.                                               fastest-trading asset category during the first half-
                                                                                                                                  year of 2019 was that of business parks. At nearly
                                                                                                                                  440 million euros in transaction revenue, they
                                                                                                                                  accounted for almost 41% of the investment total.
                                                                                                                                  Light manufacturing properties made up nearly one
                                                                                                                                  quarter of the transaction total at 265 million
                                                                                                                                  euros.

                                                                                                                                                                                                                                                                                                                                                                Siemens Technopark in Nürnberg
                                                                                                                                                                                                                                                                                                                                                                Siemens Technopark in Nuremberg

    Abb. 01: Investmentvolumen nach Objektkategorie
    Fig. 01: Investment volume by property category

                              Transformationsimmobilien              Gewerbeparks                Lager-/Logistikimmobilien               Produktionsimmobilien                       Gesamtjahr
                              Converted properties                   Business parks              Warehouse/logistics properties          Light manufacturing properties              Full year

                            3.500

                            3.250
                                                                                                                                                                                                                                                                                  3.005,1
                            3.000

                            2.750                                                                                                                                                                                                                                                                                       2.598,9
                            2.500                                                                                                                        2.358,8

                            2.250
Mio. Euro | million euros

                                                                                                      1.938,9
                            2.000                                                                                                                                                                           1.837,2
                                                                                                                                                                                                                                                                                  464,1
                            1.750
                                                                                                                                                                                                                                                                                                                                            464,7
                            1.500              1.341,8
                                                                                                                                                                                                                                                                                  458,0
                            1.250                                                                                                                                                                                                                                                                                                           237,3
                                                                                                                                                                             195,2
                            1.000                                                                                        458,9                           240,2               159,2
                                                                                                                                                                                                                                                                204,7                                                                                                     265,0
                                                                                                                                                                                                                                                                                                      224,4
                             750                                                                                                                         136,9                                                                                                  198,6                                                                                                     182,2
                                                                                                                         153,0                                               515,5                          256,7                                                                 862,3                                  193,6              796,7
                                                                                                                                                                                                                                                                                                      160,5
                                                  187,8             196,7                            238,5
                             500                                                                                         329,2                                                                              180,0                                                                                                        200,9
                                                   77,6             101,1                                                                                                                                                                                       355,8                                 243,3                                                               438,9
                                                                                                     148,8                                               624,8
                                                  199,1             126,7                                                                                                                                   172,5                                                                                                        147,0
                             250
                                                                                                     287,8                                                                   404,2                                                                              273,2                                 325,1                                 304,5
                                                  220,8             232,0                                                293,6                                                                              195,7                                                                 267,5                                  254,2                                            197,5
                               0                                                                      29,0                                                82,7
                                        H1 2013           H2 2013                          H1 2014             H2 2014                         H1 2015             H2 2015                        H1 2016             H2 2016                                           H1 2017             H2 2017           H1 2018             H2 2018                       H1 2019

    8                                  Der Investmentmarkt | The Investment Market                                                                                                                                                                                                                                                                  1. Halbjahr 2019 | H1 2019              9
MARKTBERICHT MARKET REPORT - Bulwiengesa
Abb. 02: Käufe und Verkäufe nach Akteuren
                                                                                                                                             Fig. 02: Acquisitions and disposals by type of player

                                                                                                                                                                                                   Asset-/Fondsmanager/Private Equity | Asset managers/Private Equity

                                                                                                                                                                                          252,2                                                 210,3

                                                                                                                                                                                                                             Spezialfonds | Institutional funds

                                                                                                                                                                                                                                                      259,0

                                                                                                                                                                                                                             Immobilien AG/REIT | Property PLC/REIT

                                                                                                                                                                                                               26,9                           198,8

                                                                                                                                                                                                            Projektentwickler/Bauträger | Property developers/principals

                                                                                                                                                                                                   143,4                             88,2
                               Akteursgruppen beim Transak­
                               tionsvolumen sortieren sich neu
                                                                                                                                                                                                                             Immobilienunternehmen/Wohnungsgesellschaft | Real Estate companies

                                                                                                                                                                                                                   3,6
                               Der Reigen der am Transaktionsmarkt für Unter-
                               nehmensimmobilien tätigen Akteure hat sich im        _Groups of Actors Reshuffled in Drill-
                                                                                                                                                                                                          Eigennutzer/Industrie | Owner-occupiers/Industrial
                               vergangenen Halbjahr neu sortiert. Asset-/Fonds-     down of Transactions Total
                               manager kauften Objekte für gut 210 Mio. Euro                                                                                                                   169,6                          22,6
                               an, während das Transaktionsvolumen im 2. Halb-      A drilldown of the transactions market for
                               jahr 2018 lediglich 37 Mio. Euro betrug. Das         Unternehmensimmobilien suggests a reshuffling of                                                                       Privat | Private Investors
                               Investmentvolumen lag dennoch ein Drittel niedri-    the market players during the past half-year. Asset/
                               ger als der fünfjährige Schnitt (knapp 368 Mio.      fund managers spent well over 210 million euros,                                                              156,8                       16,5
                               Euro). Als Verkäufer waren sie mit gut 250 Mio.      up from just 37 million euros in transactions dur-
                               Euro jedoch deutlich weniger aktiv als im zweiten    ing the 2nd half-year of 2018. Still, their invest-                                                    Sonstige | Miscellaneous
                               Halbjahr 2018 (372,2 Mio. Euro). Spezialfonds        ment total undercut the five-year average (close to
                               fehlen in diesem Halbjahr auf Verkäuferseite voll-   368 million euros) by one third. On the seller side,                                          319,5                                                       183,6
                               ständig, nachdem sie im zweiten Halbjahr 2018        however, they were much less active at 250 million
                               Immobilien für fast 610 Mio. Euro veräußert hat-     euros than they had been during H2 2018                                                                                                  Öffentlich/Staatlich | Public sector
                               ten. Während sie im Fünf-Jahres-Schnitt bisher mit   (372.2 million euros). Institutional funds were
                                                                                                                                                                                                                   4,6        17,7
                               rund 477 Mio. Euro auf Käuferseite aktiv waren,      almost entirely absent from the seller side during
                               erreicht das von ihnen getätigte Ankaufsvolumen      this half-year, after selling nearly 610 million euros
                               aktuell lediglich rund 260 Mio. Euro. Auch Immo-     worth of real estate in H2 2018. While they used                                                                                         Leasinggesellschaft | Leasing companies
                               bilien-AGs/REITs sind im Vergleich zum Fünf-Jah-     to account for a five-year average of c. 477 million
                               res-Schnitt aktiver beim Ankauf von Unterneh-        euros on the buyer side, the most recently trans-
                               mensimmobilien. Interessant ist im ersten Halbjahr   acted acquisitions added up to c. 260 million euros
                                                                                                                                                                                                                             Bank | Banks
                                                                                    only. Similarly, public property companies/REITs
                                                                                    were busier buying than selling Unternehmensim-                                                                                            27,0
                                                                                                                                                Käufe H1 2019
                                                                                    mobilien, judging by the five-year average. Worth           Acquisitions H1 2019
                                                                                    noting is that players who used to keep to the                                                                                           Geschlossener Fonds | Closed-end funds
                                                                                                                                                Median jährliche Käufe 2014–2018
                                                                                                                                                Median of annual acquisitions 2014–2018
                                                                                                                                                                                                                   7,0
                                                                                                                                                Verkäufe H1 2019
                                                                                                                                                Disposals H1 2019

                                                                                                                                                Median jährliche Verkäufe 2014–2018                                          Offener Fonds | Open-end funds
                                                                                                                                                Median of annual disposals 2014–2018

                                                                                                                                                                                                                             Versicherung/Pensionskasse | Insurance companies/pension funds
                                                                                                                                                Mio. Euro                                                                        55,2
                                                                                                                                                in million euros

                                                                                                                                                750                      500                      250                    0                      250                   500                   750

10   Der Investmentmarkt | The Investment Market                                                                                                                                                                                                                    1. Halbjahr 2019 | H1 2019    11
MARKTBERICHT MARKET REPORT - Bulwiengesa
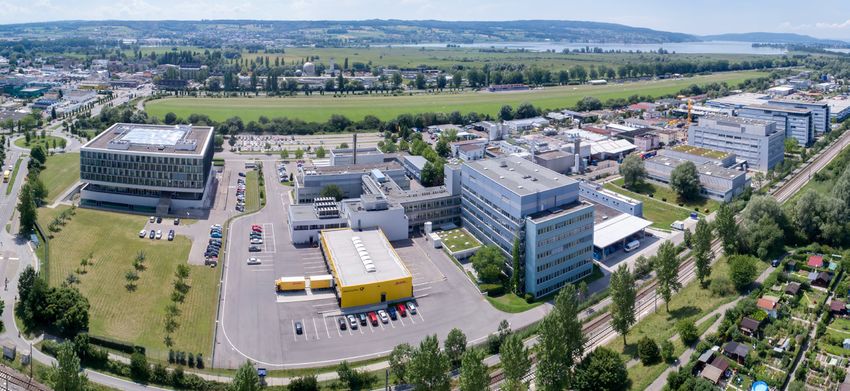
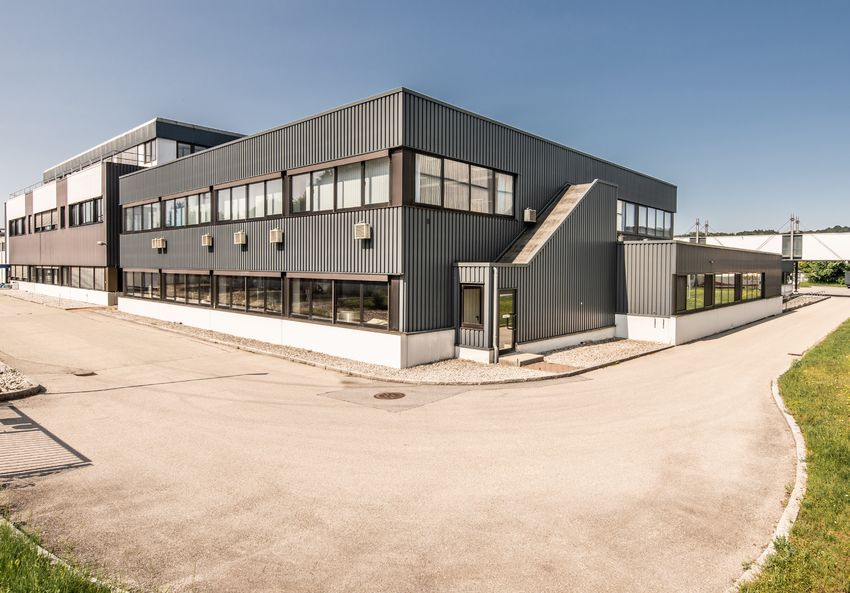
Flurförderfahrzeuge im
                                                                                                                                                                                                                                                                                                                                                    Innenbereich einer Halle
                                                                                                                                                                                                                                                                                                                                                    Forklifts parked inside a hall

                                                                        2019, dass verstärkt Akteure ins Verkaufsgesche-
                                                                        hen eingreifen, die normalerweise nicht so stark in
                                                                        Erscheinung treten. Neben Eigennutzern/Industrie
                                                                        waren dies private Marktteilnehmer sowie die
                                                                        Sammelkategorie der „Sonstigen“. Alle drei
                                                                        genannten Gruppen lagen spürbar über ihrem                                    background became more active on the seller side
                                                                        Fünf-Jahres-Mittel und trennten sich, vermutlich                              in the first half-year of 2019. In addition to own-
                                                                        der guten Marktopportunität wegen, in größerem                                er-occupiers/industrial actors, these represented
                                                                        Umfang von ihren Immobilien.                                                  private market participants and the catch-all cate-
                                                                                                                                                      gory “miscellaneous.” All three of the above
                                                                                                                                                      groups noticeably exceeded their five-year means
                                                                        Investmentvolumen stammt nahezu                                               as they divested themselves of real estate on a
                                                                        vollständig aus Einzeltransaktionen                                           larger scale, probably because of auspicious mar-
                                                                                                                                                      ket opportunities.
                                                                        Portfoliotransaktionen waren in den vergangenen
                                                                        Jahren ein beliebtes Instrument, um eine größere
                                                                        Anzahl von Immobilien in kurzer Zeit zu erwerben                              _Investment Total Composed almost
                                                                        und somit schnell einen Fußabdruck im Markt für                               Entirely of Single Transactions                                 Quelle/Source: Sirius Facilities, Fotograf/Photographer: Marcus Wichert
                                                                        Unternehmensimmobilien zu erzeugen. So
                                                                        basierte der lebhafte Markt im Rekordjahr 2017 in                             In recent years, portfolio transactions proved a
                                                                                                                                                      popular instrument for the purpose of buying up a
                                                                                                                                                      larger number of assets within a short period of
                                                                                                                                                      time and to quickly establish a sizeable footprint in
                                                                                                                                                      the Unternehmensimmobilien market by doing so.
                                                                                                                                                                                                                                                                         großen Teilen auf Portfoliotransaktionen. Auch im
                                                                                                                                                                                                                                                                         zweiten Halbjahr 2018 konnten über 50 % des
                                                                                                                                                                                                                                                                         gesamten Transaktionsvolumens darüber erzeugt
                                                                                                                                                                                                                                                                         werden. Im ersten Halbjahr 2019 fehlten Portfolio-
                                                                                                                                                                                                                                                                         transaktionen in der Assetklasse Unternehmensim-
                                                                                                                                                                                                                                                                         mobilien dagegen fast vollständig. Knapp 1 Mrd.      This is why the lively market action in the bumper
     Abb. 03: Investmentvolumen nach Art der Transaktion                                                                                                                                                                                                                 Euro wurde ausschließlich durch Einzeltransaktio-    year of 2017 was largely due to portfolio transac-
     Fig. 03: Investment volume by type of transaction                                                                                                                                                                                                                   nen generiert. Lediglich das zweite Halbjahr 2015    tions. Similarly, more than 50% of the transaction
                                                                                                                                                                                                                                                                         war hier im Vergleich stärker. Vor diesem Hinter-    total was generated by this type of deal during H2
                                                                                                                                                                                                                                                                         grund ist das Ergebnis für das erste Halbjahr 2019   2018. This contrasts with the trend in portfolio
                            Portfoliotransaktion                Einzeltransaktion                   Gesamtjahr
                            Portfolios                          Single transaction                  Full year
                                                                                                                                                                                                                                                                         durchaus respektabel. Umso wichtiger ist es, dass    transactions, of which there were next to none in
                                                                                                                                                                                                                                                                         dem Investmentmarkt zukünftig weitere Investi-       the Unternehmensimmobilien asset class during
                                                                                                                                                                                                                                                                         tionsmöglichkeiten aus der Industrie und/oder von    the first half-year of 2019. Nearly 1 billion euros
                                                                                                                                                                                                                                                                         Einzeleigentümern zugeführt werden.                  were exclusively generated through single transac-
                                                                                                                                                        3.005,1
                              3.000                                                                                                                                                                                                                                                                                           tions. This has been topped only once so far,
                                                                                                                                                                                                                                                                                                                              namely during the second half of 2015. Against
                              2.750                                                                                                                                               2.598,9                                                                                Investmentmarkt für Unterneh­                        this background, the mid-year total of 2019 was
                                                                                                                                                                                                                                                                         mensimmobilien aktuell weniger                       certainly respectable. This makes it all the more
                              2.500
                                                                                                 2.360,9                                                                                                                                                                 international geprägt                                important for industrial owners and/or private
                                                                                                                                                                                                                                                                                                                              owners to make more investment opportunities
                              2.250
                                                                                                                                                                                                                                                                         In den vergangenen Jahren war der Investment-        available to the market in future.
                                                                       1.927,3                                                                                                                                                                                           markt für Unternehmensimmobilien internationa-
Mio. Euro | million euros

                              2.000
                                                                                                                                                                                                                                                                         ler geprägt. Dies stand häufig mit großen Portfo-
                              1.750                                                                                          1.837,3                                                                                                                                     liotransaktionen in Zusammenhang. Teilweise          _Investment Market for Unternehmens-
                                                                                                                                                          867,4                                                                                                          haben ganze Unternehmen mit ihren Immobilien-        immobilien Less International in
                              1.500
                                                                                                                                                                                                 805,5
                                                                                                                                                                                                                                                                         beständen den Besitzer gewechselt. Hierdurch sind    Character Lately
                                            1.341,4                                                                                                                                                                                                                      viele bekannte Namen wie Valad oder Geneba
                              1.250
                                                                                                                                                                                                                                                                         vom Markt verschwunden – und neue wie Crom-          Over the past years, the investment market for
                              1.000                                                                                                                                                                                                                                      well oder Frasers hinzugekommen. Hier zeigt sich     Unternehmensimmobilien was more international
                                                                                                                 1.432,9
                                                                                      957,4                                                                                                                                                                                                                                   in character. The reason for this was often the
                                750                                                                                                          788,6                                                                                                                                                                            transaction of large portfolio deals. In some cases,
                                                                                                                                                          1.184,4
                                                                                                                                                                                    478,0                     999,4                                                                                                           entire companies complete with their real estate
                                500                                                                                            447,7                                   882,0                     997,7
                                                                                                    418,8                                                                                                                                                                                                                     holdings changed hands. Many known names,
                                                           566,3
                                              594,8                     514,0
                                250
                                                                                                                                                                                                                                                                                                                              such as Valad or Geneba vanished from the market
                                                                                      372,8                                                  334,6                                  317,7                                                                                                                                     this way while new names entered it, e.g. Crom-
                                                                                                    264,7        244,5         266,4
                                              53,5         126,8        83,2                                                                                           71,3                                   84,2
                                  0                                                                                                                                                                                                                                                                                           well or Frasers. During the first six months of
                                        H1 2013       H2 2013      H1 2014      H2 2014       H1 2015       H2 2015      H1 2016       H2 2016       H1 2017      H2 2017      H1 2018      H2 2018      H1 2019

    12                                Der Investmentmarkt | The Investment Market                                                                                                                                                                                                                                                            1. Halbjahr 2019 | H1 2019              13
MARKTBERICHT MARKET REPORT - Bulwiengesa
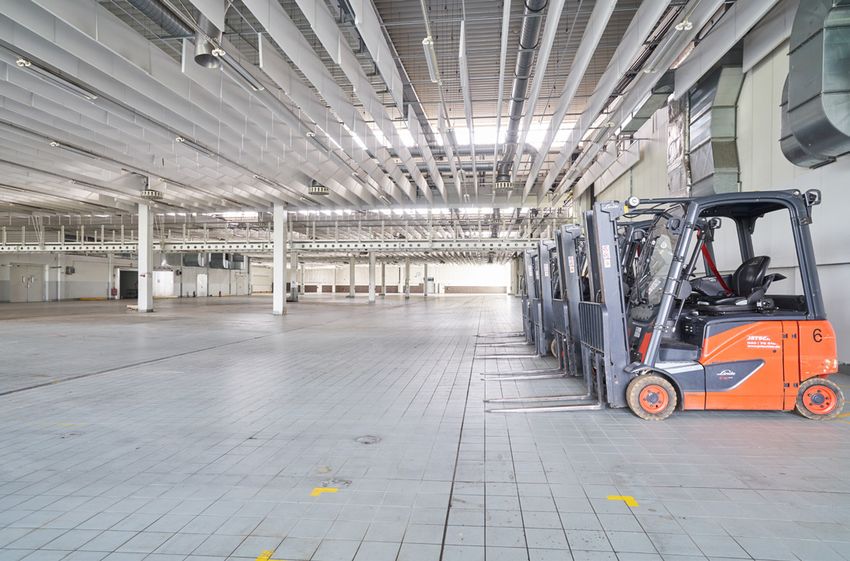
Quelle/Source: Garbe
                                                der Transaktionsmarkt im ersten Halbjahr 2019
                                                wieder etwas gesetzter und lokaler. Nationale
                                                Marktteilnehmer legten um über 20 % zu und
                                                prägen den Markt mit einem Anteil von über
                                                83 % auf der Käuferseite. Auf Verkäuferseite sieht                    2019, the transactions market settled down and
                                                es nahezu identisch aus. Solche hohen Anteile der                     had a more local feel. Domestic market players
                                                Inländer gab es in der bisherigen Berichterstattung                   increased their market share by more than 20%
                                                der Initiative Unternehmensimmobilien noch nie.                       while dominating the buyer side with a share of
                                                Vor allem der Anteil europäischer Marktteilnehmer                     more than 83%. The seller side presented a virtu-
                                                ging massiv zurück. Während in der vergangenen                        ally identical picture. Never before did a report of
                                                Periode noch knapp 35 % aus dem europäischen                          the Initiative Unternehmensimmobilien register
                                                Ausland stammten, waren es im Berichtszeitraum                        such high market shares. Particularly rapid was the
                                                nur noch gut 15 %. Es ist zu erwarten, dass sich                      decline in market share for players form other
                                                dies erst dann maßgeblich ändert, wenn die Port-                      European countries. Having claimed almost 35%
                                                foliotransaktionen wieder zunehmen.                                   of the market as recently as the previous period,
                                                                                                                      the market share of actors from elsewhere in
                                                                                                                      Europe dropped to just over 15%. It is safe to
                                                                                                                      assume that the distribution will not seriously shift
                                                                                                                      back until portfolio transactions regain their
                                                                                                                      momentum.

Abb. 04: Käufe und Verkäufe nach Herkunft der Akteure
Fig. 04: Acquisitions and disposals by origin of players

     Deutschland                    Europa                   Nordamerika                     Australien                    Asien                  Nahost                            Sonstige
     Germany                        Europe                   North America                   Australia                     Asia                   Middle East                       Other

100 %
                2,5 %                                            2,2 %       1,4 %                                1,0 %        1,4 %      1,8 %        1,8 %          1,8 %
                                                    3,3 %                    4,0 %                   5,7 %                                             2,2 %                         5,1 %
                2,0 %
                           10,0 %       9,9 %       3,4 %        5,5 %                                                         9,1 %
                8,1 %                                                        5,9 %      19,3 %                                                                          15,2 %
 90 %
                           2,7 %        2,4 %                                                        9,6 %                                                                           13,7 %
                                                                                                                  25,6 %                                25,5 %
                                                    21,1 %                                                                                 34,8 %
 80 %           12,5 %                                           21,9 %      14,2 %
                                       18,0 %
                                                                                        11,7 %
                           33,8 %                                                                                 2,8 %        37,9 %
 70 %

 60 %

 50 %

                                                                                                     83,4 %
                                                                             74,5 %                                                                                     83,2 %       81,2 %
 40 %
                74,8 %                              71,5 %                                                        70,0 %                                70,4 %
                                        68,9 %                   69,9 %                  68,9 %
                                                                                                                                           63,2 %
 30 %
                           53,5 %                                                                                              51,4 %

 20 %

 10 %

  0%
         Käufer     Verkäufer    Käufer      Verkäufer    Käufer     Verkäufer    Käufer      Verkäufer    Käufer      Verkäufer    Käufer     Verkäufer          Käufer      Verkäufer
        Purchaser    Seller     Purchaser     Seller     Purchaser    Seller     Purchaser     Seller     Purchaser     Seller     Purchaser    Seller          Purchaser       Seller
          2013        2013        2014         2014        2015        2015        2016         2016        2017         2017        2018        2018            H1 2019       H1 2019

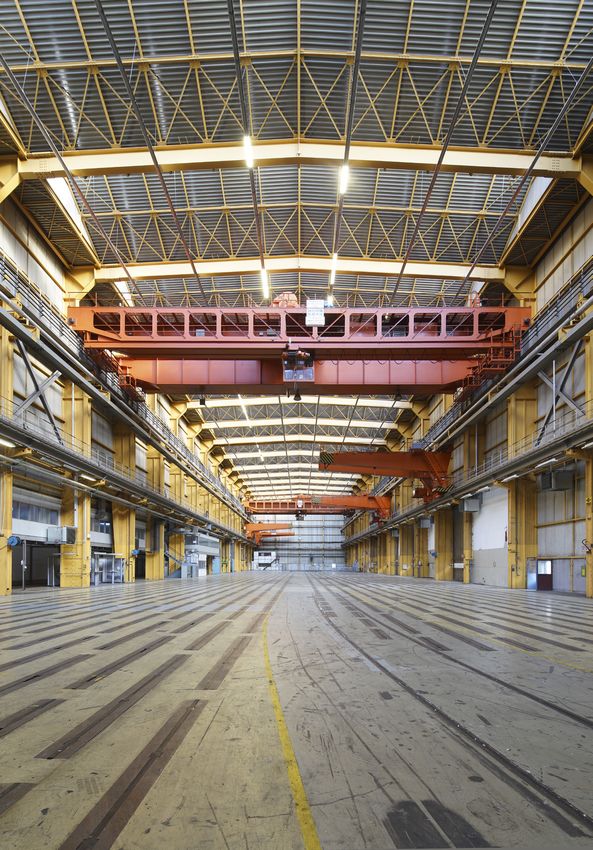
                                                                                                                                                                                                                      Außenansicht des Rudolph Multi-User Logistikzentrums
14             Der Investmentmarkt | The Investment Market                                                                                                                                                               Exterior view of the Rudolph multi-user logistics centre
MARKTBERICHT MARKET REPORT - Bulwiengesa
Abb. 05: Bruttoanfangsrenditen* nach Objektkategorie
Fig. 05: Gross initial yields* by property category

                                                                                                                                                                                                                                        Renditekompression kommt
                 Max. Rendite
                 Max. yield                                                                                          *Die erzielbaren Renditen werden als Bruttoanfangsrendite (BAR)
                                                                                                                                                                                                                                        weitgehend zum Stillstand
                                                                                                                       ausgewiesen. Sie stellen den Quotienten der Nettorohmieteinnah-
                 Durchschnittsrendite
                 Average yield
                                                                                                                       men und der Nettokaufpreise zum Zeitpunkt der Transaktion dar.
                                                                                                                      Sie berücksichtigt somit die Ertragskraft als auch den Wert einer
                                                                                                                                                                                                                                        Die Renditekompression der vergangenen Jahre               _Yield Compression has Largely Levelled
                 Marktübliches Spektrum
                                                                                                                       Immobilie und unterscheidet sich damit von einer langfristigen
                                                                                                                       Performancekennziffer wie dem GPI. Eine Definition der Bruttoan-
                                                                                                                                                                                                                                        war einer der prägenden Effekte im Immobilienin-           out
                 Standard market spectrum
                                                                                                                      fangsrendite (BAR) sowie des GPI sind im Glossar aufgeführt.                                                      vestmentmarkt. Dieses trifft auf die Wohn- und
                 Spitzenrendite                                                                                                                                                                                                         Büroimmobilienmärkte ebenso wie auf die Unter-             The yield compression of recent years was one of
                 Prime yield
                                                                                                                     *The achievable yields are posted in gross initial yields (GIY).                                                  nehmensimmobilien zu. Von einer weiteren Rendi-            the defining effects on the real estate investment
                 Min. Rendite                                                                                          It represents the ratio of the net rental income and the net purchase
                 Min. yield                                                                                            price at the time of the transaction. Accordingly, it reflects both                                              tekompression ist bei den Unternehmensimmobi-              market. This goes for the residential and office real
                                                                                                                      the profitability and the value of a given property, which sets the ratio                                         lien allerdings nicht auszugehen.                          estate markets as much as for the Unternehmen-
                                                                                                                       apart from long-term performance indicators such as the GPI.
                                                                                                                       For a definition of the gross initial yield (GIY) and the GPI, please                                                                                                       simmobilien market. Yet it is safe to assume that
                                                                                                                       see the glossary.                                                                                                                                                           the yields of Unternehmensimmobilien will harden
                                                                                                                                                                                                                                                                                                   no further.

Transformationsimmobilien                                                                                                                                                                         Lager-/Logistikimmobilien
Converted properties                                                                                                                                                                              Warehouse-/logistics properties

14 %                                                                                                                                                                                              14 %

12 %                                                                                                                                                                                              12 %

10 %                                                                                                                                                                                              10 %

8%                                                                                                                                                                                                8%                                                                                                                                                     8,3 %
                                                                                                                                                                                         7,4 %
                                                                                                                                                                                                                                                                                                                                                         6,6 %
6%                                                                                                                                                                                       6,1 %    6%

                                                                                                                                                                                         4,4 %                                                                                                                                                           4,6 %
4%                                                                                                                                                                                                4%                                                                                                                                                     4,1 %
                                                                                                                                                                                         3,6 %

2%                                                                                                                                                                                                2%

0%                                                                                                                                                                                                0%
       H1 2013       H2 2013        H1 2014      H2 2014      H1 2015      H2 2015      H1 2016      H2 2016      H1 2017       H2 2017         H1 2018          H2 2018       H1 2019                   H1 2013   H2 2013   H1 2014   H2 2014   H1 2015   H2 2015   H1 2016   H2 2016   H1 2017       H2 2017     H1 2018     H2 2018     H1 2019

Gewerbeparks                                                                                                                                                                                      Produktionsimmobilien
Business parks                                                                                                                                                                                    Light manufacturing properties

14 %                                                                                                                                                                                              14 %

12 %                                                                                                                                                                                              12 %

10 %                                                                                                                                                                                     10,3 %   10 %
                                                                                                                                                                                         9,1 %
                                                                                                                                                                                                                                                                                                                                                         8,7 %
8%                                                                                                                                                                                                8%
                                                                                                                                                                                                                                                                                                                                                         7,6 %

6%                                                                                                                                                                                       6,1 %    6%
                                                                                                                                                                                                                                                                                                                                                         5,3 %
                                                                                                                                                                                         4,5 %                                                                                                                                                           4,5 %
4%                                                                                                                                                                                                4%

2%                                                                                                                                                                                                2%

0%                                                                                                                                                                                                0%
       H1 2013       H2 2013      H1 2014     H2 2014      H1 2015      H2 2015      H1 2016      H2 2016      H1 2017       H2 2017         H1 2018         H2 2018           H1 2019                   H1 2013   H2 2013   H1 2014   H2 2014   H1 2015   H2 2015   H1 2016   H2 2016   H1 2017       H2 2017    H1 2018     H2 2018          H1 2019

16               Der Investmentmarkt | The Investment Market                                                                                                                                                                                                                                                      1. Halbjahr 2019 | H1 2019                17
sämtliche Level einander an – wenn auch sehr
                                                                                                                                                                   langsam. Während sich die Spitzenrendite nur
Außenansicht der Rheinhöfe, einer Transformationsimmobilie in Düsseldorf
Exterior view of the Rheinhöfe, a converted property in Dusseldorf                                                                                                 marginal bewegt, sinkt die Durchschnittsrendite
                                                                                                                                                                   weiter um rund 20 Basispunkte ab.

                                                                                                                                                                   Lager-/Logistikimmobilien noch                          albeit at a very slow pace. While prime rents are
                                                                                                                                                                   von Renditekompression geprägt                          showing only marginal movement, the average
                                                                                                                                                                                                                           yield continued to drop by around 20 basis points.
                                                                                                                                                                   Nach den Transformationsimmobilien weist die
                                                                                                                                                                   Objektkategorie Lager-/Logistikimmobilien die nied-
                                                                                                                                                                   rigste Spitzenrendite aus. Diese Entwicklung verläuft   _Warehouse/Logistics Properties still
                                                                                                                                                                   analog zu den großflächigen Logistikimmobilien          Defined by Yield Compression
                                                                                                                                                                   (nicht Teil der Betrachtung im Rahmen der IUI), bei
                                                                                                                                                                   denen dieser Effekt noch stärker zu beobachten ist.     Warehouse/logistics properties show the lowest
                                                                                                                                                                   Aufgrund des hohen Bedarfs und Anlagedrucks sin-        prime yield after conversion properties. This devel-
                                                                                                                                                                   ken hier die Renditen weiter ab, wenn auch mit          opment is progressing in analogy to large-scale
                                                                                                                                                                   deutlich geringerer Dynamik als in der Vergangen-       logistics real estate (a segment not covered by the
                                                                                                                                                                   heit. Lager-/Logistikimmobilien im Verständnis der      IUI reporting) where the effect is even more con-
 Quelle/Source: BEOS AG, Fotograf/Photographer: Jens Küsters
                                                                                                                                                                   Initiative Unternehmensimmobilien erreichen im          spicuous. Due to the keen demand and pressure to
                                                                                                                                                                   aktuellen Marktumfeld Spitzenrenditen von 4,6 %         invest, yield rates keep hardening, albeit at a much
                                                                                                                                                                   BAR.                                                    slower pace than they used to. Warehouse/logis-
                                                                                                                                                                                                                           tics properties as defined for the purposes of the
                                                                                                                                                                                                                           Initiative Unternehmensimmobilien trade at prime
                                                                                                                                                                   Produktionsimmobilien stagnieren                        yields of 4.6% GIY in the present market
                                                                                                                                                                   bei der BAR                                             environment.
                                                  Transformationsimmobilien weisen
                                                  die geringste Bruttoanfangsrendite                                                                               Die BAR für Produktionsimmobilien entwickeln sich
                                                  auf                                                                                                              derzeit vergleichbar zu den drei anderen betrachte-     _Flatlining GIY for Light Manufacturing
                                                                                                                                                                   ten Objektkategorien. Der Renditelevel bewegt sich      Properties
                                                  Transformationsimmobilien weisen mit 4,4 % die         _Conversion Properties Show the Lowest                    nur marginal und kann am ehesten mit einer Stagna-
                                                  geringste Bruttoanfangsrendite (BAR) auf und liegen    Gross Initial Yield                                       tion beschrieben werden. In der Spitze wird derzeit     At the moment, the GIY of light manufacturing
                                                  sogar unterhalb des Wertes für Lager-/Logistikimmo-                                                              eine BAR von 5,3 % erzielt.                             properties is developing in analogy to the other
                                                  bilien. Im Vergleich vom ersten Halbjahr 2019 zum      Conversion properties are on record with the low-                                                                 three asset categories discussed here. The yield
                                                  zweiten Halbjahr 2018 sind dies jedoch 10 Basis-       est gross initial yield (GIY) at 4.4%, which is actu-                                                             level is showing marginal movement only, and can
                                                  punkte mehr. Auch die anderen Renditelevel sind mit    ally lower than the rate for warehouse/logistics                                                                  be most aptly described as stagnation. At peak
                                                  Ausnahme der Minimalrenditen leicht angestiegen.       properties. At the same time, the figure marks a                                                                  level, the current GIY equals 5.3%.
                                                  Dieses liegt unter anderem daran, dass nur wenige      gain by 10 basis points between H2 2018 and H1
                                                  Transformationsimmobilien für mögliche Ankäufe         2019. The other yield level softened slightly, too,
                                                  am Markt angeboten werden. Spotlight-Objekte ste-      with the exception of the minimum yield rates. This
                                                  hen dabei sogar nur in Ausnahmefällen zur Verfü-       is due to the fact that only a few conversion prop-
                                                  gung, wodurch das aggregierte Risikoprofil in höhe-    erties were offered as potential sales on the mar-
                                                  ren Renditen mündet. Insgesamt gesehen ist die         ket, among other reasons. Spotlight properties are
                                                  Renditeentwicklung jedoch mit einer Stagnation zu      actually available only in exceptional cases, with the
                                                  beschreiben. Der hier beschriebene Effekt beim Risi-   aggregated risk profile reflected in higher yields. All
                                                  koprofil kann grundsätzlich auch auf die anderen       things considered, however, the yield performance
                                                  Objektkategorien der Unternehmensimmobilien            is clearly flatlining. The effect described here in
                                                  übertragen werden, sofern dem Markt nicht weitere      regard to the risk profile can principally be applied
                                                  Objekte mit niedrigem Risikoprofil zugeführt wer-      to other Unternehmensimmobilien asset catego-
                                                  den.                                                   ries, as long as no other assets with a lower risk
                                                                                                         profile are put on the market.

                                                  Gewerbeparks mit größtem Rendite­
                                                  spread                                                 _Business Parks Show Widest Yield
                                                                                                         Spread
                                                  Der größte Spread zwischen den Minimal- und
                                                  Maximalrenditen kann mit 5,8 % bei Gewerbe-            The widest spread between minimum and maxi-
                                                  parks festgestellt werden. Auch die Spanne zwi-        mum yield rates was registered for business park
                                                  schen Spitzen- und Durchschnittsrendite ist mit        at 5.8%. The spread between prime and average
                                                  3 % sehr ausgeprägt. Aktuell nähern sich               yield is also rather pronounced at 3%. At the
                                                                                                         moment, the gaps are narrowing across the board,

18             Der Investmentmarkt | The Investment Market                                                                                                                                                                                1. Halbjahr 2019 | H1 2019       19
Abb. 06: Investmentvolumen nach Region
                                                                                                                                                   Fig. 06: Investment volume by region

                                                                                                                                                                           Investmentvolumen aller Regionen               Region West                                    Verdichtungsraum Rhein-Ruhr                Hamburg und Umland
                                                                                                                                                                           Investment volume of all regions               Western region                                 Conurbation Rhine-Ruhr                     Hamburg and greater area

                                                                                                                                                                           Region Nord                                    Region Süd                                     Stuttgart und Umland                       Berlin und Umland
                                                                                                                                                                           Northern region                                Southern region                                Stuttgart and greater area                 Berlin and greater area
                               Die Regionen abseits der Verdich­
                                                                                                                                                                           Region Ost                                     Verdichtungsraum Rhein-Main-Neckar             München und Umland
                               tungsregionen dominieren den                                                                                                                Eastern region                                 Conurbation Rhine-Main-Neckar                  Munich and greater area

                               Investmentmarkt
                               Auf die Region Nord entfällt mit knapp 19 %            _Regions Outside the Conurbation                                                                                                                                                                  2.051,8
                               (202,3 Mio. Euro) ganz klar der größte Anteil des      Regions Dominate the Investment
                               Transaktionsvolumens an Unternehmensimmobi-            Market                                                                                                                                                                                               256,3
                               lien. Im Vergleich zum vorangegangenen Halbjahr                                                                                                                                                                                                               28,6
                               verzeichnete der Norden im ersten Halbjahr 2019        The Northern Region accounts for nearly 19%                                                                                                                                                          262,7
                               ein Wachstum von knapp 254 % und im Vergleich          (202.3 million euros) and thus clearly for the larg-                                                                                                                                                 259,3                            1.803,2
                               zum 5-jährigen Mittel um 210 %. Die separat            est share of the transaction volume in Unterneh-                                                                                                                                                     238,0
                               betrachteten Städte Hamburg und München mit-           mensimmobilien assets. During the first half-year                                                                                                                                                    511,4
                                                                                                                                                                                                                                                                                                                                44,6
                               samt ihrem Umland haben im Vergleich zur Vorpe-        of 2019, the North registered a growth by almost                                                                                                                                                       72,0
                                                                                                                                                                                                                                                                                                                                92,5
                               riode um knapp 50 % (München) bzw. knapp               254% over prior half-year and by 210% compared                                                                                                                                     1.032,3           138,1                                          1.083,6
                                                                                                                                                                                                                                                                                                                                16,8
                               33 % (Hamburg) an Investmentvolumen verloren,          to the five-year mean. The separately examined cit-                                                                                                                                                  121,9
                                                                                                                                                                                                                                                                                                                              113,6
                               sind aber mit gut 14 % (153,4 Mio. Euro) sowie         ies of Hamburg and Munich, each with their                                                                                                                                               23,3        163,6                                              202,3
                                                                                                                                                                                                                                                                                                                               272,5
                               15 % (162,7 Mio. Euro) der Region Nord dicht auf       greater metro regions, lost nearly 50% (Munich)                                                                                                                                          45,3                    953,3                  165,7
                                                                                                                                                                                                                                                                                                                                               90,3
                                                                                                                                                                                                                                                                               51,9                                                            63,0
                               den Fersen. Im Vergleich zum 5-jährigen Mittel         and nearly 33% (Hamburg) in investment volume                                          2.000                                                                                                                                            167,3
                               konnten deutliche Zuwächse von rund 25 % bzw.          over prior period, but still follow closely behind the                                                                            1.234,8                    1.274,1                   269,8
                                                                                                                                                                                                                                                                                                          25,8                320,1
                                                                                                                                                                                                                                                                                                                                              120,9
                                                                                                                                                                                                                                                                             199,8                                                             58,1
                               52 % erzielt werden. Neben der Region Nord kann        Northern Region at over 14% (153.4 million euros)                                                                                                                                                                   12,4                 228,7
                                                                                                                                                                                                                                    1.084,7                                  183,3
                                                                                                                                                                                                                                                                                                                 795,7                        112,0
                               auch die Region West im Vergleich zum vorherigen       and 15% (162.7 million euros), respectively. Com-                                                                                    54,0                        50,3                                               31,1                381,3
                                                                                                                                                                                                                                                                               61,6                                                            56,4
                                                                                                                                                                                                                           28,1                      124,7                                              118,0
                               Halbjahr substanziell zulegen. Mit einem Zuwachs       pared to the five-year mean, the cities scored seri-                                                                                                                                   109,5                                                            162,7
                                                                                                                                                                                                                          145,9             47,7       17,6                                               39,9     110,9
                               von rund 275 % stieg das Investmentvolumen im          ous increases of around 25% and 52%, respec-                                                                                                                             804,9           54,3                                                           153,4
                                                                                                                                                                                                                          112,4             19,8     192,2                                              244,2       41,6
                               Vergleich zum zweiten Halbjahr 2018 auf nunmehr        tively. Aside from the Northern Region, the                                                                                                                                              33,6                                                            64,5
                                                                                                                                                                                                                          215,3             26,2     143,7                                              173,3       88,1
                               63 Mio. Euro an. Die Region Süd kann als letzte        Western Region also made substantial gains since                                                                                                               245,9                                                25,2    128,9
                                                                                                                                                                                                                          134,3             66,6                  27,0
                               Region einen marginalen Zuwachs von gut 6 %            the previous half-year. A growth by around 275%                                                                         694,2                                    67,4       16,6                                  181,2       28,0
                                                                                                                                                                                                                          178,8            105,4
                               verzeichnen (120,9 Mio. Euro). Die Region Ost legt     since the second half of 2018 pushed the invest-                                                                                     56,2            145,4       19,4       89,2                                  102,2     102,2
                                                                                                                                                                             1.500
                               zwar nicht zu, der Verlust ist mit -2,4 % jedoch       ment volume up to 63 million euros by mid-year.                                                                                      58,7             77,4     224,4      104,7                                             114,0
                                                                                                                                                                                                                 13,0
                               marginal.                                              The Southern Region, the one with the slowest                                                                                       251,0                      188,7        93,4                                              34,7

                                                                                                                                               Mio. Euro | million euros
                                                                                                                                                                                                                 80,1                      499,1
                                                                                      growth, registered a marginal gain by just over 6%                                             685,2                       71,5                       45,2                  93,6                                            147,4
                                                                                      (120.9 million euros). The Eastern Region, while                                                          656,6            94,6                       51,9                  37,1
                               Top-Region Berlin und Umland                           suffering a loss, reported a negative growth just as                                            28,4                       60,9                                             75,6

                               verliert massiv im Vergleich zum                       marginal at -2.4%.                                                                              10,1         63,2          68,8                                              9,0
                                                                                                                                                                                     165,5         37,5                                                         258,7
                               zweiten Halbjahr 2018                                                                                                                                  34,0         93,0
                                                                                                                                                                                                                 96,9
                                                                                                                                                                                                                 59,7
                               Der größte Verlierer im ersten Halbjahr 2019 ist die   _Top Region of Berlin and Greater Area                                                          67,1         44,8          51,5
                                                                                                                                                                                     128,5         91,6
                               Region Berlin samt Umland. Die zuvor stark             Suffers Massive Loss since Second Half of                                              1.000    20,2         64,0
                                                                                                                                                                                                                 97,3

                               gesuchte Region hat beim Investmentvolumen gut         2018                                                                                            64,5         15,3
                               83 % zur Vorperiode nachgegeben. Mit 64 Mio.                                                                                                           83,4         89,1
                               Euro bzw. knapp 6 % des Umsatzvolumens spielt          The region with the heaviest losses during the first                                            83,7         68,7
                               Berlin diesmal kaum eine Rolle. Ganz ähnlich ergeht    half-year of 2019 was Berlin and Greater Area. The                                                           89,5
                               es dem Verdichtungsraum Rhein-Main-Neckar.             previously strongly coveted region saw its invest-
                               Diese Region belegt nur einen Anteil von gut 5 %       ment volume drop by over 83% over prior period.
                               des gesamten Investmentvolumens (58,1 Mio.             With barely 6% of the turnover total or 64 million
                               Euro). Gegenüber dem zweiten Halbjahr 2018 hat         euros, Berlin played a negligible role this time. The
                               diese Region einen Rückgang von knapp 80 %             Rhine-Main-Neckar conurbation presents a similar
                               erfahren. Im Vergleich zum 5-jährigen Schnitt          picture. This region claims a share of just over 5%                                      500
                               beträgt der Rückgang immerhin noch rund 60 %.          of the investment total only (58.1 million euros).
                                                                                      Compared to the second half-year of 2018, this
                                                                                      region experienced a set-back by almost 80%. The
                                                                                      drop still amounts to around 60% when compared
                                                                                      to the five-year average.

                                                                                                                                                                                 0

                                                                                                                                                                                      H1 2013   H2 2013       H1 2014   H2 2014      H1 2015       H2 2015     H1 2016    H2 2016         H1 2017      H2 2017    H1 2018       H2 2018       H1 2019

20   Der Investmentmarkt | The Investment Market                                                                                                                                                                                                                                                      1. Halbjahr 2019 | H1 2019                 21
Abb. 07: Regionale Verteilung der Investments nach Objektkategorie, 1. Halbjahr 2019                                                           Abb. 08: Regionale Verteilung der Flächenumsätze nach Objektkategorie, 1. Halbjahr 2019
Fig. 07: Regional distribution of investments by property category, H1 2019                                                                    Fig. 08: Regional distribution of take-ups by property type, H1 2019

Objektkategorie
Property category
     Transformationsimmobilien
     Converted properties

     Gewerbeparks
     Business parks

     Lager-/Logistikimmobilien
     Warehouse/logistics properties

     Produktionsimmobilien
     Light manufacturing properties

                                                                        Hamburg und Umland                                                                                                                    Hamburg und Umland
Teilraum                                                              Hamburg and greater area                                                                                                              Hamburg and greater area
Sub-area                                                                                                                                                                                                            18.500

     Region Nord
     Northern region

     Region Ost
     Eastern region                                                                                                    Berlin und Umland                                                                                                                     Berlin und Umland
                                                                                                                     Berlin and greater area                                                                                                               Berlin and greater area
     Region West                                                                                                                                                                                                                                                    72.500
     Western region

     Region Süd
     Southern region                                                                                                                                                                                                 Region Nord
                                                                                                                                                                                                                    Northern region
     Verdichtungsräume                                                                                                                                                                                                   12.500
     Conurbations                                                                                                                                                                                  Region West
                                                                                                                                                                                                  Western region
                                                                                                                                                                                                      10.500
                                                                                                                                                                                                                                           Region Ost
                                Verdichtungsraum Rhein-Ruhr                                                                                                            Verdichtungsraum Rhein-Ruhr                                       Eastern region
                                  Conurbation Rhine-Ruhr                                                                                                                 Conurbation Rhine-Ruhr                                              59.500
                                                                                                                                                                                  61.000

                                             Verdichtungsraum Rhein-Main-Neckar                                                                                                       Verdichtungsraum Rhein-Main-Neckar
                                               Conurbation Rhine-Main-Neckar                                                                                                            Conurbation Rhine-Main-Neckar
                                                                                                                                                                                                     43.000

                                                                                                                                                                                                                                          Region Süd
                                                                                                                                                                                                                                        Southern region
                                                                                                                                                                                                                                            37.500

                                                                                                  München und Umland                                                                                                                    München und Umland
                                                                                                 Munich and greater area                                                                                                               Munich and greater area
                                                                                                                                                                                                   Stuttgart und Umland                        19.000
                                                             Stuttgart und Umland                                                                                                                Stuttgart and greater area
                                                           Stuttgart and greater area                                                                                                                      23.000

© 2019 bulwiengesa AG, Kartengrundlagen: © elevenfifteen                                                                                       © 2019 bulwiengesa AG, Kartengrundlagen: © elevenfifteen

22             Der Investmentmarkt | The Investment Market                                                                                                                                                                                                                1. Halbjahr 2019 | H1 2019   23
Außenansicht einer Produktionsimmobilie in Wolfratshausen
Exterior view of a light manufacturing property in Wolfratshausen

                                                                    Quelle/Source: Deutsche Industrie REIT-AG, Fotograf/Photographer: Marcus Mueller-Witte
Der Vermietungsmarkt                                                                                                                                                     Mangel an verfügbaren Flächen
                                                                                                                                                                         prägt nach wie vor den Vermie­

                                      The Letting Market
                                                                                                                                                                         tungsmarkt
                                                                                                                                                                         Die immer geringere Verfügbarkeit von Flächen in                            _Shortage in Available Accommodation
                                                                                                                                                                         Unternehmensimmobilien schlägt im ersten Halb-                              Continues to Define Letting Market
                                                                                                                                                                         jahr 2019 voll durch. Der Flächenumsatz ist im
                                                                                                                                                                         Vergleich zum vorherigen Halbjahr um über 30 %                              The decreasing availability of accommodation in
                                                         für Unternehmensimmobilien im 1. Halbjahr 2019*                                                                 eingebrochen – im Vergleich zum Durchschnitt des                            Unternehmensimmobilien assets became perfectly
                                                                                                                                                                         vergangenen 5-Jahreszeitraums sogar um gut                                  visible during the first half of 2019. The take-up
                                                         for Unternehmensimmobilien in H1 2019*                                                                          50 %. In Zeiten drohender Konjunktureintrübung                              has dropped by more than 30% since the previous
                                                                                                                                                                         setzen Immobilienunternehmen wieder stärker auf                             half-year – and by over 50% compared to the
                                                                                                                                                                         Sicherheit. Dazu gehört, dass bei Neuanmietungen                            average of the past five-year period. Faced with an
                                                                                                                                                                         Mietverträge mit längeren Laufzeiten abgeschlos-                            economic slowdown, real estate companies have
                                                                                                                                                                         sen und zügig Anschlussmietverträge angestrebt                              shifted their focus back toward safety. In the case
                                                                                                                                                                         werden. Die Flexibilität des Vermieters tritt wieder                        of new rentals, this means that lease agreements
                                                                                                                                                                         etwas in den Hintergrund.                                                   are signed for longer terms and that subsequent
                                                                                                                                                                                                                                                     leases are negotiated as quickly as possible. Con-
                                                                                                                                                                                                                                                     versely, the landlord’s flexibility has lost in
                                                                                                                                                                        *Der Vermietungsmarkt spiegelt nur die Aktivitäten der in der
                                                                                                                                                                          INITIATIVE UNTERNEHMENSIMMOBILIEN eingebundenen                            significance.
                                                                                                                                                                          Unternehmen wider. Die Aussagen sind nicht vollumfänglich
                                                                                                                                                                          auf den Gesamtmarkt übertragbar.

                                                                                                                                                                                                                                                    *The occupier market reflects only the activities of companies
                                                                                                                                                                                                                                                      associated with the INITIATIVE UNTERNEHMENSIMMOBILIEN. The
   Abb. 09: Flächenumsätze nach Region                                                                                                                                                                                                                statements are therefore not fully applicable to the overall market.

   Fig. 09: Take-ups by region

                                                                                                    658,5        679,5

                                               581,5                                                               74,0                                    593,0
                                                                                                     24,0                     554,0
                           527,0                                                                     21,5
                                                                                                                   10,0                                                                             499,5
                                                 11,0                                                                                                        45,5
                                                                                      480,0          66,0
                                                                                                                   36,0         20,5                                     466,5
                            37,5                  3,5                 440,0                                       109,0         28,0
                                                                                                                                                             13,0                                       44,0                      357,0
                                                                                                     42,5
                            17,0                 37,5                                  60,0         122,5
                                                                                                                   72,0         53,0        388,0            36,0           17,0                        27,5
                            32,5                 16,5                      46,5         3,5                        81,0                                      56,0           12,0                                                         12,5
                                                                                                                                                                                                        17,0
                                                                                                    113,5                       72,0                                                                                                                           246,0
                           105,0                 37,0                      11,0                                    24,0                       50,5           65,5                                                                                                                     Flächenumsatz aller Regionen
                                                                                       13,0         137,0                       48,5                                          1,0                       42,5                             59,5
                                                                                                                                                                                                                                                                                      Take-ups of all regions
                     800    73,0                175,0                      16,5                                    61,5                       16,0          146,0
                                                                                       61,5          24,5                       98,5                                        40,5                        51,5                             10,5                      31,5
                           116,0                128,0                      45,5                                    49,0                        5,0           15,5                                                                                                                     Region Nord
                                                                                       90,5          38,5                       29,0                                        96,5                        67,0                             37,5                      11,0               Northern region
                             3,5                 30,0                      33,5                                   163,0                       44,5           45,5
                                                                                       48,5          68,5                       49,5                                        67,5                        29,0                             43,0                       4,5
                            15,5                 66,0                      61,0                                                               37,5           63,5                                                                                                                     Region Ost
Tsd. m2 | ‘000 sqm

                                                                                       47,5                                     58,5                                          2,5                       42,0                             61,0                      29,5               Eastern region
                            19,0                 77,0                     121,0                                                               69,5          106,5
                                                                                       26,5                                     96,5                                        51,0                        98,0                             23,0                      39,5
                     600                                                                                                                      15,5                                                                                                                                    Region West
                           108,0                                           22,5         6,0                                                                                 75,0                        81,0                             19,0                      38,5               Western region
                                                                           11,0                                                               20,5
                                                                                      123,0                                                                                103,5                                                         18,5                       2,5               Region Süd
                                                                           71,5                                                               25,0
                                                                                                                                                                                                                                         72,5                      27,0               Southern region
                                                                                                                                             104,0
                                                                                                                                                                                                                                                                   25,0               Verdichtungsraum Rhein-Main-Neckar
                     400                                                                                                                                                                                                                                                              Conurbation Rhine-Main-Neckar
                                                                                                                                                                                                                                                                   37,0

                                                                                                                                                                                                                                                                                      Verdichtungraum Rhein-Ruhr
                                                                                                                                                                                                                                                                                      Conurbation Rhine-Ruhr

                                                                                                                                                                                                                                                                                      Stuttgart und Umland
                                                                                                                                                                                                                                                                                      Stuttgart and greater area

                     200
                                                                                                                                                                                                                                                                                      München und Umland
                                                                                                                                                                                                                                                                                      Munich and greater area

                                                                                                                                                                                                                                                                                      Hamburg und Umland
                                                                                                                                                                                                                                                                                      Hamburg and greater area

                                                                                                                                                                                                                                                                                      Berlin und Umland
                       0                                                                                                                                                                                                                                                              Berlin and greater area
                            H1 2013                H2 2013                  H1 2014       H2 2014      H1 2015      H2 2015       H1 2016        H2 2016      H1 2017        H2 2017                      H1 2018                         H2 2018               H1 2019

   26                         Der Vermietungsmarkt | The Letting Market                                                                                                                                                                                                    1. Halbjahr 2019 | H1 2019                        27
Eher gleichbleibend fielen die Flächenumsätze
                                                                                                                                                                                                                                                                                      neben Berlin und Umland mit 16 % am gesamten

                                                                                                                                                       Quelle/Source: Investa Asset Management, Fotograf/Photographer: Andreas Vallbracht
                                                                                                                                                                                                                                                                                      aktuellen Umsatz die beiden Verdichtungsräume
                                                                                                                                                                                                                                                                                      entlang des Rheins aus (Rhein-Main-Neckar und                     Aside from Berlin and Greater Area, which
                                                                                                                                                                                                                                                                                      Rhein-Ruhr): Sie vereinen ebenfalls rund 16 % des                 accounted for 16% of the recent turnover total,
                                                                                                                                                                                                                                                                                      aktuellen Umsatzes auf sich. Ungeachtet dessen                    take-up volumes remained more or less unchanged
                                                                                                                                                                                                                                                                                      verzeichnen auch diese Regionen Einbußen beim                     in the two conurbations along the Rhine (Rhine-
                                                                                                                                                                                                                                                                                      Flächenumsatz im Vergleich zum vorherigen Zeit-                   Main-Neckar and Rhine-Ruhr): These claimed
                                                                                                                                                                                                                                                                                      raum. Im Falle von Rhein-Main-Neckar sind diese                   roughly another 16% of the recent take-up. That
                                                                                                                                                                                                                                                                                      mit rund 8 % noch relativ moderat. Im Falle von                   being said, these regions also experienced set-
                                                                                                                                                                                                                                                                                      Rhein-Ruhr (-40,6 %) oder Berlin (-49,0 %) fallen                 backs in terms of take-up since the previous
                                                                                                                                                                                                                                                                                      sie schon deutlicher aus.                                         period. In the case of the Rhine-Main-Neckar
                                                                                                                                                                                                                                                                                                                                                        Region, they were relatively moderate at around
                                                                                                                                                                                                                                                                                      Im Vergleich zum zweiten Halbjahr 2018 konnten                    8%. Far more serious were the dips in Rhine-Ruhr
                                                                                                                                                                                                                                                                                      lediglich München (+42,1 %) wie auch Hamburg                      (-40.6%) and Berlin (-49.0%).
                                                                                                                                                                                                                                                                                      samt Umland (+35,1 %) und die Region Nord
                                                                                                                                                                                                                                                                                      (+152,0 %) eine Steigerung erfahren.                              The only regions to register increases since the sec-
                                                                                                                                                                                                                                                                                                                                                        ond half of 2018 were Munich (+42.1%), Ham-
                                                                                                                                                                                                                                                                                                                                                        burg and Greater Area (+35.1%) and the Northern
                                                                                                                                                                                                                                                                                      Mittelgroße Flächen erfreuen sich                                 Region (+152.0%).
                                                                                                                                                                                                                                                                                      höherer Beliebtheit
Luftbild / Aerial view „The Plant“, Konstanz
                                                                                                                                                                                                                                                                                      Das erste Halbjahr 2019 ist geprägt von einer stei-               _Surge in Popularity of Midsize Units
                                                                                                                                                                                                                                                                                      genden Bedeutung mittelgroßer Flächen zwischen
                                                                                                                                                                                                                                                                                      1.000 und 2.500 m². Mit einem Anteil von 12,5 %                   The first half-year of 2019 was characterised by
                                                                                                                                                                                                                                                                                      erfahren sie eine um 15 % stärkere Nachfrage als                  the growing importance of midsize units ranging
                                                                                                                                                                                                                                                                                      im zweiten Halbjahr 2018. Mit einem Gesamtanteil                  from 1,000 to 2,500 sqm. Claiming a market share
                                               Konjunkturelle Risiken erreichen                                                                                                                                                                                                       von knapp 32 % ist es die mit Abstand meistge-                    of 12.5%, demand for them increased by 15%
                                               den Vermietungsmarkt bislang noch                                                                                                                                                                                                      handelte Flächenklasse. Auch die zweitstärkste                    since the second half of 2018. As it accounts for
                                               nicht                                                                                                                                                                                                                                  Größenklasse bis rund 5.000 m2 (21,8 %) konnte                    an absolute share of nearly 32%, it is by far the
                                                                                                                                                                                                                                                                                                                                                        fastest-trading unit size category. Similarly, the sec-
                                               Der aktuelle Rückgang des Flächenumsatzes setzt                                                                                                                                                                                                                                                          ond-most prominent size category, the one for
                                               den Trend der vergangenen Halbjahre fort. Dieser                                                                                                                                                                                                                                                         units up to around 5,000 sqm (21.8%), recorded a
                                               Rückgang lässt sich nach wie vor maßgeblich
                                               durch die immer begrenzter zur Verfügung ste-
                                               henden Flächen erklären. Konjunkturelle Risiken
                                               sind hierbei nicht als Ursache anzuführen. Es ver-    _Economic Risks Have so far Failed to                                                                                                  Abb. 10: Umsatzleistung nach Flächengrößenklassen
                                                                                                                                                                                                                                            Fig. 10: Take-ups by area size category
                                               dichten sich dennoch immer mehr die Anzeichen         Impact the Letting Market
                                               eines konjunkturellen Wendepunkts. Inwieweit
                                               dies den Vermietungsmarkt maßgeblich beeinflus-       The current decline in take-up continues the trend
                                               sen kann, bleibt indes noch offen. Vielmehr ist der   of previous half-years. Now, as then, the downturn
                                               Flächenengpass als Ursache für resultierende nied-    is definitively explained by the steadily shrinking                                                                                    100 %                                                                                              2,6           3,7                             Umsatz größer
                                                                                                                                                                                                                                                                                                                                      5,9                                                    10.000 m²
                                               rige Flächenumsätze zu sehen.                         supply of available accommodation. Economic                                                                                                                                                                11,0      10,8                                                   9,9
                                                                                                                                                                                                                                                                                                                                                                                             Lettings of more than
                                                                                                                                                                                                                                                                                                                                              11,1                   20,1
                                                                                                     risks do not qualify as underlying causes. That                                                                                         90 %   21,5                          23,5
                                                                                                                                                                                                                                                                                                                                                            11,5                             10,000 sqm
                                                                                                                                                                                                                                                                                                      24,2
                                                                                                     being said, there is mounting evidence for an                                                                                                                       36,1               32,2                          10,1
                                                                                                                                                                                                                                                                                                                                     17,2
                                                                                                                                                                                                                                                                                                                                                                                 7,8         7.500 bis 10.000 m²
                                                                                                                                                                                                                                                                                                                10,6
                                               Berlin sowie die Regionen entlang                     imminent economic trend reversal. It remains to be
                                                                                                                                                                                                                                             80 %                                                                                             12,8          10,9
                                                                                                                                                                                                                                                                                                                                                                      2,8                    7,500 to 10,000 sqm

                                               der Rhein-Schiene sind stabil                         seen, though, to what extent this will have a defin-                                                                                                     50,2                                                         5,6
                                                                                                                                                                                                                                                                                                                                                                               12,6          5.000 bis 7.499 m²
                                                                                                     itive influence on the letting market. Rather, the                                                                                                                                                                                                              14,3
                                               aufgestellt                                                                                                                                                                                   70 %
                                                                                                                                                                                                                                                                                   7,2
                                                                                                                                                                                                                                                                                                      11,2
                                                                                                                                                                                                                                                                                                                11,5                 11,1                                                    5,000 to 7,499 sqm
                                                                                                     shortage of accommodation should be seen as                                                                                                    13,0
                                                                                                                                                                                                                                                                          1,8                                                                               18,5                             2.500 bis 4.999 m²
                                               Besonders gravierend ist der Rückgang der Miet-       cause for the slow take-up.                                                                                                                                                  10,8      10,8                          19,7                17,5
                                                                                                                                                                                                                                                                                                                                                                                             2,500 to 4,999 sqm
                                                                                                                                                                                                                                             60 %                                                      9,0
                                               abschlüsse rund um Stuttgart oder auch in der                                                                                                                                                                              9,2                                                        16,5                            14,3      21,8
                                                                                                                                                                                                                                                    11,5                                                        20,0
                                               Region West und Ost. Der Flächenumsatz ist hier                                                                                                                                                                                               5,4                                                                                             1.000 bis 2.499 m²
                                                                                                                                                                                                                                                                                                                                                                                             1,000 to 2,499 sqm
                                               im Vergleich zum vorherigen Halbjahr um knapp         _Regions where the Situation is Stable                                                                                                  50 %              4,4
                                                                                                                                                                                                                                                                                  16,7
                                                                                                                                                                                                                                                                                                      17,1                                    19,1
                                               60 % (Region West), 80 % (Region Ost) bzw.            Include Berlin and the Regions along the                                                                                                       11,4       3,1       12,6               14,0
                                                                                                                                                                                                                                                                                                                          23,0
                                                                                                                                                                                                                                                                                                                                                            17,6                             101 bis 999 m²
                                                                                                                                                                                                                                                                                                                                                                                             101 to 999 sqm
                                               90 % (Stuttgart und Umland) zurückgegangen.           Rhine                                                                                                                                   40 %
                                                                                                                                                                                                                                                                                                                                     16,4                            19,3
                                                                                                                                                                                                                                                              10,6
                                                                                                                                                                                                                                                                                                                18,4                                                           31,8          Bis 100 m²
                                                                                                                                                                                                                                                                         12,5     14,6
                                                                                                     Particularly dramatic is the decline in lease signings                                                                                  30 %
                                                                                                                                                                                                                                                    15,3                                    14,1      13,8
                                                                                                                                                                                                                                                                                                                                                                                             Up to 100 sqm

                                                                                                     around Stuttgart and in the Western and Eastern
                                                                                                                                                                                                                                                              15,5
                                                                                                     regions. Here, the take-up has declined by nearly                                                                                                                                                                                        31,2
                                                                                                                                                                                                                                                                                                                                                            31,1
                                                                                                                                                                                                                                             20 %
                                                                                                     60% (Western Region), 80% (Eastern Region) and                                                                                                                      22,2     22,6                          24,1      23,7       26,7
                                                                                                                                                                                                                                                                                                                                                                     24,8
                                                                                                     90% (Stuttgart and Greater Area).                                                                                                              23,0                                              20,9
                                                                                                                                                                                                                                                                                            19,5
                                                                                                                                                                                                                                             10 %             12,9                                                                                                             15,2

                                                                                                                                                                                                                                                                                                                           7,2        6,3      5,8           6,6
                                                                                                                                                                                                                                                      4,3      3,2        5,7      4,6       3,9       3,8        4,5                                                 4,3
                                                                                                                                                                                                                                              0%                                                                                                                                 0,8
                                                                                                                                                                                                                                                    H1 2013   H2 2013   H1 2014   H2 2014   H1 2015   H2 2015   H1 2016   H2 2016   H1 2017   H2 2017      H1 2018   H2 2018   H1 2019

28              Der Vermietungsmarkt | The Letting Market                                                                                                                                                                                                                                                                                                               1. Halbjahr 2019 | H1 2019            29
sehr stark nachgefragt. Sie stellt aktuell den größ-
                                                                                                                                                                                              ten Nachfrageanteil und ist im Vergleich zum vor-
                                                                                                                                                                                              herigen Halbjahr um knapp 15 % gestiegen. Diese
                                                                                                                                                                                              Kategorie kann auch im Vergleich zum Durch-
                                                                                                                                                                                              schnitt der vergangenen fünf Jahre ein Plus von
                                                                                                                                                                                              knapp 9 % aufweisen.

                                                                                                                                                                                              Mietverträge mit einer Laufzeit von mehr als zehn                fact, they currently represent the largest demand
                                                                                                                                                                                              Jahren nahmen um 8 % im Vergleich zum vorheri-                   share after increasing it by nearly 15% since the
                                                                                                                                                                                              gen Halbjahr zu. Mit rund 13 % Anteil am gesam-                  previous half-year. Compared to the average of the
                                                                                                                                                                                              ten Vermietungsmarkt schlägt sich hier das Bestre-               past five years, this category gained nearly 9%.
                                                                                                                                                                                              ben nach Planungssicherheit auf Nutzerseite ganz
                                                                                                                                                                                              besonders nieder.                                                The number of leases with terms longer than ten
                                                                                                                                                                                                                                                               years increased by 8% since the previous half-year.
                                                                                                                                                                                              Den größten Nachfragerückgang verzeichneten                      With a share of around 13% of the total occupier
                                                                                                                                                                                              Mietverträge mit einer Laufzeit von weniger als                  market, it visibly reflects a need for planning cer-
                                                                                                                                                                                              einem Jahr. Mit gut 21 % fällt dieser sogar sehr                 tainty on the occupier side.
                                                                                                                                                                                              deutlich aus und liegt wieder nahezu auf dem
                                                                                                                                                                                              Niveau des Durchschnitts der vergangenen 5                       Leases over terms of less than one year registered
                                                                                                                                                                                              Jahre. Die weiteren Kategorien bleiben in etwa                   the steepest drop in demand. Indeed, after having
                                                                                                                                                                                              konstant und fluktuieren lediglich etwas im Ver-                 declined by over 21%, their share has now
                                                                                                                                                                                              gleich untereinander sowie im Vergleich zum                      returned more or less to the average level of the
                                                                                                                                                                                              Schnitt der letzten 5 Jahre.                                     past five years. The other categories remained
                                                                                                                                                                                                                                                               largely stable, only fluctuating slightly among
                                                                                                                                                                                                                                                               themselves and relative to the average of the last
                                                                                                                                                                                                                                                               five years.

                                                                                       growth of 7.5%. Compared to their five-year aver-       Abb. 11: Flächengewichtete Laufzeit der Mietverträge
                                                                                       ages, demand for these segments has visibly gone        Fig. 11: Lease term weighted by take-ups
                                                                                       up. These medium size bands are particularly inter-
                               ein Wachstum von 7,5 % verzeichnen. Im Ver-             esting because they permit a viable compromise
                               gleich zum 5-Jahres-Schnitt sind diese beiden Seg-      between the availability of floor space and flexibil-
                               mente in der Nachfrage deutlich gestiegen. Für          ity. Conversely, demand for very small and very
                                                                                                                                                                                                                                                                                                  10 Jahre und länger
                               viele Mieter sind diese mittleren Größenklassen         large units has slackened. Particularly conspicuous     100 %                                                                                          5,7       8,0                    4,7                10 years and longer
                               besonders interessant, da sie einen guten Kompro-       is the decline in demand for units of 100 sqm or                  7,3                                                  12,2        9,2                                                           12,7
                                                                                                                                                                                                                                  19,1                             18,9                           5 bis kürzer als 10 Jahre
                               miss zwischen Flächenverfügbarkeit und Flexibilität     less (-3.5%) and even more so for units of 101 to                                                                                                                                                          5 to shorter than 10 years
                                                                                                                                                                                                   21,3
                               ermöglichen. Sehr kleine und sehr große Flächen         999 sqm (-9.6%). Then again, the latter segment         90 %
                                                                                                                                                                            28,3                                                                                              16,0
                               werden dagegen seltener nachgefragt. Besonders          still accounts for over 15% of all units absorbed by                      29,6                  31,3                                                           18,9
                                                                                                                                                                                                                                                                                                  3 bis kürzer als 5 Jahre
                                                                                                                                                                                                                                             24,0                                                 3 to shorter than 5 years
                               sichtbar ist der Rückgang bei den Flächen bis           the market. An outlier recorded during the second
                                                                                                                                               80 %
                               100 m2 (-3,5 %) bzw. noch stärker bei 101 bis           half of 2018 was the take-up in units of more than                                                                     24,2
                                                                                                                                                                                                                                                                   13,2                 30,7      2 bis kürzer als 3 Jahre
                                                                                                                                                                                                                                                                                                  2 to shorter than 3 years
                               999 m2 (-9,6 %). Letzteres Segment stellt aber          10,000 sqm as it amounted to over 20%. Current                                                                                   35,5
                               immerhin noch einen Anteil von gut 15 % aller           demand in this segment is down to around 5%,                                                                                               24,1
                                                                                                                                               70 %                                                                                                                           17,4                1 bis kürzer als 2 Jahre
                               umgesetzten Flächen. Beim Umsatz von Flächen            which more or less matches the level of past years               43,3                                       25,1                                                                                           1 to shorter than 2 years
                                                                                                                                                                            12,6
                               mit einer Größe von mehr als 10.000 m2 stellte das      (about 5% to 10%).                                                        17,8                                                                        20,0                                                 Kürzer als 1 Jahr
                                                                                                                                                                                                                                                      27,4
                               zweite Halbjahr 2018 mit einem Anteil von gut                                                                   60 %                                    24,3                                                                                                       Shorter than 1 year
                               20 % einen Ausreißer dar. Aktuell bewegt sich die                                                                                                                                                                                   33,4                 16,9
                                                                                       _Planning Certainty More Important
                                                                                                                                                                                                                                                                                                  Rollierend
                               Nachfrage in diesem Segment mit rund 5 % in                                                                                                                                                                                                    12,4
                                                                                                                                                                                                                                                                                                  Rolling
                                                                                                                                               50 %                         16,8                              27,6      12,6      14,5
                               etwa auf dem Niveau der vergangenen Jahre (ca.          than Maximum Flexibility                                                                                    12,7                                                                        3,7
                               5 % bis 10 %).                                                                                                                    15,6
                                                                                                                                                                                                                                    2,7      16,6
                                                                                       As limited availability of floor space coincides with   40 %     23,1                            9,5                               6,4                         13,0                              11,6
                                                                                       rising economic risks, tenants of Unternehmensim-                                    10,9                     9,8                            8,2
                               Planerische Sicherheit wichtiger als                    mobilien prioritise planning certainty. Favoured                                                                        9,9                                                   7,5
                                                                                                                                                                                        8,5
                               maximale Flexibilität                                   over maximum flexibility, lease term categories of      30 %
                                                                                                                                                                 19,0
                                                                                                                                                                                                                                              7,2
                                                                                                                                                                                                                                                      11,5
                                                                                                                                                                                                                                                                                         5,8
                                                                                       five to ten years are subject to very strong demand                                                                              19,3
                                                                                                                                                                            12,4                                                                                     6,6      35,6
                                                                                                                                                         8,5                                       12,6
                               In Zeiten begrenzter Flächenverfügbarkeit bei           and account for a share of 31% of the total. In
                                                                                                                                               20 %                                                                               20,6
                                                                                                                                                                                       14,7                   15,3
                               gleichzeitig steigenden konjunkturellen Risiken
                                                                                                                                                                                                                                             18,6                                       14,3
                               favorisieren die Mieter von Unternehmensimmobi-                                                                                    9,1        6,0
                                                                                                                                                         7,6                                                                                          13,5         13,3
                                                                                                                                                                                                     9,3
                               lien planerische Sicherheit. Statt einer maximalen                                                              10 %
                                                                                                                                                                                                                        11,1
                                                                                                                                                                                        3,8
                               Flexibilität sind die Laufzeitkategorien von fünf bis                                                                                                                           6,9
                                                                                                                                                         6,9      4,6
                                                                                                                                                                            13,0                                                  10,8
                               zehn Jahren mit einem Anteil von knapp 31 %                                                                                                              7,8          9,3
                                                                                                                                                                                                                          5,8                 7,9       7,7          7,2
                                                                                                                                                                                                                                                                              10,2       7,9
                                                                                                                                                         3,3      4,3                                          3,8
                                                                                                                                                0%
                                                                                                                                                       H1 2013    H2 2013    H1 2014   H2 2014     H1 2015   H2 2015   H1 2016   H2 2016   H1 2017   H2 2017      H1 2018   H2 2018   H1 2019

30   Der Vermietungsmarkt | The Letting Market                                                                                                                                                                                                                                 1. Halbjahr 2019 | H1 2019               31
Abb. 12: Flächenumsätze nach Objektkategorie
     Fig. 12: Take-ups by property type

                     1.400                                                                                                                   1.338,0

                     1.200
                                            1.108,5
                                                                                                                                                                                                                                       1.059,5

                     1.000                                                                                                                                                              942,0
                                                                                            920,0
                                                                                                                                                                                                                                                                                               856,5
Tsd. m2 | ’000 sqm

                      800

                                                                                                                                            65,5
                      600
                                                                                                                                                                    184,0                                                             24,5
                                                                                                                                                                                      63,0
                                           22,5                     162,5
                                                                                                                                            229,5                                                                                     183,5                                                  21,5
                                                                                                                   27,0
                                                                                                                                                                                                                                                             32,5
                                                                                          12,5                                                                      141,5
                                           193,0                                                                                                                                                                                                                                             127 ,5
                      400                                                                                                                                                             173,5
                                                                    67,5                  99,5                     147,5
                                                                                                                                                                                                                 54,5                                        163,5                                                            15,5
                                                                                                                                                                                                                 70,5                                                                                                         99,0
                                                                                                                                                                    180,5
                                                                    185,0                                                                                                                                                             250,5                                                  210,5
                                           148,0                                                                                            234,0                                                                                                                                                                                                      25,0
                                                                                          216,0                    177,0                                                              189,0
                      200
                                                                                                                                                                                                                 153,5                                       183,0                                                                                     106,5
                                                                                                                                                                                                                                                                                                                              196,0

                                           163,5                    166,5                                                                                           173,5                                                                                                                                                                              93,5
                                                                                          112,0                    128,5                    129,5                                     128,5                                           134,5                                                  140,0
                                                                                                                                                                                                                 109,5                                       87,5
                                                                                                                                                                                                                                                                                                                              46,5                     21,0
                        0

                                 H1 2013                  H2 2013               H1 2014                H2 2014                    H1 2015                 H2 2015           H1 2016                    H2 2016              H1 2017                H2 2017                         H1 2018                       H2 2018                     H1 2019

                                                                                                                                                                                                Transformationsimmobilien    Gewerbeparks         Lager-/Logistikimmobilien                  Produktionsimmobilien                    Alle Flächen (Gesamtjahr)
                                                                                                                                                                                                Converted properties         Business parks       Warehouse/logistics properties             Light manufacturing properties           Total space (full year)
                                                       Kaum verfügbare Flächen in
                                                       Multi-Tenant-Objekten

                                                       Die erwähnte Flächenknappheit ist insbesondere
                                                       in den Multi-Tenant-Objekten, also vor allem in                                                                                                                       nicht entspannen. Obwohl Transformations­
                                                       Gewerbeparks und Transformationsimmobilien,                                                                                                                           immobilien nur einen kleinen Teil des Flächenan-
                                                       feststellbar. Dies hängt mit der in den vergange-                                                                                                                     gebots ausmachen, bieten sie durch ihre urbane
                                                       nen Jahren stark gestiegenen Nachfrage im Büro-                                                                                                                       Lage Qualitäten, die kaum replizierbar sind. Der
                                                       segment zusammen. Flächen in diesen Objektka-             _Few Units Available in Multi-Tenant                                                                        Mangel an Immobilien mit diesen Qualitäten wird
                                                       tegorien werden nicht nur aus den                         Properties                                                                                                  selbst bei einem Abflauen der Konjunktur spürbar                  Although conversion properties make up only a
                                                       industriell-gewerblichen Branchen, sondern auch                                                                                                                       bleiben.                                                          fraction of the floor space supply, the features they
                                                       von Unternehmen mit büroaffinem Hintergrund               The aforementioned scarcity of floor space is par-                                                                                                                            offer due to their urban locations are virtually
                                                       bezogen. Gerade in den Metropolregionen ist der           ticularly conspicuous in multi-tenant properties,                                                           Der größte Teil der Nachfrage entfällt aktuell auf                impossible to replicate. The shortage in real estate
                                                       Engpass daher immer spürbarer und es ist nicht            meaning in business parks and conversion proper-                                                            Lager-/Logistikimmobilien. Mit knapp 44 % des                     with such characteristics will still be keenly felt
                                                       verwunderlich, dass der Rückgang beim Flächen-            ties above all. It has to do with surging demand in                                                         Flächenumsatzes wurde im Vergleich zum vorheri-                   even when the economy has started to slow
                                                       umsatz im Vergleich zum vorherigen Halbjahr in            the office segment in recent years. Units in this                                                           gen Halbjahr eine knapp 8 % höhere Nachfrage                      down.
                                                       beiden Kategorien mit jeweils über 50 % deutlich          asset category are occupied not just by tenants                                                             bedient. Dies korreliert mit dem großen Bedarf an
                                                       ausgeprägt ist. Da die Bautätigkeit bei den beiden        from the industrial-commercial sectors but also by                                                          Objekten dieser Kategorie – auch wenn im Kon-                     The demand side is currently dominated by ware-
                                                       betrachteten Objektkategorien nur gering ausfällt,        companies with an office-related background.                                                                text der Initiative Unternehmensimmobilien eher                   house/logistics properties. It claimed nearly 44% of
                                                       wird sich diese Situation in nächster Zeit auch           Especially in the metro regions, the shortages are                                                          kleine und urbane Objekte gemeint sind.                           the take-up, which implies an almost 8% increase
                                                                                                                 becoming more and more apparent, and it comes                                                                                                                                 in demand compared to the previous half-year.
                                                                                                                 as no surprise that the take-up dipped by more                                                                                                                                This correlates with the keen demand for proper-
                                                                                                                 than 50% in either category since the previous                                                                                                                                ties of this category – even if the context of the
                                                                                                                 half-year. Considering that the building activity is                                                                                                                          Initiative Unternehmensimmobilien limits the logis-
                                                                                                                 sluggish in both of the discussed asset categories,                                                                                                                           tics/warehouse category to smallish urban assets.
                                                                                                                 the situation is unlikely to ease up any time soon.

   32                        Der Vermietungsmarkt | The Letting Market                                                                                                                                                                                                                                            1. Halbjahr 2019 | H1 2019              33
Lager/Logistik und Dienstleistungs­
     branchen dominieren Mieterschaft

     Eine Stärke von Unternehmensimmobilien ist der
     breit gefächerte Mietermix. Doch zeigt sich ein
     Wandel der Nachfrage in den vergangenen fünf
     Jahren. Klassische Mieter aus dem Bereich Ver-
     arbeitendes Gewerbe, Leichtindustrie und dem
     Automotive-Umfeld werden tendenziell von
     Unternehmen aus den Bereichen Logistik und
     Dienstleistungen abgelöst. Auch die Nachfrage-
     gruppe „Sonstige“, die sich aus vielfältigen klei-
     nen Wirtschaftszweigen zusammensetzt, wird
     immer prägnanter. Die klassischen Mieter, die        _Warehouse/Logistics and Service
     einstmals rund 50 % der Mieterschaft gestellt        Industries Dominate the Tenant Base
     haben, summieren sich immer häufiger auf gerin-
     gere Anteile um 20 % bis 25 %. Im Vergleich zum      One forte of Unternehmensimmobilien assets is
     5-jährigen Mittel haben sich die Flächenumsätze      their broad-based tenant mix. It should be added,
     beispielsweise aus dem Segment Verarbeitendes        however, that the nature of demand has shifted
     Gewerbe, Industrie und Produktion um über 11 %       over the past five years. Classic tenants from the
     reduziert. Mieter aus dem Segment Logistik und       area of the manufacturing industry, light industry
     Transport sind hingegen auch außerhalb der           and the automotive field are gradually being
     Objektkategorie Lager-/Logistikimmobilie immer       replaced by companies from the sectors of logistics
     häufiger in Unternehmensimmobilien zu finden.        and services. Similarly, the demand group “Miscel-       Abb. 13: Flächenumsätze nach aggregiertem Wirtschaftszweig
     Dies liegt nicht nur am veränderten Konsumver-       laneous,” which is composed of diverse minor             Fig. 13: Take-ups by aggregated economic sector
     halten der Bevölkerung, sondern auch am Zusam-       industrial sectors, plays an increasingly important
     menwachsen von Produktion und Logistik. Infolge      role. The share of classic tenants, which used to
     des immer knapper werdenden Angebots an              make up around 50% of the tenant base, has                       Andere       Dienstleistungsbranchen             Handel, Kfz-Reparatur und Service             Verarbeitendes Gewerbe, Industrie und Produktion       Logistik, Transport
     Logistikimmobilien und an Grundstücken auf der       often dwindled to much lower shares of 20% to                    Others       Service industries                  Retail, automotive repairs and servicing      Manufacturing and industrial production                Logistics, transport
     grünen Wiese weichen viele Nutzer auf andere         25%. Compared to the five-year mean, take-up in
     Kategorien der Unternehmensimmobilien aus.           the manufacturing and industrial production seg-
                                                          ment dropped by more than 11%, for example.              100 %
                                                          Tenants from the logistics and transport segment                                         22,2                                                           21,0
                                                          increasingly opt for Unternehmensimmobilien              90 %
                                                                                                                                     27,4
                                                                                                                                                                                                  24,1
                                                                                                                                                                                                                                                                     25,7
                                                                                                                                                                   30,6
                                                          premises rather than moving into warehouse/logis-                                                                                                                30,0                                                35,9

                                                          tics properties. This is attributable not just to                                                                       35,9                                                                 35,6
                                                                                                                   80 %     38,6                                                                                                                                                              41,2
                                                                                                                                                                                                                                         39,1
                                                          changes in the consumption patterns of the gen-
                                                          eral public but also to the gradual merging of pro-      70 %
                                                          duction and logistics. The steadily contracting sup-                                     25,5                                           19,6            25,0                                               15,3
                                                                                                                                     17,5                                                                                  12,8
                                                          ply of logistics real estate and green-field plots has
                                                                                                                   60 %
                                                          lately prompted many occupiers to opt for accom-                  11,1                                   19,6                                                                                                        15,2
                                                                                                                                                                                                                                                                                                7,8
                                                          modation in other Unternehmensimmobilien                                                                                20,4                                                   14,6          21,1           8,4
                                                          categories.                                              50 %
                                                                                                                                     13,4                                                                                  19,6                                                  8,6
                                                                                                                                                                                                  18,9            20,2                                                                         10,9
                                                                                                                            14,7                   20,8
                                                                                                                   40 %                                            22,3                                                                  13,0            8,7         19,3
                                                                                                                                                                                  21,5                                                                                         15,3           12,3
                                                                                                                                     18,2
                                                                                                                                                                                                  10,8                     13,5
                                                                                                                   30 %     17,0                                                                                  12,0                                 10,7
                                                                                                                                                                                                                                         11,5
                                                                                                                                                   11,4
                                                                                                                                                                    9,9
                                                                                                                   20 %                                                             6,1

                                                                                                                                                                                                                                                                     31,3      25,0           27,9
                                                                                                                   10 %              23,5                                                         26,7            21,8     24,2          21,8          23,9
                                                                                                                                                   20,1
                                                                                                                            18,7                                   17,6
                                                                                                                                                                                  16,0

                                                                                                                    0%
                                                                                                                           H1 2013   H2 2013      H1 2014         H2 2014        H1 2015         H2 2015        H1 2016   H2 2016       H1 2017       H2 2017      H1 2018    H2 2018        H1 2019

34          Der Vermietungsmarkt | The Letting Market                                                                                                                                                                                                    1. Halbjahr 2019 | H1 2019             35
Sie können auch lesen