B&I Capital EINFÜHRUNG ZU REITS - B&I Capital AG

Die Seite wird erstellt Silvia Scholl
 
WEITER LESEN
B&I Capital EINFÜHRUNG ZU REITS - B&I Capital AG
B&I Capital

 EINFÜHRUNG ZU REITS

                B&I Capital AG
                   +41 44 215 2888
           contact@bnicapital.com
B&I Capital EINFÜHRUNG ZU REITS - B&I Capital AG
Contents
Was ist ein Equity REIT? Der REIT Markt           2 - 10

Bewertungen, Korrelationen, Treiber               11 - 18

Investmentthemen und -prozess                    19 - 23

B&I Global Real Estate Securities Fund (UCITS)   24 - 25

Disclaimer                                           26

B&I Capital
B&I Capital EINFÜHRUNG ZU REITS - B&I Capital AG
Was ist ein Equity REIT?

• Equity REITs sind börsennotierte Investmentvehikel, die in überwiegend eine Immobiliennutzungsart in
  einem Land oder einer Region investieren

• Der Kauf einer Aktie eines REITs ist gleichbedeutend mit dem Kauf eines Anteils am Immobilienportfolio
  und dem Cash-Flow, welcher aus den Mieteinnahmen resultiert, des REITs

• Der Erwerb einer Aktie eines REITs ermöglicht dem Investor Zugang zu spezialisierten
  Immobilienmanagern zu niedrigen Kosten und erspart dem Anleger den Aufwand des direkten
  Immobilienbesitzes

• Die Börsennotierung der REITs hat zwei Seiten. Aktienmärkte können phasenweise sehr hoher Volatilität
  ausgesetzt sein. Für langfristige Investoren mit stetigem Anlagebedarf bietet diese Volatilität hingegen
  immer wieder Gelegenheiten zum günstigen Einstieg, sofern diese Investoren, die Marktschwankungen
  tragen können und in der Lage sind, zu günstigen Zeitpunkten einzusteigen

B&I Capital                                                                                                  2
B&I Capital EINFÜHRUNG ZU REITS - B&I Capital AG
Anlageuniversum Schweizer Pensionskassen

       Aktien            Obligationen                   Immobilien                     Alternative Anlagen

                         Kotiert /                                                  Nicht kotiert
                        gehandelt

   Immobilien Aktien             Immobilien Anleihen                       Direkt                      Indirekt
 REITs                          Mortgage Backed Securities      RE Equity                     Anlagestiftungen
 RE Companies                   Mortgage Fund/REIT              RE Mezzanine Loan             Private Equity Fonds
 RE Funds                       Mortgage Bank Shares            Bridge Loan
 Property Derivatives                                           Mortgage

B&I Capital                                                                                                          3
B&I Capital EINFÜHRUNG ZU REITS - B&I Capital AG
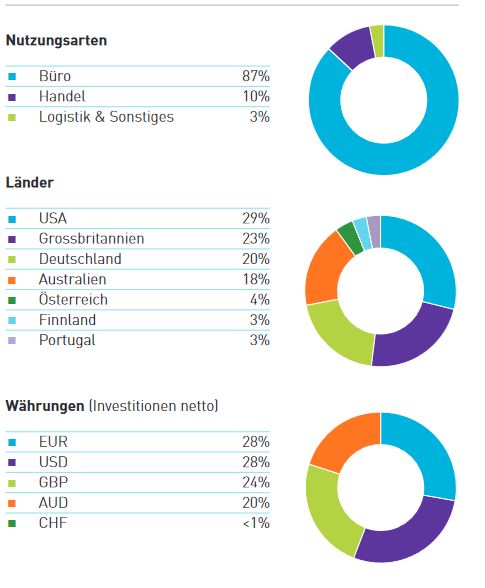
Merkmale von Equity REITs

Die Strukturen und die Gesetze für REITs variieren von Land zu Land. Die meisten REITs orientieren sich am
US-REIT Markt und haben die folgenden Merkmale:
• REITs besitzen ein Portfolio stabilisierter, laufende Mieteinnahmen generierender Immobilien mit einer
  hohen Vermietungsquote
• REITs sind in der Regel auf eine Region und eine Nutzungsart spezialisiert
• REITs müssen mindestens 90% des ordentlichen Ertrags als Dividende ausschütten, ansonsten verlieren
  sie ihren Steuervorteil
• REITs sind steuereffizient (REITs zahlen keine Körperschaftssteuer, es werden nur die Dividenden bei
  Ausschüttung beim Anleger besteuert)
• REITs sind börsennotiert
• REITs können intern oder extern gemanagt werden
• Der Verschuldungsgrad ist streng reguliert. Sowohl seitens des Gesetzgebers, als auch seitens der
  Aktionäre. Typisch ist eine Fremdkapitalquote von 30-50%

B&I Capital                                                                                                  4
Zusammensetzung des Globalen REIT Index
Number of REITs                             Länder                                    Number of REITs                        Nutzungsarten
160                                                                                   70
                                                                US, 53%
                                                                                                                REIT - Diversified, 11%                        REIT - Retail, 13%
140                                                                                   60

120                                                                                                             REIT - Office, 10%
            Canada, 3%                                                                50
100         Singapore, 3%                                                                                       Other, 8%                                     REIT - Residential, 14%
              UK, 5%                                                                  40
80
               Others, 7%                                                             30
60                                                                                                 REIT - Healthcare, 8%
                         Japan, 11%                                                                                                                           REIT - Industrial, 13%
                                                                                      20
40                          Australia, 4%                                                                                                   Developer, 10%
                            Hong Kong, 6%                                             10
20                                                                                             REIT - H&L, 4%                             REIT - Specialised, 9%
                            Germany, 6%
                            France, 2%
    0                                                                                 0
        0    100         200          300    400     500   600      700        800         0               50               100                 150                200              250
                                                              Market Capitalisation                                                                                Market Capitalisation
                                                                      (USD billion)                                                                                        (USD billion)
                                                                                                                                                      Source: B&I Capital, FTSE (January 2021)

•       80% des FTSE EPRA/NAREIT Developed Index sind REITs
•       Die USA sind mit Abstand am grössten im Index vertreten. Japan, Hong Kong, das Vereinigte Königreich und
        Australien sind andere wichtige Märkte
•       Beachtenswert ist, dass kein einzelner Sektor dominiert, sondern folgende Sektoren alle zwischen 8% und 14% liegen:
        Retail, Residential, Industrial, Diversified, Office, Healthcare, Specialised

B&I Capital                                                                                                                                                                                      5
Sektorentwicklung bei US-REITs
                                        Sektoren-Entwicklung des FTSE NAREIT All Equity REIT Index
                                                      Modern REITs   Traditional Core REITs

          100%

          80%
                                                                                                              50%

          60%                              83%

          40%

                                                                                                              49%
          20%

                                           17%
              0%
                                          Dec-10                                                            Mar-21

                                                                                                                          Source: B&I Capital, FTSE (March 2021)
                                                                                              Based on free-float adjusted market capitalization weighted index

                   •   Als Modern REITs bezeichnen wir Logistics, Data Center, Storage and Tower
                   •   Als Traditional Core REITs bezeichnen wir u.a. Retail, Office, Residential

B&I Capital                                                                                                                                                        6
Entwicklung der Quartals-Dividenden von US REITs
                Quarterly Dividends Paid by All Listed US Equity REITs

15,000                         Modern REITs      Traditional REITs

                                                                                                                           Q1 2008                          Q4 2020
10,000                                                                                            Dividends paid
                                                                                                                   USD m              %               USD m               %
                                                                                          Modern REITs              816              14%               4,152            39%
                                                                                          Traditional REITs        4,914             86%              6,391              61%
5,000                                                                                     Total                    5,729                             10,543

                                                                                                                      Source: Nareit T-Tracker® 2020 Q4, B&I Capital (March 2021)

     0
         2000    2002   2004   2006   2008    2010   2012    2014    2016   2018   2020

 •       Es zeigt sich, dass die traditionellen Sektoren sowohl von der Global Finanzkrise 2008, als auch von Covid-19 hart
         getroffen wurden
 •       Die modernen Nutzungsarten hingegen haben so gut wie keine Mieteinbussen verzeichnet

 B&I Capital                                                                                                                                                                        7
Die Entwicklung des globalen REIT Marktes
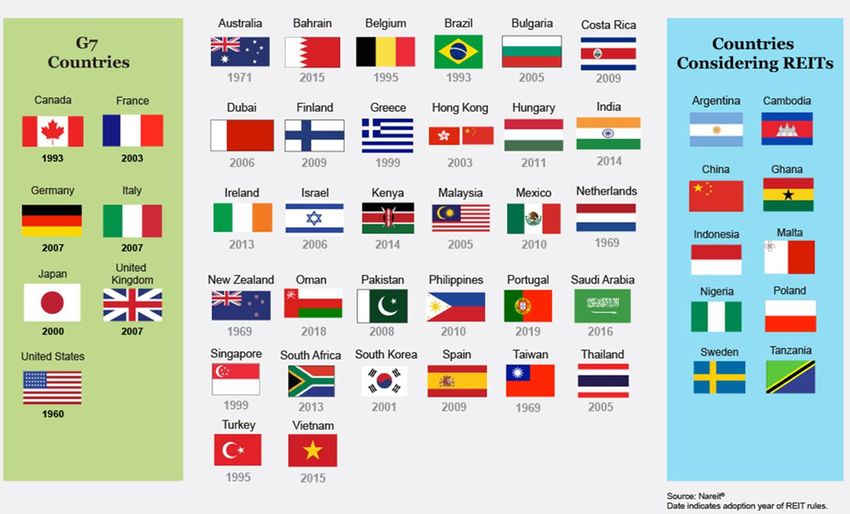
                   Länder, welche das REIT Modell eingeführt haben

                                                                     Source: NAREIT
B&I Capital                                                                           8
Geschichte des US REIT Marktes
                                      Evolution of Number and Market Capitalisation of Equity REITs in FTSE NAREIT All Equity Index                                                 Log Scale
                                                                        Number of REITs (LHS)           Market Capitalization (RHS)                                                 USD bn
200                                                                                                                                                                                      10,000

180
                                                                                                                 2001 Modernization Act
                                                                                                                  and added to S&P500
160                                                                                                                                                                                      1,000

140

120                                                                                                                                                 2016 Listed Real Estate              100
                                                                                                                                                       new GICS sector
100      1960 REITs created by US Congress             1991 First REIT Reaches $1 Billion
                                                            Market Capitalization
         1969 First European REIT legislation                                               1996 IRS Ruling Expands REIT Services
80                                                                                                                                                                                       10
            is passed in the Netherlands

60

40                                                                                                                                                                                       1
                                         1985 First REIT mutual fund launched
 20

 0                                                                                                                                                                                       0
      1971             1976               1981              1986                1991             1996              2001               2006   2011                2016

                                                                                                                                                         Source: B&I Capital, NAREIT (March 2021)

B&I Capital                                                                                                                                                                                    9
Die Einführung von REITs in Asien
                                                                                    Marktkapitalisierung*

                                                                                                                                                                                     Log Scale
                                                      Number of All REITs (LHS)                                    Market Cap of All REITS (RHS)
                                                                                                                                                                                     USD bn

    250                                                                                                                                                                                 1,000

    200
                                                                                                                                                                                        100

    150

                                                                                                                                                                                        10

    100

                                                                                                                                                                                        1
    50

      0                                                                                                                                                                                 0
          2002            2004               2006               2008              2010         2012         2014              2016                2018                 2020

    *Japan, Singapur, Hong Kong, Malaysia, Südkorea, Phllippinen, Thailand                                                           Source: B&I Capital, Bloomberg, DBS, Nomura (February 2021)

B&I Capital                                                                                                                                                                                        10
Jahresrenditen der Anlagekategorien
            2004         2005        2006        2007        2008        2009          2010         2011        2012        2013        2014        2015         2016        2017         2018          2019      2020                           CAGR p.a.

          RE Europe      EM        RE Europe      EM       HG Bnd         EM     REIT Asia        REIT US     REIT Asia   Sm Cap       REIT US RE Europe Sm Cap               EM     REIT Asia       Lg Cap      Sm Cap
                                                                                                                                                                                                                                     Lg Cap        9.6%
            53.4%       34.5%        66.4%      39.8%       5.2%        79.0%      43.1%           8.3%         32.9%      38.8%        28.0%    6.7%     21.3%             37.8%     11.3%           31.5%       20.0%
          REIT Asia      Asia        DAX         DAX        Cash        HY Bnd    REIT US         HG Bnd        DAX        Lg Cap     REIT Asia REIT US   HY Bnd              Asia     Cash          REIT US       Asia
                                                                                                                                                                                                                                       EM          9.4%
            36.8%       23.3%       35.9%       36.5%       1.4 %        57.5%     28.0%           7.8%        29.8%       32.4%        13.7%    2.8%     17.5%             32.2%       2.0%          28.7%       19.7%
           REIT US     Int'l Stk    REIT US      Asia      HY Bnd      RE Europe Sm Cap           HY Bnd      RE Europe     DAX        Lg Cap   Lg Cap   REIT Asia         RE Europe HG Bnd         RE Europe      EM
                                                                                                                                                                                                                                    REIT Asia      9.3%
            31.6%       14.0%        35.1%      14.3%      -26.4%        37.9%     26.9%           4.4%         29.5%      31.6%       13.7%     1.4%     13.3%              29.3%      0.0%          27.2%       18.7%
             EM        US-REIT        EM       Int'l Stk   Sm Cap         Asia      EM            Lg Cap       REIT US    Int'l Stk   RE Europe HG Bnd    Lg Cap              DAX     HY Bnd         Sm Cap      Lg Cap
                                                                                                                                                                                                                                     Sm Cap        9.2%
            26.0%       12.2%       32.6%       11.6%      -33.8%       37.6%     19.2%            2.1%         19.7%      23.3%        11.3%    0.6%     12.0%             28.3%      -2.3%          25.5%       18.4%
           Int'l Stk      DAX    REIT Asia      HG Bnd      Lg Cap     Int'l Stk      Asia      Cash            EM        RE Europe    HG Bnd      Cash           EM       Int'l Stk    REIT US  REIT Asia         DAX
                                                                                                                                                                                                                                     REIT US       8.8%
             21%         10.4%     32.2%         7.0%       -37.0%      32.5%       17.0%       0.1%           18.6%        16.6%       6.0%        0.1%       11.6%        25.6%        -4.1%     23.2%          13.5%
           Sm Cap      RE Europe Int'l Stk      Lg Cap     REIT Asia   REIT US      HY Bnd    Sm Cap          Int'l Stk      Asia      Sm Cap     Int'l Stk    REIT US      Lg Cap      Lg Cap      DAX          Int'l Stk
                                                                                                                                                                                                                                       Asia        7.4%
            18.3%         9.6%     26.9%         5.5%       -37.2%      28.0%        15.2%      -4.2%          17.9%       12.0%        4.9%       -0.4%         8.6%       21.8%        -4.4%      23%            8.3%
             Asia      REIT Asia  Sm Cap       REIT Asia    REIT US    Sm Cap       Lg Cap    Int'l Stk         Asia       HY Bnd      HY Bnd       DAX          Asia      Sm Cap       Sm Cap    Int'l Stk       HY Bnd
                                                                                                                                                                                                                                      DAX          7.4%
            18.2%         6.9%     18.4%         5.4%       -37.7%      27.2%       15.1%     -11.7%           16.8%        7.4%        2.5%       -1.6%        -4.9%       14.7%       -11.0%     22.7%           7.5%
            DAX         Lg Cap      Asia         Cash        Asia       Lg Cap     RE Europe RE Europe        Sm Cap      REIT Asia     DAX         Asia         DAX       REIT US     RE Europe    Asia         HG Bnd
                                                                                                                                                                                                                                     HY Bnd        7.4%
            16.2%         4.9%     16.5%         4.4%       -41.8%      26.5%        8.5%      -11.8%          16.4%        7.3%        2.2%       -2.0%        -3.5%        8.7%       -12.1%     19.4%           6.1%
            Lg Cap      Sm Cap      Lg Cap      HY Bnd       DAX         DAX          Int'l Stk   REIT Asia    Lg Cap      REIT US      Cash      Sm Cap       HG Bnd       HY Bnd      Int'l Stk     EM          Cash
                                                                                                                                                                                                                                    RE Europe      7.2%
            10.9%        4.6%       15.8%         2.2%     -42.8%       25.5%           8.2%       -13.1%      16.0%        2.9%        0.0%       -4.4%         2.7%        7.5%        -13.3%      18.9%         0.6%
            HY Bnd       Cash       HY Bnd      Sm Cap     Intl' Stk   REIT Asia       DAX          Asia       HY Bnd       Cash        Asia      HY Bnd       Int'l Stk   REIT Asia      Asia       HY Bnd     RE Europe
            10.9%        3.2%       11.8%        -1.6%      -43.1%      19.3%           7.7%       -15.1%      15.6%        0.1%        0.0%       -4.6%         1.5%        6.7%        -13.5%      14.4%        -2.0%              Int'l Stk     6.4%

           HG Bnd       HY Bnd       Cash       REIT US RE Europe       HG Bnd        HG Bnd        DAX        HG Bnd      HG Bnd        EM       REIT Asia     Cash        HG Bnd        EM         HG Bnd      REIT US
                                                                                                                                                                                                                                     HG Bnd        4.3%
            4.3%         2.7%        4.7%       -15.7%   -50.7%          5.9%          6.5%        -16.9%       4.2%        -2.0%      -1.8%        -5.4%        0.3%        3.5%       -14.5%        8.7%        -5.1%
            Cash        HG Bnd      HG Bnd     RE Europe   EM            Cash          Cash          EM         Cash         EM       Int'l Stk      EM       RE Europe      Cash         DAX         Cash      REIT Asia
                                                                                                                                                                                                                                      Cash         1.3%
            1.4%         2.4%        4.3%       -24.0%   -53.2%          0.2%          0.2%        -18.2%       0.1%        -2.3%      -4.5%       -14.6%       -7.3%        1.0%       -22.2%        2.1%        -5.9%
                                                            B&I PA      B&I PA        B&I PA       B&I PA      B&I PA      B&I PA      B&I PA      B&I PA      B&I PA     B&I PA     B&I PA     B&I PA     B&I PA
                                                            -34.5%      47.0%         26.6%        -17.2%      38.7%        6.3%       24.2%        0.9%        9.1%       15.8%       5.3%      24.6%      -5.1%
                                                                                                                                                              B&I Global B&I Global B&I Global B&I Global B&I Global **
                                                                                                                                                                5.9%       12.9%      -4.4%      31.7%      -3.6%

                                                                                                                                                                                                Source: UBS, novelinvestor.com, Bloomberg, B&I (January 2021)
                                                                                                                                                                                       **Class S until 31.12.2016, Class A since 01.01.2017, Class S since 01.01.2018

REIT US                FTSE NAREIT All Equity Index                       Lg Cap                   S&P 500 Index               EM                    MSCI Emerging Markets Index                 HG Bnd                Barclay's U.S. Aggregate Bond Index
REIT Asia              GPR 250 REIT Asia Pacific Index                    Sm Cap                   Russell 2000 Index          Asia                  MSCI Asia Pacific Index                     HY Bnd                BofAML US High Yield Master II Index
RE Europe              FTSE EPRA/NAREIT Developed Europe                  Int’l Stk                MSCI EAFE Index             DAX                   DAX                                         Cash                  3 Month Treasury Bill Rate

B&I Capital                                                                                                                                                                                                                                                         11
Rendite und Risiko der US Anlageklassen
          Average Annual Returns

                                                        March 2002 - March 2021
          16%
                                                                                                                FTSE NAREIT All Equity REITs

          14%
                                                                                                      Russel 2000 Growth
                                                                          NASDAQ Composite                             Russel 2000 Value
          12%
                                                                                         DJ US Total Stock Market
                                                                          S&P 500
          10%
                                                    Domestic Hi-Yield
          8%                                                             S&P Utilities

          6%
                         ML Corp/Govt

          4%
                0%                 5%       10%            15%            20%                25%                     30%                      35%

                                                                                                      Standard Deviation of Annual Returns
                                                                                                   Source: B&I Capital, NAREIT, REITWatch (May 2021)

                     •    US REITs bieten bessere risikoadjustierte Erträge als alle anderen Anlageklassen

B&I Capital                                                                                                                                            12
Korrelation der Anlagekategorien über 20 Jahre
                                                           Correlation between aggregate asset classes: 1998-2018

                           US Large Cap US Small Cap   Non US     Hedge Funds                  US Broad    US Long      US Other Non-US Fixed Unlisted Real US Listed          Other Real
                                                                              Private Equity
                             Equities     Equities     Equities     / TAA                    Fixed Income Duration FI Fixed Income Income        Estate     Equity REITs        Assets
US Large Cap Equities           -           0.92        0.89          0.92        0.85         0.05         -0.41        0.64         0.53         0.45           0.54            0.08
US Small Cap Equities                        -          0.88          0.79        0.89         0.04         -0.38        0.68         0.55         0.54           0.64            0.00
US Small Cap Equities                                     -           0.85        0.90         0.05         -0.38        0.70         0.61         0.49           0.57            -0.08
    Hedge Funds / TAA                                                  -          0.80          0.19        -0.21        0.72         0.55         0.41           0.52            -0.16
       Private Equity                                                               -          -0.01        -0.44        0.68         0.46         0.51            0.51           -0.14
US Broad Fixed Income                                                                            -          0.69         0.65         0.70         0.33           0.47            -0.35
    US Long Duration FI                                                                                       -          0.03         0.26         0.02           0.04            -0.12
US Other Fixed Income                                                                                                      -          0.82         0.61           0.69            -0.36
Non-US Fixed Income                                                                                                                     -          0.43           0.63            -0.22
    Unlisted Real Estate                                                                                                                             -            0.84            -0.06
US Listed Equity REITs                                                                                                                                              -             -0.13
     Other Real Assets                                                                                                                                                              -
                                                                                                                                                     Source: CEM Benchmarking (October 2020)

•     Langfristig haben US Equity REITs eine sehr hohe Korrelation zu nicht kotierten US Immobilien
•     Im selben Zeitraum haben US REITs wesentlich besser abgeschnitten als nicht kotierte US Immobilien (net returns of
      10.2% p.a. vs 7.5% p.a.) und dies bei vergleichbarer Volatilität (19.2% vs. 18.0%)

B&I Capital                                                                                                                                                                               13
Stetiges Dividendenwachstum
                         Dividend per Unit Growth p.a.                                                                      Compounding Dividend Growth
                            B&I Portfolio    Top 80 Global REITs*
                                                                                                             190
10%                                                                                                                                                                                                         aktiv
                                            8.2%                        7.9%                                 180
           7.3%                                    7.2%                                7.6%
                                                                6.7%
                                                                                              5.8%           170
                  5.1%
    5%                                                                                                       160
                         3.1%
                                                                                                             150
                                                                                                                                                                                                            passiv
    0%                                                                                                       140

                                                                                                             130

                                                                                                             120
-5%
                                                                                                             110

                                                                                                             100
                                -7.8%                                                                              2015   2016    2017      2018     2019    2020e        2021e       2022e       2023e
-10%
            2015-2019      2020e              2021e                2022e                  2023e                                  B&I Global        Top 80 Global REITs

                                                          Source: B&I Capital, FactSet, REITs (June 2021)                                                 Source: B&I Capital, FactSet, REITs (June 2020)
                                                   * Market capitalization weighted, 2022 initial forecast

•        Das kumulierte Dividendenwachstum unterscheidet REITs von Anleihen mit fester Verzinsung und führt langfristig zu besseren
         Renditen
•        Wir fokussieren uns auf stetiges und überdurchschnittliches Dividendenwachstum
•        Wir vermeiden REITs mit Financial Engineering, verwässernden Kapitalmassnahmen oder Akquisitionen, da solche REITs
         dauerhaft schlechter rentieren
•        Wir ersetzen Einzeltitel, welche in Zukunft niedrigeres Dividendenwachstum erwarten lassen mit solchen, die höheres
         Wachstum zeigen, aktiv

B&I Capital                                                                                                                                                                                          14
Die Stellschrauben des Dividendenwachstums

                                                        Kauf von
                                                       Immobilien

                                                                                  Weiter-
                                Kapital                   DPU
                                                                              entwicklung der
                              Management                 Drivers                Immobilien

                                                       Organisches
                                                      Mietwachstum

•   Gute REIT Manager sind in der Lage, Immobilienmanagement und Kapitalmarktmanagement zu kombinieren und zum
    jeweils richtigen Zeitpunkt die entsprechenden Massnahmen umzusetzen.
•   Wo im jeweiligen Marktzyklus stehen wir (Kapital und Immobilien) und worauf sollte sich der REIT Manager aktuell
    fokussieren?

B&I Capital                                                                                                            15
Bewertungen
                               Dividend Yield                                                  10 Year Government Yield
                      2007 Market Peak     Today     B&I Global                                  2007 Market Peak   Today

6%                                                                            6%

4%             3.8%                                                           4%
                                                       3.4%
                                                                       3.1%
                                    2.8%

2%                                                                            2%

0%                                                                            0%
         Australia             UK                  Japan          US               Australia       UK               Japan                        US

                                                                                                                    Source: B&I Capital, Bloomberg (June 8th 2021)

•    Die laufenden Dividendenrenditen von REITs sind noch relative hoch, insbesondere gegenüber den Staatsanleihen
•    Die geschätzte Bruttodividendenrendite des B&I Global Real Estate Funds liegt aktuell bei 3.2% p.a.

B&I Capital                                                                                                                                                   16
US REITs Dividendenrendite vs. 10-jährige US Treasury
                                         Spread    10 Year Treasury     US NAREIT Dividend Yield

         12%

         10%

         8%

         6%

         4%

         2%

         0%

         -2%
               2001   2003     2005      2007     2009           2011       2013          2015             2017               2019               2021

                                                                                                   Source: B&I Capital, Bloomberg, NAREIT (May 2021)

•   Der Renditespread zwischen US REITs und der 10-jährigen US Treasury ist mit ca. 170bps p.a. noch über dem
    historischen Durchschnitt von ca. 150bps p.a.
•   Im langjährigen Durchschnitt haben US REITs eine Dividendenrendite von ca. 4.6% p.a. geliefert.

B&I Capital                                                                                                                                             17
US REITs Aktienkapitalisierung vs. Immobilienwert
                             Median of Premium or Discount to NAV (RHS)   FTSE NAREIT All Equity REITs - Total Return (LHS)

        26,000                                                                                                                                         10%

        24,000
                                                                                                                                                       0%

        22,000
                                                                                                                                                       -10%

        20,000
                                                                                                                                                       -20%
        18,000

                                                                                                                                                       -30%
        16,000

                                                                                                                                                       -40%
        14,000

        12,000                                                                                                                                         -50%
              2016             2017                      2018             2019                        2020                            2021

                                                                                                                       Source: B&I Capital, FactSet (May 2021)

                     •   Börsennotierte REITs handeln im Durchschnitt aktuell mit einer Prämie zum
                         Immobilienwert

B&I Capital                                                                                                                                                      18
Investmentthemen
Global
•   REITs bieten Exposure zu den sich ändernden Gewohnheiten und Bedürfnissen (retail, industrial, healthcare, storage, data
    center, etc.)
•   REIT Renditen sind angesichts der relative hohen Sicherheit und des Dividendenwachstums noch immer unterbewertet
USA
•   Technologie- und Pharmafirmen mieten aufgurnd ihres fortgesetzten Eerfolges weitere Flächen an
•   Das weltweite Datenwachstum treibt die Nachfrage nach Telekom Tower und Datenzentren REITs an
•   Günstige Häuser sehen hohe Nachfrage (Affordable homes)
Europa
•   E-Commerce ist positive für Logistik
•   Self-storage sind im Vergleich zu den USA und Australien immer noch unterentwickelt
•   Betreutes Alterswohnen hat aufgrund des demografischen Wandels sehr gute Fundamentaldaten
Asien
•   Moderne Logistik ist nach wie sehr gefragt, nach dem das Überangebot aus 2018 abgebaut wurde
•   Einzelhandel für Güter des täglichen Bedarfs sind in Asien immer noch attraktiv
•   Ausgewählte Themen in Australien, z.B. 24/7 Tankstellen-Retail REITs

B&I Capital                                                                                                                    19
Positionierung B&I Global Fund vs Afiaa Anlagestiftung
     Sektor                                                                 Länder
        REIT - Industrial                                        24%                 US             51%
                                                                                  Japan        9%
     REIT - Specialised                                  18%                   Germany        7%
     REIT - Residential                                 17%                  Hong Kong        6%
                                                                                     UK      6%
             REIT - Retail                      10%                             Belgium      5%
                                                                               Australia    4%
     REIT - Diversified                       9%
                                                                                Canada      3%
            REIT - Office                   8%                              South Korea    2%
                                                                              Singapore    2%
     REIT - Healthcare                     7%                                 Indonesia    2%
                     Other            3%                                           India   2%
                                                                                  Spain    1%
               REIT - H&L            2%                                       Pan-Asian    1%

  Source: B&I Capital, B&I Global Fund as per end of May 2021 (June 2021)

                                                                                                          Source: Afiaa Globa lhttps://www.afiaa.com/images/afiaa_factsheet_global_de.pdf (June 2021)

B&I Capital                                                                                                                                                                               20
Aktives Fondsmanagement
                                                                 REIT -        REIT -                           REIT -        REIT -
                               REIT - Office   REIT - Retail                              REIT - Industrial                               REIT - H&L   Developer   Other         Total Active    Index Weights
                                                               Diversified   Healthcare                       Residential   Specialised
 North America                     0.4%           -6.6%          -0.9%         -2.2%           0.6%             -0.1%          8.4%         -1.0%        0.0%      -0.1%             -1.5%           58.7%
                 Canada           -0.3%           -0.9%          -0.3%         -0.2%            2.1%            -0.7%                                                                -0.3%            2.8%
                 US                0.7%           -5.7%          -0.5%         -2.0%           -1.5%            0.5%           8.4%         -1.0%                  -0.1%             -1.2%           55.8%
 Asia                             -2.6%            2.4%           0.1%         -0.1%           5.7%              1.0%         -0.2%         -0.4%        -8.7%     3.8%               1.0%           23.3%
                 Australia        -0.5%            0.6%          -1.5%                                           1.7%         -0.1%                                -0.1%              0.1%            3.4%
                 Hong Kong        -0.1%            0.7%                                                                                                  -4.3%     2.0%              -1.6%            5.6%
                 India                                                                         1.8%                                                                                   1.8%            0.0%
                 Japan            -1.8%           -0.3%           2.1%                         3.0%             -0.7%                       -0.3%        -3.6%                       -1.7%           11.0%
                 New Zealand      -0.1%                          -0.2%                                                                                                               -0.3%            0.3%
                 Pan-Asian                                                                     -0.2%                                                               1.9%               1.6%            0.2%
                 Singapore        -0.2%            1.4%          -0.3%         -0.1%           -0.8%                           -0.1%        -0.1%        -0.7%                       -0.9%            2.9%
                 South Korea                                                                    1.9%                                                                                  1.9%            0.0%
 Europe                            0.6%            1.0%           0.3%         1.9%             1.8%             0.9%          0.0%         -0.1%        -0.4%     -5.5%              0.4%           11.7%
                 Austria                                                                                                                                           -0.2%             -0.2%            0.2%
                 Belgium          -0.1%           -0.1%          -0.2%         1.9%             1.8%            -0.1%                                              -0.1%              3.2%            1.1%
                 Finland                                                                                                                                           -0.3%             -0.3%            0.3%
                 France                           -1.0%          -0.8%                                                                                              0.0%             -1.8%            1.8%
                 Germany          -0.2%            2.2%           1.6%                                           1.0%                                    -0.2%     -2.9%              1.4%            5.2%
                 Ireland          -0.1%                                                                          0.0%                                                                -0.1%            0.1%
                 Italy                            0.0%                                                                                                                                0.0%            0.0%
                 Netherlands       0.0%           -0.1%                                                                                                                              -0.2%            0.2%
                 Spain             1.0%                          -0.2%                                                                                                                0.8%            0.4%
                 Sweden                                                                                                                     -0.1%        -0.3%     -2.0%             -2.4%            2.4%
 Rest of World                    -0.5%           -0.7%           -1.1%        -0.4%           0.7%              1.5%          1.7%         0.0%         -0.1%     -1.5%             -0.5%            6.3%
                 Guernsey                                         0.0%                                                                                              0.0%             -0.1%            0.1%
                 Israel                                                                                                                                  -0.1%     -0.1%             -0.2%            0.2%
                 Norway                                                                                                                                            -0.2%             -0.2%            0.2%
                 Switzerland                                     -0.3%                                                                                    0.0%     -0.8%              -1.1%           1.1%
                 UK               -0.5%           -0.7%          -0.8%         -0.4%           0.7%              1.5%          1.7%                       0.0%     -0.4%              1.1%            4.7%
 Total Active                     -2.1%           -3.9%          -1.6%         -0.8%           8.9%             3.2%           9.9%         -1.5%        -9.2%     -3.4%            -0.6% *
 Index Weights                    10.0%           14.1%          10.9%          7.8%           13.1%            14.3%          9.4%         3.8%          9.2%      7.3%                             100.0%
                                                                                                                                                                           Source: B&I Capital, FTSE (May 2021)
                                                                                                                                                                                                         * cash

B&I Capital                                                                                                                                                                                                       21
Sirius – Beispiel Investmentprozess
1.20
                                                                                 NAV per share       Share Price        Meetings
                                                                                                                                                                      Virtuelles Meeting CEO
1.10

                                                                                                                                            Virtuelles Meeting CEO
1.00                         Besuch Head Office Berlin und Business
                                       Park Mahlsberg
                                                                              Meeting Berenberg Conference, München
0.90
              Conference Call mit CFO                            Kapitalmarkttag von Sirius                                    Virtuelles Meeting CEO

0.80
       Conference Call mit
        Head of Finance
0.70
                                                                                                                                                                              Gemeinsames EPRA Webinar
                                                                                                                                                                               "Operational Excellence"
0.60
                                                                                                 Conference Call bzgl. Covid
                                                  Gemeinsamer Investorenevent in Zürich
0.50

0.40
   Dec/17                     Jun/18                    Dec/18                       Jun/19                   Dec/19                     Jun/20                      Dec/20

                                                                                                                                                                          Source: Factset, B&I Capital (June 2021)

•      Direkter und regelmässiger Kontakt mit dem Management, Besuch der Liegenschaften
•      Interne Analyse der Finanzzahlen und Wachstumsperspektiven
•      Diskussion mit externen Analysten

B&I Capital                                                                                                                                                                                                  22
Sirius – Beispiel Investmentprozess
              Investmentempfehlung März 2018                                          Investorenevent Zürich Februar 2019

                                               Source: B&I Capital                                                          Source: B&I Capital

              Besuch Business Park Mahlsdorf
                                                                       Strategische Fokussierung auf Nische - Besitzer und
                                                                       Betreiber von Business Parks in Deutschland mit
                                                                       interessanten Wachstumsperspektiven:
                                                                       •   Erschliessen ungenutzter Flächen, Leerstandreduktion
                                                                           und Modernisierungsinvestitionen
                                                                       •   Akquisitionen unter Wiederbeschaffungswert,
                                                                           Discount für bereits bekannte künftige Leerstände

                                                 Source: B&I Capital

B&I Capital                                                                                                                               23
Global Peer Group
Total Return
                                                                    5.3 Years Performance (since inception)
80%

                                                                 MSCI ACWI Real Estate Net Total                B&I Global Real Estate Securities Fund
                                                                       Return USD Index
60%

40%

20%
                                                                                                                    FTSE EPRA/NAREIT Developed Index
                                                                                                                               Net TRI USD

 0%
       0%                   5%                       10%   15%             20%              25%      30%      35%              40%               45%              50%

-20%

-40%

-60%
       Source: B&I Capital, Bloomberg (April 2021)                                                                                                Annualized Volatility

B&I Capital                                                                                                                                                         24
B&I Global Performance
                                 B&I Global (Class S)                  FTSE EPRA/NAREIT Developed Index

               80%

               60%

               40%

               20%

                0%

              -20%

              -40%
                 Nov-15            Nov-16               Nov-17         Nov-18           Nov-19                  Nov-20
                                                                                                     Source: Bloomberg (May 2021)

                                                        Return          Return          Volatility           Sharpe Ratio
                                                   (Since Inception)    (1 year)         (1 year)              (1 year)
              B&I Global (Class S)                       60.5%          30.4%            16.2%*                    1.81*
              FTSE EPRA/NAREIT Developed Index           36.4%          33.8%            18.5%                     1.61
                                                                                                                 * swing-adjusted

B&I Capital                                                                                                                         25
Disclaimer
This is promotional material. The current document is intended for information purposes only and shall not to be used as recommendation or offer to buy and/or sell shares. This
presentation has been prepared by B&I Capital AG (Talacker 35, CH–8001 Zurich) with reference to the B&I Global Real Estate Securities Fund (hereafter referred to as “the Fund”).
The Fund is domiciled in Liechtenstein. This document may only be distributed in or from Switzerland to qualified investors within the meaning of Art. 10 Para. 3, 3bis and 3ter CISA. In
Switzerland, the Representative will be LB(Swiss) Investment AG, Claridenstrasse 20, CH–8002 Zurich, whilst the Paying agent is Bank LinthLLB AG, Zürcherstrasse 3, CH–8730 Uznach. In
respect of the units distributed in Switzerland, the competent Courts shall be at the registered office of the Representative in Switzerland. The Prospectus, Key Investor Information
Document, other applicable documents as well as the annual reports may be obtained free of charge at the office of the Swiss Representative.
While the greatest effort has been made to ensure the accuracy of the data, no liability lies with the authors for any inaccuracies that may be present. This document, the ideas and
themes it puts forward must be considered confidential and are not to be duplicated or distributed to any third party without the express consent of the managers of the Fund.
This presentation may contain forward-looking statements that involve risks and uncertainties. Actual future performance, outcomes and results may differ materially from those
expressed in forward-looking statements. The performance shown does not take account of any commissions and costs charged when subscribing to and redeeming shares. Past
performance may not be a reliable guide to future performance.
This presentation does not take into account individual investment objectives, your financial situation or particular needs. It does not purport to contain all the information needed to
evaluate the Fund. Prospective investors should make their own independent evaluation of an investment in the Fund and conduct their own investigations and analysis. Units of the
funds may not be offered, sold or otherwise transferred within the United States or to or for the account or benefit of US persons (as defined in the United States Securities Act 1933).
In the United Kingdom this document is communicated only to persons who have professional experience in matters relating to investments and who are investment professionals
within the meaning of Article 19(5) of the Financial Services and Markets Act 2000 (Financial Promotion) Order 2005. Any investment or investment activity to which it relates is available
only to such persons or will be engaged in only with such persons. Persons who do not have professional experience in matters relating to investments should not rely on it.
Source: London Stock Exchange Group plc and its group undertakings, including FTSE International Limited (collectively, the “LSE Group”), European Public Real Estate Association
(“EPRA”), and the National Association of Real Estate Investment Trusts (“Nareit”) (and together the “Licensor Parties”). © LSE Group 2021. FTSE Russell is a trading name of certain LSE
Group companies. “FTSE®” and “Russell®” are trade mark(s) of the relevant LSE Group companies and are used by any other LSE Group company under license. “Nareit® is a trade mark of
Nareit, “EPRA®” is a trade mark of EPRA and all are used by the LSE Group under license. All rights in the FTSE EPRA Nareit INDEXES or data vest in the Licensor Parties. The Licensor
Parties do not accept any liability for any errors or omissions in the indexes or data and no party may rely on any indexes or data contained in this communication. No further distribution
of data from the LSE Group is permitted without the relevant LSE Group company’s express written consent. The Licensor Parties do not promote, sponsor or endorse the content of this
communication.

B&I Capital                                                                                                                                                                                 26
Sie können auch lesen